US Government Bonds 10 YR Yield
No trades
Trade ideas
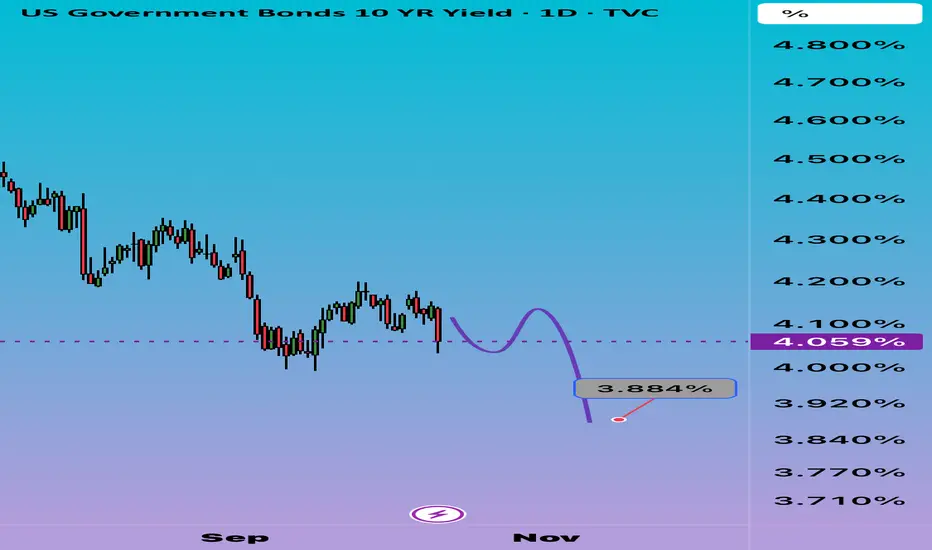
US10Y Bonds Signal Bullish Reversal Toward 4.08%US10Y Bonds Signal Bullish Reversal Toward 4.08%
US10Y Government Bonds formed a bullish reversal pattern and is showing signs of bullish momentum. The price is up nearly +1.25% over the past 6 hours.
This can be considered a strong momentum considering the economic calendar is empty.
I expect the price to go up to 4.08% at the moment.
The first and strongest target will be found near 4.02%. Once the price moves above the pattern, it should continue to rise higher to the second targets of 4.05% and 4.08%.
You may find more details in the chart!
Thank you and Good Luck!
❤️PS: Please support with a like or comment if you find this analysis useful for your trading day❤️

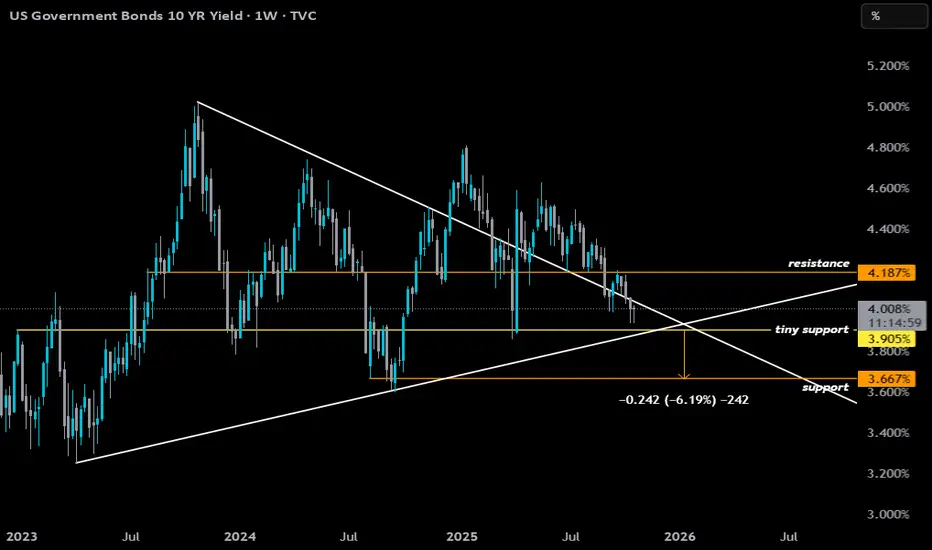
The Refi Setup: 10-Year Yield Compression📉 10-Year Yield Compression = Refi Setup
The 10Y is coiling inside a descending wedge around 4.00%, signaling upside exhaustion.
A break below 3.90% → 3.66% is the key trigger — that’s the rate-relief zone.
Macro backdrop (credit stress, weak growth, liquidity preference) tilts odds downward.
Yield compression = rate repricing = higher refi probability.
🧭 Key Levels
4.18% → Resistance ceiling
3.90% → Battleground (break = downside momentum)
3.66% → Breakdown confirmation
Measured move projects ~35–40 bps lower toward 3.65% — enough to reprice mortgage spreads .
💡 Refi Mechanics
10Y ↓ → 30Y mortgage rates ↓
4.00% = ~5.8% avg mortgage
3.65% = ~5.35% avg mortgage
Even a 40–50 bps drop can spark a refi wave, as millions cross their break-even line.
Falling yields = faster prepayments → servicers buy Treasuries → more yield compression → positive feedback loop for lower rates.
Stock Market New Highs on CPI? Lotto call option? Tomorrow is the CPI report.
Inflation headline number is expected to be 3.1%.
We will likely see a positive reaction tomorrow which should send the S&P500 to new all time highs.
If we gap up into new all time highs be very careful as this usually gets sold into.
We took a lotto call option on NASDAQ:CRML with members.
This is a pure speculative dead cat bounce play.

US 10Y TREASURY: Treasury market holds the line? Unlike US equities, crypto or gold markets, the US Treasury yields were relatively keeping their grounds during the previous week. Still, some concerns regarding the potential impact of US-China tariffs were at least for now resolved when the US President commented on social networks that they are not sustainable. The US Government is still in official status of “shutdown” so relevant macro data are lacking. At the same time, a new potential banking crisis was emerging in the news, through so-called NDFI (Non-deposit Financial Institutions) companies, raising concerns over potential spill-over effect.
The level of 4,0% has been tested during the week, with some swings around this level. The week started at 4,07%, but the lowest level reached was at 3,93%. However, at Friday's trading session, yields were back to the level of 4,0%, where they are closing the week. There is a lot of uncertainty currently shaping the market sentiment. In this sense, some higher volatility might be possible also during the week ahead. Charts are showing that the path toward the 3,9% is currently open, but only if the level 4,0% does not sustain the buying pressure. Still, what is unclear is what could be the catalyst for the 3,9% level?

US 10Y TREASURY: tariff shock sends yields lowerTreasury yields dropped further as markets reacted to the sudden escalation in U.S.–China trade tensions, after U.S. President’s announcement of a 100 % tariff on Chinese imports. The move deepened fears of economic disruption and amplified uncertainty around trade policy. This came in addition to already increased uncertainty considering that the U.S. Government is already 10 days in the state of “shutdown”. The U.S. benchmark 10Y bond yields dropped from the level of 4,15% down to 4,03%. They are ending the week at 4,05%.
The week ahead will be driven by fundamentals. It is expected that new information will be released by the US Government regarding announced trade tariffs. This will most certainly impose a higher market volatility. As per current charts there are two options for 10Y yields: on one side, some relaxation could bring yields back to levels above the 4,10%, while on the other hand, the level of 4,0% is missing testing.
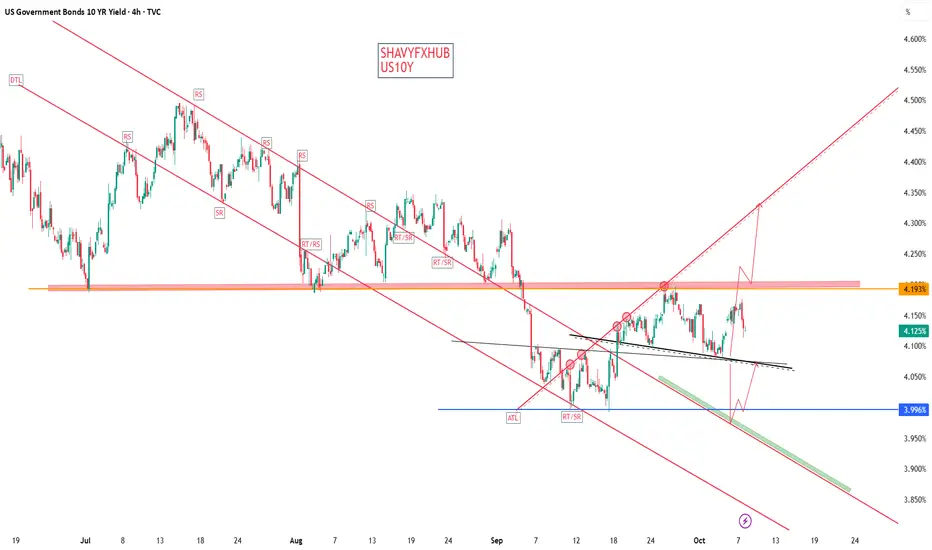
US10YUS10Y TECHNICAL DETAILS
4.193% A KEY RESISTANCE TO UPSWING
4.088% DEFENDED SUPPORT CURRENTLY
3.996 % LOW RECOVERED AND TESTED TWICE.ANY ATTEMPT ON THIS ZONE WILL BE A TECHNICAL DOWNSLIDE.
The US 10-year Treasury yield is approximately 4.125%
This yield represents the return investors expect for lending to the US government for 10 years and is a key benchmark influencing financial markets.
Dollar Index (DXY)
The DXY measures the value of the US dollar relative to a basket of major currencies , reflecting the dollar's strength amid global economic conditions such as interest rate differentials and geopolitical factors.
Relationship Between US10Y and DXY
The US10Y yield strongly influences the DXY because higher yields attract foreign capital, boosting demand for the dollar and strengthening the index.
When yields rise, the DXY usually follows upward due to investor demand for higher-yielding dollar assets.
Conversely, yields falling can weaken the dollar, reducing the DXY.
The relationship between bond yield and bond price is fundamental in bond investing and is characterized by an inverse correlation:
Key Concepts
Bond Price: The amount investors are willing to pay for a bond in the market. This can be above or below the bond’s face/par value.
Bond Yield: The return an investor expects to earn if the bond is held until maturity, expressed as a percentage. Several types include coupon rate, current yield, and yield to maturity (YTM).
Relationship Between Bond Yield and Bond Price
Inverse Relationship: When bond prices go up, bond yields go down; when bond prices fall, bond yields rise. This is because the fixed coupon payment represents a smaller or larger percentage of the bond’s market price depending on price changes.
Why? If interest rates in the market rise, new bonds offer higher yields. Existing bonds with lower coupons become less attractive, so their prices drop to increase their yield to competitiveness. Conversely, if market interest rates fall, existing bonds with higher coupons become more valuable, driving prices up and yields down.
Basic Formula Explanation
Current Yield = Annual Coupon Payment / Current Bond Price
Example:
A bond with a $1,000 face value and $50 annual coupon pays a 5% coupon rate.
If the bond price drops to $900, the current yield = $50 / $900 ≈ 5.56% (yield rises)
If the bond price rises to $1,100, the current yield = $50 / $1,100 ≈ 4.55% (yield falls)
More Accurate Measure: Yield to Maturity (YTM)
YTM accounts for the total return, including coupon payments and the gain or loss if the bond is held to maturity.
It reflects the discount rate that equates the present value of a bond’s cash flows (coupons + principal repayment) to its current market price.
Summary
Change Direction Effect on Bond Price and Yield
Interest Rates Rise Bond prices fall, bond yields rise
Interest Rates Fall Bond prices rise, bond yields fall
Bond Price Increases Bond yield decreases
Bond Price Decreases Bond yield increases
Bond investors must understand this inverse dynamic to manage portfolio risks and returns effectively.
NOTE ;IF YOU ARE A GOLD TRADER FOCUS ON DXY AND US10Y PRICE ACTION
#US10Y #BONDS #DXY #DOLLAR
US 10Y TREASURY: Shutdown fuels rate-cut speculationThe US Treasury bond market was focused on the US government “shutdown” during the previous week, estimating the implication which this shutdown could have on the macro segment on the US economy. The 10-year Treasury yield rose slightly to 4.154%, but reverted back as of the end of the week toward the 4,08%. Yields are closing the week at 4,119%.
The shutdown, which began on October 1, resulted from a failure by lawmakers to agree on a temporary spending bill. This impasse has led to the suspension of most government economic data releases, including the September jobs report, heightening uncertainty in the markets. Investors are particularly concerned about the potential impact on the Federal Reserve's upcoming policy decisions, as the lack of updated labor market data may influence the central bank's approach to interest rates.
Despite these challenges, markets are closely monitoring the situation, with expectations that the Federal Reserve may consider easing monetary policy if the shutdown persists and economic indicators weaken. The evolving political landscape and its effects on fiscal policy continue to be key factors influencing investor sentiment and Treasury yields.

US10Y & DXY downward trend continues. US10Y 4% triggers DXY 96.TVC:US10Y has been in a downward trend despite of US Fed holding the rates stable. In this blog space I have been following the downward sloping channel since Jan 2025. Since our May 2 prediction of a 4% in %US10Y we are very much on that glide path to lower low.
TVC:US10Y making new lows. 4% upcoming. 3.5% target low. for TVC:US10Y by RabishankarBiswal — TradingView
And then we add TVC:DXY into the mix which is also making lower lows and lower highs. I had a near term target of 96 on TVC:DXY and 90 by year end. This seems unreasonable now. I must change my outlook, when the charts change.
As we see, whenever TVC:DXY touches the lower bound of the downward slopping channel it tends to rebound to the mid-point of the channel. If it does so, then we might see a 100 on TVC:DXY Before we plunge down to 96 or lower.
Hence, I revise my prediction to be bullish on TVC:DXY , but that will have no impact on TVC:US10Y which is headed lower due to Fed cutting cycle and probably higher TVC:DXY dampening inflation.
Verdict: Revise our prediction: Short term bullish on OPOFINANCE:DXY. Long term bearish. Key levels: TVC:DXY to 100 first then 96. US10Y remains bearish with 4% by Dec 2025.

Bond Market Whiplash: September Ends with Yields Under PressureSeptember was a month of sharp swings for U.S. Treasuries. The 10-year yield started strong near 4.4% but lost momentum as political gridlock and growing bets on Fed rate cuts fuelled a flight to safety. Traders shifted from fearing inflation to bracing for slower growth and a possible government shutdown, sending yields drifting lower into month’s end.
What began as a hawkish month ended with markets pricing in caution — and the bond market once again reminding everyone that fear moves faster than policy.

US10Y UNITED STATES 10 YEAR TREASURY YIELD.THE US10Y defended 3.992% demand floor and its expected that 4.196% be broken ,amides government shut down market could be in caution mode.
GIVING BITCOIN AND GOLD A BUY RUN.
#US10Y #DOLLAR
10 Yr Bonds When most see a government shutdown as panic,
I see it as strategy.
Cutting unnecessary spending = stronger funding base.
This can pull 10-yr bonds toward 3%, giving investors steady confidence.
Panic for some.
Opportunity for others.

Freight Power and Economic Growth1. The Concept of Freight Power
Freight power can be conceptualized through multiple dimensions:
Transport Infrastructure Capacity: The total capacity of road, rail, air, and port networks to move goods. High-capacity networks enable faster and larger volume movement.
Logistics Efficiency: Includes time taken to move goods, reliability of delivery, customs efficiency, and the technology used for inventory and transport management.
Modal Diversity: The ability to move goods via multiple transport modes (road, rail, waterways, air) improves resilience and reduces bottlenecks.
Regulatory and Policy Environment: Policies that ease transport, reduce tariffs, and promote trade corridors enhance freight power.
Integration with Global Supply Chains: Freight power grows exponentially when a nation’s logistics system is connected to international trade networks.
Essentially, freight power reflects both the quantity and quality of freight movement and its ability to sustain continuous economic activity.
2. Freight Power as a Driver of Economic Growth
Freight power and economic growth are interdependent. Several mechanisms explain this relationship:
2.1 Reducing Transaction Costs
Efficient freight systems lower the cost of moving goods. This reduction in transaction costs allows businesses to expand markets, improve profitability, and attract investment. Lower transportation costs also reduce the final price of goods, increasing consumer purchasing power.
2.2 Enabling Industrial Expansion
Industrial growth depends on the timely movement of raw materials to factories and finished products to markets. Countries with strong freight power can support large-scale industrial hubs and complex manufacturing supply chains. For instance, China’s industrial growth is closely linked to its investment in railways, ports, and highways.
2.3 Promoting Trade Competitiveness
Freight power enhances a country’s ability to participate in international trade. Efficient ports and shipping corridors allow exporters to access global markets rapidly, reducing lead times and enhancing competitiveness. Economies with poor logistics infrastructure often suffer from delayed shipments, higher costs, and reduced trade volumes.
2.4 Stimulating Employment and Regional Development
Freight and logistics systems create direct employment in transport, warehousing, and infrastructure sectors. They also stimulate regional development by connecting remote areas to urban markets. Industrial zones near ports, rail hubs, or highways tend to grow faster due to easier access to inputs and markets.
2.5 Supporting Agricultural Growth
For agrarian economies, freight power is critical for moving perishable goods efficiently. Refrigerated transport, efficient rural roads, and cold storage systems reduce post-harvest losses and enhance farmers’ incomes.
3. Freight Power and Macroeconomic Indicators
The impact of freight power on economic growth can be traced through several macroeconomic indicators:
3.1 Gross Domestic Product (GDP)
Transport and logistics are part of the services sector, contributing directly to GDP. More importantly, freight efficiency indirectly boosts GDP by facilitating industrial output and trade expansion.
3.2 Trade Balance
Improved freight systems lower export costs and enhance the competitiveness of domestic products abroad. Efficient freight corridors can transform landlocked economies by providing faster access to ports, improving their trade balance.
3.3 Inflation and Price Stability
Efficient freight reduces distribution costs, which can dampen inflationary pressures. Conversely, logistics bottlenecks increase the cost of goods, contributing to price volatility.
3.4 Foreign Direct Investment (FDI)
Investors prefer locations with robust logistics infrastructure. Countries with strong freight power attract FDI in manufacturing, warehousing, and trade sectors, stimulating employment and technology transfer.
4. Modes of Freight and Their Economic Impact
Freight power depends on the efficient integration of multiple modes of transport:
4.1 Road Freight
Road networks provide door-to-door connectivity, critical for domestic trade. Well-maintained highways reduce travel time, fuel consumption, and vehicle maintenance costs, supporting small and medium enterprises (SMEs) and regional markets.
4.2 Rail Freight
Railways are ideal for bulk cargo like coal, minerals, and grains. Rail freight is more cost-efficient over long distances and supports industrial clusters. Countries like India and China have leveraged rail freight to boost heavy industries.
4.3 Maritime Freight
Seaports are the backbone of international trade. Containerization and port efficiency directly influence export-import volumes. Countries with strategic ports can become trade hubs, boosting employment and foreign exchange earnings.
4.4 Air Freight
Air freight is crucial for high-value, perishable, or time-sensitive goods. Though costly, it facilitates global integration for sectors like electronics, pharmaceuticals, and fashion.
4.5 Intermodal Freight
The combination of road, rail, and sea freight enhances efficiency and flexibility. Logistics parks, container depots, and technology-driven freight management systems increase economic output.
5. Case Studies: Freight Power and Economic Growth
5.1 China
China’s Belt and Road Initiative and domestic investment in high-speed rail, highways, and ports have dramatically increased freight power. This infrastructure surge has enabled China to dominate global manufacturing and exports, leading to sustained GDP growth over decades.
5.2 India
India’s freight corridors, like the Dedicated Freight Corridor (DFC), aim to decongest road networks and enhance rail freight efficiency. Improved freight power can stimulate industrial clusters, reduce logistics costs (currently among the highest globally), and promote regional development.
5.3 European Union
The EU’s integrated transport networks, including cross-border highways, rail corridors, and ports, support intra-European trade. Freight power facilitates the free movement of goods, enhancing GDP and employment across member states.
6. Challenges in Freight Power Development
Despite its importance, many economies face challenges in enhancing freight power:
Infrastructure Bottlenecks: Aging ports, congested highways, and limited rail networks constrain growth.
High Logistics Costs: Developing countries often incur 10–20% of GDP in logistics costs compared to 5–10% in developed nations.
Regulatory Hurdles: Complex customs procedures, inefficient permits, and cross-border restrictions impede freight movement.
Technological Gaps: Lack of digital tracking, automated warehouses, and intelligent transport systems reduce efficiency.
Environmental Concerns: Freight transport contributes significantly to carbon emissions. Sustainable solutions are essential for long-term economic and environmental balance.
7. Policy Recommendations
To maximize the contribution of freight power to economic growth, governments and private actors should consider:
Infrastructure Investment: Expand highways, railways, ports, and logistics parks. Public-private partnerships can accelerate this.
Technology Integration: Implement smart logistics systems, GPS tracking, automated warehouses, and AI-based transport management.
Regulatory Reforms: Simplify customs procedures, reduce bottlenecks, and harmonize cross-border regulations.
Sustainability Focus: Promote green transport, electric vehicles, and carbon-efficient shipping practices.
Skill Development: Train personnel in modern logistics management to increase efficiency.
Regional Integration: Develop freight corridors that connect industrial zones, ports, and urban centers.
8. Future Trends
The future of freight power and economic growth is shaped by:
Digital Freight Platforms: AI-driven platforms will optimize routes, reduce fuel consumption, and increase reliability.
Autonomous Transport: Self-driving trucks, drones, and automated port operations will reduce human dependency and improve speed.
Green Logistics: Pressure to decarbonize will drive innovations in alternative fuels and eco-friendly supply chains.
Global Supply Chain Integration: Countries that integrate freight networks with global supply chains will attract more trade and investment.
Conclusion
Freight power is a cornerstone of economic growth. Efficient, diversified, and technologically advanced freight systems reduce costs, enhance trade competitiveness, stimulate industrial and agricultural output, and foster regional development. Countries that strategically invest in freight infrastructure, integrate logistics with global markets, and adopt sustainable practices can achieve faster, more inclusive, and resilient economic growth.
The link between freight power and economic growth is not linear—it is dynamic and multifaceted. While infrastructure alone is insufficient, its combination with policy support, technology, and global integration determines the true economic potential of freight power.

US Shutdown... How Can This Impact Yields?A U.S. shutdown doesn’t just freeze Washington — it shakes Wall Street. Investors rush into Treasuries for safety, pulling long-term yields down, while missing data and fiscal fears can push short-term yields up. The curve bends under politics, not just economics, turning every extra day of gridlock into fresh market uncertainty.
The 10-year U.S. Treasury yield recently fell ~4.3 basis points to about 4.145 % amid safe-haven demand ahead of a possible shutdown.
The curve has shown signs of steepening: longer maturities have been under more pressure (yields up) relative to short maturities.

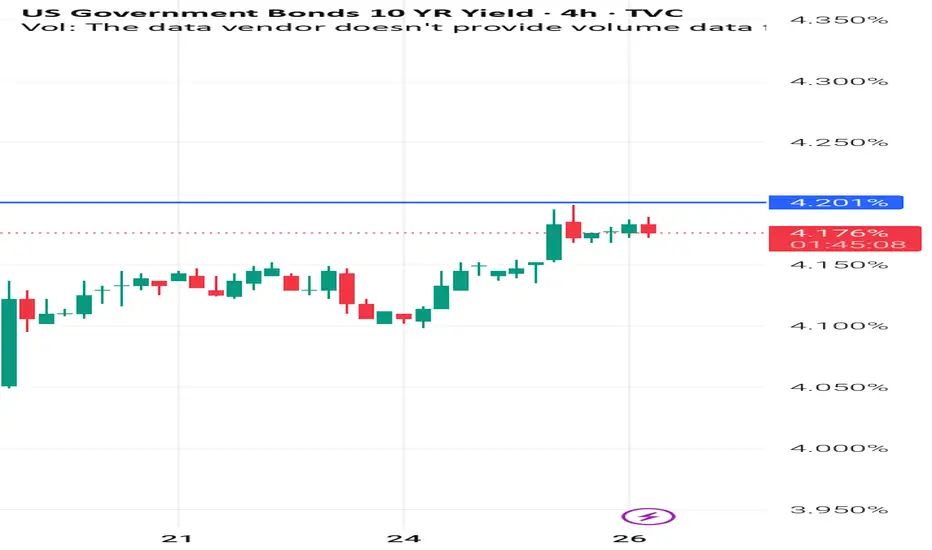
US 10Y TREASURY: rate cut bets hold, 10Y nears 4.20%U.S. Treasury yields moved mixed as markets awaited the release of the Personal Consumption Expenditures (PCE) Price Index, the Federal Reserve’s preferred inflation gauge. The data showed headline and core PCE readings for August came in around expectations of 2,7% y/y, reinforcing a view of moderate inflation. The data supported ongoing investor bets on two rate cuts before year’s end. Yields on the 10-year Treasury tested for one more time the 4,0%, after which they turned toward the upside, and ended the week at 4,18%.
The week ahead brings US jobs data, where another round of higher volatility might be triggered on financial markets. As per current expectations, the 4,20% is pending testing, which could occur during the week ahead. Some easing might also be expected, at least till levels around the 4,10%.

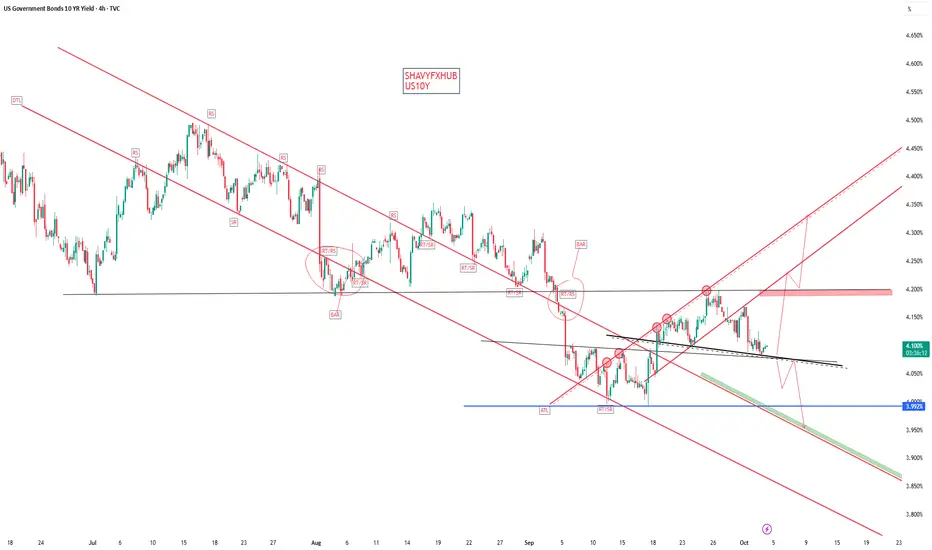
US10Y UNITED STATES 10 YEAR TREASURY BOND YIELD .THE US10Y DEFENED 4.096% AND if buyers retest 4.146% i will look long into a 4hr bullish channel and target 4.245%
the feds rate cut drop interest rate from 4.25%-4.5% to 4.0%-4.25% 25 basis point drop.
dollar rebound on feds chair speech despite inflation above 2% way above mandate .
key education information for reference .
The U.S. 10-year Treasury yield (US10Y) is a critical benchmark for interest rates in the economy and has a strong relationship with both Federal Reserve interest rate policy and the U.S. Dollar Index (DXY). Together, these factors significantly influence the strength of the U.S. dollar.
Correlation between US10Y and Interest Rates
The US10Y reflects market expectations for future interest rates and economic growth.
When the Federal Reserve raises short-term interest rates (Federal Funds Rate), it often leads to higher yields on longer-term bonds like the 10-year note, as investors anticipate sustained tightening and stronger economic conditions.
Conversely, when the Fed lowers rates or signals accommodative monetary policy, the US10Y often falls due to expectations of slower growth and lower inflation.
US10Y is thus a barometer of monetary policy expectations and long-term inflation outlook.
Correlation between US10Y and DXY
There is generally a positive correlation between US10Y and the DXY (U.S. Dollar Index).
When US10Y rises, U.S. bonds become more attractive to global investors, increasing demand for USD to buy those bonds.
This higher demand for USD pushes up the DXY, reflecting a stronger dollar.
Conversely, declining US10Y tends to reduce demand for dollar assets, weakening the DXY and the dollar.
Effect on Dollar Strength
Higher US10Y and rising interest rates typically strengthen the dollar because:
Investors seek higher returns in U.S. assets.
The carry trade becomes favorable, increasing capital inflows.
Economic confidence and inflation expectations rise, supporting dollar demand.
Lower US10Y and falling rates weaken the dollar as:
Returns on U.S. assets decline.
Capital may flow to other currencies with more attractive yields.
Market uncertainty or economic slowdown can reduce dollar demand.
Summary Table
Factor Effect on US10Y Effect on DXY/USD Strength
Fed Rate Hike US10Y rises DXY/USD strengthens
Fed Rate Cut US10Y falls DXY/USD weakens
Strong Economic Growth US10Y rises DXY/USD strengthens
Weak Economic Data US10Y falls DXY/USD weakens
Conclusion
The US10Y is both a reflection of and an influencer on Federal Reserve interest rate expectations. Its movements strongly correlate with the DXY, making it a key driver of U.S. dollar strength in global markets.
US10Y and Interest Rates
US10Y reflects market expectations of future interest rates and inflation.
When the Fed raises policy rates, or signals tightening, it generally drives US10Y higher as investors expect higher yields on longer maturities.
Conversely, Fed rate cuts or dovish signals typically lead to lower US10Y.
US10Y acts as a benchmark for mortgage rates, corporate borrowing, and influences overall financial conditions.
US10Y and DXY Correlation
US10Y and the DXY are positively correlated.
Rising US10Y attracts capital inflows into USD-denominated assets due to higher returns, strengthening the dollar and raising the DXY.
Falling US10Y reduces the attractiveness of dollar assets, weakening the dollar and lowering the DXY.
Impact on Dollar Strength
Higher interest rates (both short-term Fed rates and longer-term US10Y) boost dollar strength by enhancing yields, attracting investors, and improving economic outlook perceptions.
Lower interest rates weaken the dollar by reducing carry advantages and signaling weaker economic momentum.
Summary
Factor US10Y Direction DXY/USD Effect Explanation
Fed rate hikes Rise Dollar strengthens Higher yields attract foreign capital
Fed rate cuts Fall Dollar weakens Lower yields reduce investment appeal
Strong economic growth Rise Dollar strengthens Positive growth outlook supports higher yields
Economic slowdown Fall Dollar weakens Risk-off leads to lower yields and less USD demand
Thus, US10Y movements driven by Fed policy and economic data closely track the DXY and are major drivers of the dollar’s global strength.
#us10y #bonds #USD #DOLLAR


Interest Rates Dropped... Why Is Yields Rising?Why Yields Can Rise After a Rate Cut
When people say “interest rates dropped,” they usually mean central bank policy rates (like the Fed cutting rates).
But bond yields (like US10Y) are set in the open market, based on supply/demand and expectations about inflation, growth, and future rate paths.
Rate cuts can be inflationary: Lower borrowing costs can stimulate spending and growth, which raises inflation expectations → investors demand higher yields.
Market front-running: If the cut was already priced in, traders may rotate out of bonds (selling pushes prices down, yields up).

Core PCE in focus: What to trade?Core PCE data, the inflation metric the FED pays particular attention to, is in focus today. Especially since the USD has maintained its strength post FOMC, with Thursday's bout of positive data boosting dollar sentiment further.
An October rate cut is still very much on the cards, but a December cut is looking less likely than it did a week ago. The USD 10 YEAR is very close to that 4.2 area.
Today's data could be very binary for the USD. I imagine the MOM number will be the focus, concenciuos 0.2, which is lower than last month's 0.3. if the data doesn't appease the market, the US strength will likely continue as a December rate cut becomes less likely. Alternatively, a lower number will likely see the USD weaken into the weekend.
What to trade? Keeping it very simple, simultaneous opposing USD and CAD (GDP) data could create a USD CAD trade in either direction.
If the US and CAD data aligns, it would be a case of gauging the risk environment according to the US data. There could be a number of permutations according to the markets mood. And I'll be keeping an eye on the S&P, the US 10 YEAR and the VIX.
My preference is for, either: 'hot data' creating a clear and obvious USD long trade.
Or: soft data creating 'risk on', which would likely mean a USD or JPY short trade, depending on if the JPY follows yields lower or (inverse) stocks higher.
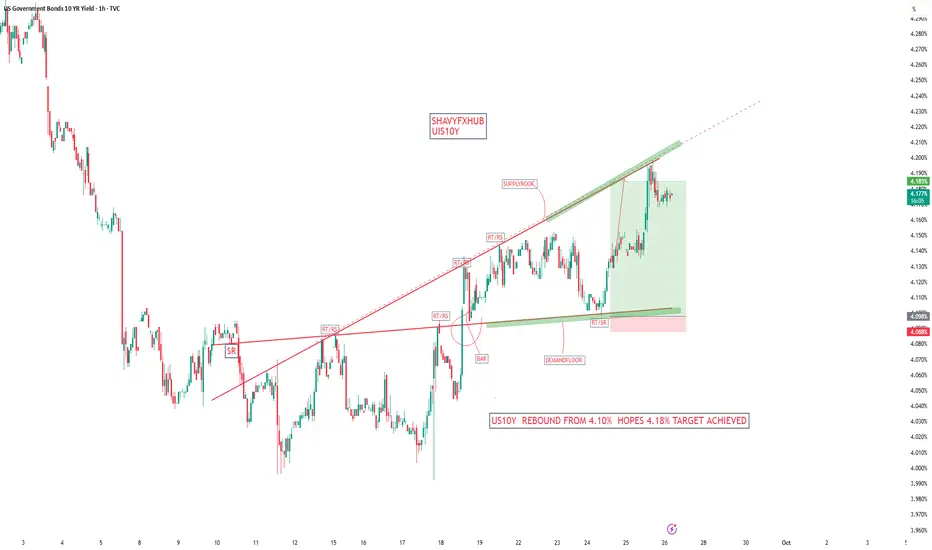
US10Y TARGET COMPLETED US10Y ,the barometer and bench mark tools to check the state of united economic health,
wehen invested have confidence in US10Y ,they do so with clarity that the economy will continue to grow and this sentiment strengthens the dollar index DXY.
WE HAVE SEEN A SHARP RISE AFTER THE HEAD OF FEDERAL SPEECH AND RATE CUT TO 4.0%-4.25%.
THE US10Y REACHED MY TP.
COMPLETE ANALYSIS AS POSTED .
#US10Y #DXY #DOLLAR
US10Y (10-Year Treasury Yield) Weekly TF 2025
📊 Chart Context
Current Yield: \~4.50%
Current Structure: Consolidation below major Fibonacci resistance, with multiple breakout and breakdown paths marked by confluence zones.
📉 Key Technical Observations
Bullish Scenario – Yield Rally (Rate Hike Cycle / Inflation Surprise)
TP1 (5.0%): 0.00% Fib level, psychological resistance.
TP2 (6.10%): 38.2% Fib + -27% extension zone.
TP3 (7.70%–7.91%): Major Fib confluence (-61.8% & 48.60% projection)
Bearish Scenario – Yield Drop (Rate Cuts / Recession)
Support 1 (3.91%): 23.6% Fib retracement, key structural demand.
Support 2 (3.22%): 38.2% retracement
Support 3 (2.74%): 48.6%
Support 4 (2.12%): 61.8%
Support 5 (1.33%): 78.6%
Forecast Scenarios (Based on Arrow Colors & Pathways):
Red Boxes & Zones: Critical Resistance / Reaction Zones
These are strong confluence levels that may trigger pullbacks before continuation.
Green Arrows – Bullish Projection with Pullbacks
Scenario A: Price may rally toward the 5.0% TP1 zone but experience a temporary pullback before continuing toward the 6.10% TP2 zone.
Scenario B: After a short-term correction near 6.10%, if bullish momentum sustains, yield may spike toward the 7.70–7.91% TP3 zone.
These movements reflect a stair-step advance with corrective legs between key levels — bullish macro outlook with intermittent risk events.
Pink Arrows – Bearish Pullbacks & Correction Phases:
Scenario A: Initial rejection from current zone (~4.5%) may send yields down to the 3.91% support confluence.
Scenario B: If support at 3.91% fails, yields may further retrace to 3.22% or 2.74%, activating the lower fib retracement zones.
After stabilizing in these zones, a rebound may begin and realign with the broader bullish structure.
These pink arrows suggest that even in bullish macro cycles, the market may correct deeply before resuming its ascent.
Macro & Fundamental Context:
1.Fed Pivot Dynamics: With inflation cooling and unemployment ticking higher, markets price in possible Fed rate cuts by late 2025.
2.Bond Demand Outlook: Recession fears and de-risking scenarios trigger massive flows into long-term Treasuries, pulling yields lower.
3.Global Liquidity Conditions: Lower yields = increased liquidity = favorable conditions for crypto, gold, and risk assets.
4.Hawkish Risk: Any oil shock or CPI surprise can pause or reverse easing expectations, pushing yields up.
Effects on Gold & Crypto (as scenarios play out):
↗ If US10Y Yields RISE to 6% or 7.7% (TP2/TP3)
* Gold: Likely to suffer due to rising real yields; institutional demand weakens.
* Crypto: Bearish; risk assets sell off amid higher opportunity cost and tighter liquidity.
* Dollar (DXY): May strengthen, applying more pressure on gold & crypto.
* Strategy: Favor defensive positioning. Look for shorting rallies or hedge exposures in BTC, ETH, and high-beta alts.
↘ If US10Y Yields FALL toward 3.2% to 2.1% (Support 2–4):
* Gold: Bullish. Lower yields reduce holding costs and boost safe-haven appeal.
* Crypto: Bullish. Liquidity rotation into high-risk assets often follows easing cycles.
* DXY: Likely to weaken, further supporting BTC and altcoins.
* Strategy: Look to accumulate crypto during dips. Gold may offer breakout opportunities.
Rangebound Near 4.5% (Current Zone):
* Gold: Mixed; capped upside until clear direction emerges.
* Crypto: Ranges or whipsaws. Watch for breakout signals from BTC.D and TOTAL3.
* Strategy: Stay cautious. Monitor DXY and macro events for confirmation.
Related Reference Charts
TOTAL3 – Altcoin Market Cap Weekly
BTC.D – Bitcoin Dominance Weekly

US 10Y TREASURY: yields bound despite Fed cutThe U.S. Federal Reserve cut its key interest rate by 25 basis points which was the first reduction this year. Fed Chair Jerome Powell signalled that future moves will depend on economic data rather than market expectations. Powell noted that while tariffs are beginning to lift some prices, their broader impact remains unclear, and the labor market is being more heavily influenced by declining immigration.
During the previous period the 10Y US benchmark yields were reacting strongly following the sentiment of potential Fed rate cut. In this sense the 10Y yields dropped sharply from 4,5% toward the 4%, which was the starting point for yields at the start of the previous week. Still, despite the Fed’s rate cut, the 10Y yields reverted back toward the 4,14%, driven by stronger GDP forecasts, slightly higher inflation, and concerns over growing government debt issuance. Investors are weighing not just short-term rate expectations but also the broader outlook for economic growth, inflation, and fiscal sustainability. Markets now await next week’s PCE inflation data for further insight into price pressures and potential Fed actions.
