The Bond Market IS Forward Looking..The Bond Market IS Forward Looking.. I digress for time restraint reasons today.
19:33:44 (UTC)
Mon Jun 1, 2020
US 30Y yield
No trades
Trade ideas

S&P500 & (30Y10Y)- Overlayed30Y yield - 10Y yield Overlayed w/ the SPX
For record,
19:36:39 (UTC)
Mon Jun 1, 2020

US30Y - following the path of the previously forecasted uptrend US30-year bond yields are following the uptrend that we forecasted in the post of April 28. It is currently in the final stages of minor wave 1 which is part of the 5 impulse waves that should lead yields to the area surrounding 2.44%, where intermediate wave 3 should be completed. FOLLOW SKYLINEPRO TO GET UPDATES.

US30Y Looking like it wants higherWith the market looking ready to accept risk again, and with the economic outlook improving, I think we have a nice set of circumstances for bond prices to come back to reality and come down a bit from their stratospheric levels. That said, this is the yield chart, so that move would be represented by US30Y going up because prices move inversely to yields.
Not going to trade it, but something I keep an eye on and I am thinking we'll see bond prices fall in the coming days into next week, barring any unforeseen news headline or development sparks a reversal in mindset.

US30Y - US long-term interest rates first stop at 2.44%US30Y finished intermediate wave 2 down and it started its way up to the most probable first stop at 2.44%. FOLLOW SKYLINEPRO TO GET UPDATES.

US30 CREATED H&S PATTERN US30 H4
-CREATED H&S PATTERN
-NEED NICK LINE BREAK OUT
-WAIT FOR SELL
=SELL SIGNAL


Very limited support leftThe green lines represent support/resistance since 1988, if those support failed, the entire concept will fail. Lebanon government announced default this weekend.


US 30 YR AT KEY LEVELLooking at 30 year UST yields key levels are at 2.2% and 2.4% on the weekly chart.
Break and close above 2.4% could indicate we have bottomed, but close below 2.2% and we're probably heading lower, meaning the rally in yields (sell-off in bonds) was a retracement of the heavy buying buying before the rally in treasuries continues.


On the fly...For those tracking the latest round of Fixed Income chart updates we have the final leg to the stool ahead right on time for NY. You will notice that on the back-end of the curve there is loud messages of a meaningful top being placed. The technical breakdown is indicating that we have another round of flattening towards key support at 32bps.
For the Chartpack today we have...
US 2s5s Curve :
US 2s10s Curve :
US 2s5s Curve:
The maps are crystal clear for US10Y Yields:
Highly recommend all those tracking Fixed Income to make note of the 2s5s10s and 2s5s30s " Fly " both breaking out with markets positioning ahead for 2020. Thanks for keeping all the support coming with likes, comments, charts, questions and etc! Best of luck those tracking for the end of the cycle and Fixed Income.

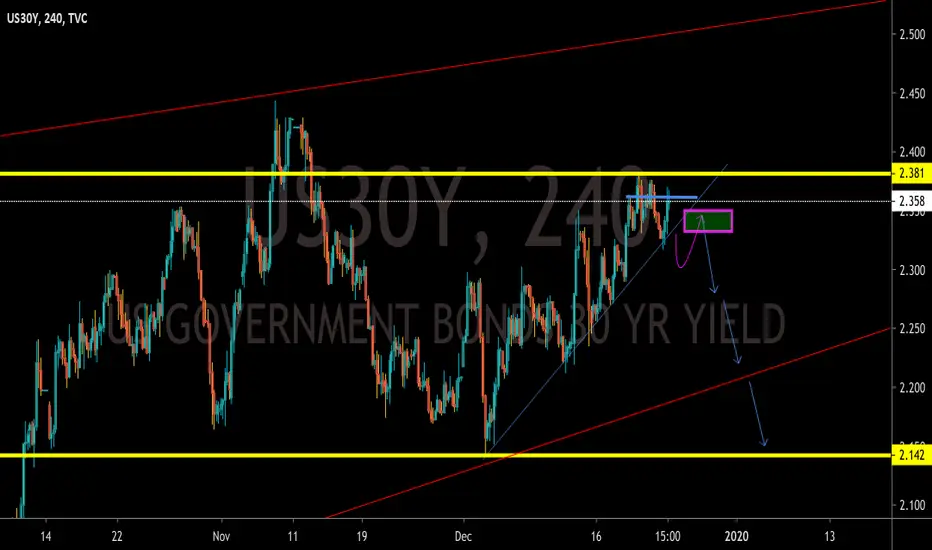
US30Y... try to break the trendline of 2019On the opposite of the 10y, the 30y fall the break the trendline of 2019, I pause may occurd with a return to 2.37% for take an impulsion to break the trendline.
Long at 2.37%


US30, Daily set upThis trade is not for any type of account, I do not recommend you enter if you have less than $10,000 dollar account
Risk management is needed
Good luck with this beast

US30 - DAILY CHARTHi, today we are going to talk about us30 and its current landscape.
ENTRY - Exclusive to Traders Heaven members
TARGET - Exclusive to Traders Heaven members
STOP - Exclusive to Traders Heaven members
Thank you for reading and leave your comments if you like.
To have access to our exclusive contents, and see more of our work join the Traders Heaven today! Link Below.
Disclaimer: All content of Golden Dragon has only educational and informational purposes, and never should be used or take it as financial advice.

Yields will keep going up?What do you think?
We're on an uptrend, looks like 2.7 will be the limit to me.
Post in comments.


