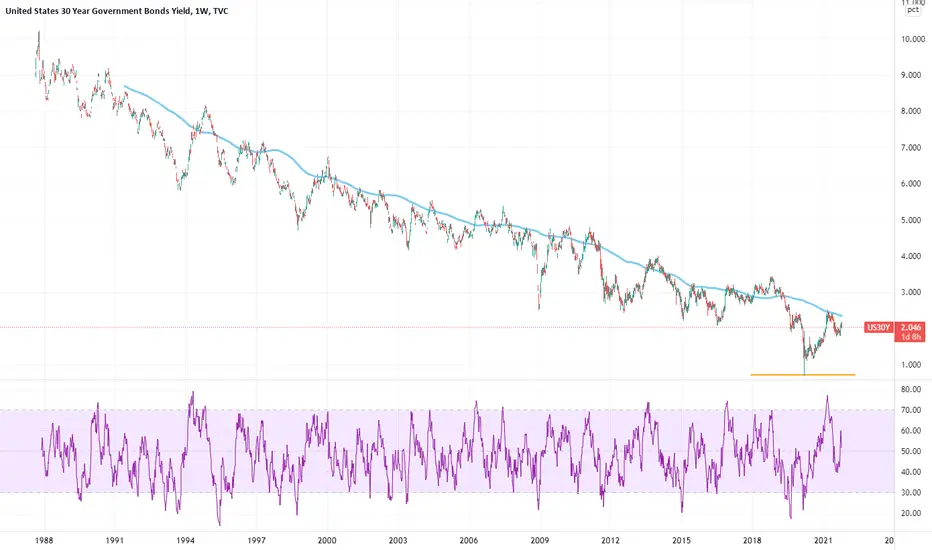
A clear sign of something massiveNot much to say here. In my honest opinion, Bonds are on watch. We could very clearly see an inversion here. Especially if the Fed raises rate or even enters QT.
US 30Y yield
No trades
Trade ideas

Avery clear signelHello!
I have been away for over a year now. I'm sorry for my absence. I have been working on a new business venture. I now have more time on my hands to produce charts again! With that said.
We are facing here a very clear inversion in bonds as the bond market sees buying and selling. Keep an eye on that as the market is pricing in a rate hike in my honest opinion.

Bitcoin, Treasuries, USD Retesting, All Telling Same StoryWhatever your opinion of these assets, they're all behaving in a fairly similar fashion, and they all have been behaving somewhat similarly over the last 3 years.
No surprise, bitcoin and foreign currencies ten to outperform when financial conditions are loose and loosening. The vice versa is likely true as financial conditions tighten.
Interestingly, if you pull up the charts on an individual basis, they all are retesting flags on a technical level. That doesn't mean they won't break back up and rally, but all three showing the same sign seems to add more weight behind likelihood that markets are in for a break upward in real rates and reduced liquidity / financial conditions.

US30Y/US05Y -ready for break out1 diamond formation at the bottom
w-d-4h
sign of normalization on bond markets will prompt quick-shifting on other asset classes
DXY-up
BTC, US100, US500 -down

US Government Bonds 30YR Yeld (US30Y)A FED taper is bullish for bonds. Since 2002, there's nearly a 90% correlation between the price movement of stocks and bonds. On 30's the key level of support is at 1.825%. A long bond position right now is a long VOL position. You are betting on weaker global growth and inflation expectations along with the potential for a major risk-off event that would trigger a surge in volatility.

US 30 year bond yields vs Growth - Value RatioUS 30 year bond yields vs Growth - Value Ratio ... maybe a pause for growth by beginning of 2022 ... Value will outperform when long term yields rise

US 30 YEARS - W1 - CLOUDS BROKEN !!!Last week price action triggered, as for the US 10 years, a long black candle which in this case also broke the weekly bottom clouds
support level @ 1.85.
The US 30 years is currently on an ongoing downtrend channel, very close to the 50 % Fibonacci retracement @ 1.6130 (0.71-2.5160); RSI below 50 @ 34.04.
Watch closely price ongoing price action and monitor closely the Lagging line which for the time being, after having successively broken the Mid Bollinger Band and the Kijun-Sen is
still above the clouds !!!
A failure, for the Lagging line to close on the next weekly closing basis above the clouds would add further pressure to the downside in putting the focus for lower levels towards the next
significant support area around 1.40% which is also the 61.8% Fibonacci retracement.
CONCLUSION :
As for the US 10 years, watch and monitor closely price action on a daily and intraday basis to detect early reversal signal (s) whihc for the time being should be seen as a corrective move in broad ongoing (yield) bearish trend.
Ironman8848

Macro - RecessionIdea for Macro:
- I'm of the opinion that Fed has already made a policy mistake.
- Recession has already begun, as per my September 29 idea and now confirmed by consumer sentiment.
- Likely the nominal yield falls below 1.000 again, and yield curve to invert once more.
GLHF
- DPT

Yield Curve & spreadsJust a screen shot for later review.
Watching 2's and 5's catch up to 10's and 30's.
Watch German & Japanese 10yr's for strength and/or weakness.
I'm a scalper following context, nothing more.

Trad-Fi's 40 Year Strong Chart of Truth 📉💡🧙🏻♀️Readers familiar with traditional financial world
will recognise the generational downtrend of
every interest rate (inverse of Bond prices) charts.
US 30 Year Bond Rates are set to go near zero before
the immortal rate Bear is final through.
TVC:US30
TVC:US30Y
NASDAQ:TLT
CBOT:UB1!

Yields can rise short term, but long term trend is lowerOver-indebtedness is deflationary.
US30Y will be going to 0.
US 5-30 Yield CurveI expected the 1.145 area to act as a good resistance level, but the extend of yesrdays pullback was something I did not see coming. Let's see what CPI numbers do before throwing in the towel

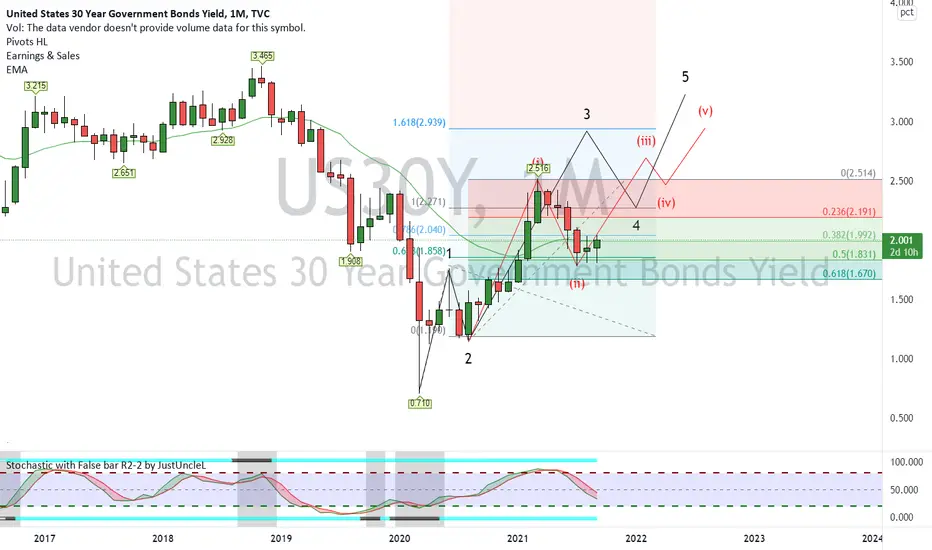
US30Y - Elliot Wave CountAs you can see , this count is for US30Y currently on a monthly basis
As of now a possibility of wave (iii) of wave 3 is to occur for a target 2.939
This count will be valid only if 1.780 is held whether wave 3 is extended or not
The Great Yield Beast of 2021Mind the right fang! If it bears its teeth further upwars, then GRAAAAAAAAAAAR

US Government Bonds 30YR Yeld (US30Y)Fed officials say tapering ‘may soon be warranted’ and interest rates rise penciled in for 2022. Powell says announcement on tapering bond purchases could come in November. The formal announcement could come at the Fed’s Nov. 2-3 meeting, barring a major setback for the economy or another coronavirus outbreak, Powell indicated. In updated projections, the Fed also penciled in three interest-rate hikes in 2023 and three more in 2024, bringing the benchmark interest rate up to 1.8% by the end of the period.
The fed stuck with its forecast that inflation would fade back toward 2.2% by next year. The central bank expects the rate of inflation to top out around 4.2% in 2021, according to its new projections. Growth in the U.S. economy, for its part, is expected to slow from an estimated 5.9% this year to 3.8% in 2022 and 2.5% in 2023. The economy’s long-term growth potential is viewed as about 2.5% a year. The unemployment rate is also forecast to fall to 3.5% by 2023 and match the 50-year low that existed prior to the onset of the pandemic. The unemployment rate is also forecast to fall to 3.5% by 2023 and match the 50-year low that existed prior to the onset of the pandemic.

GOLD rises again?its just an pure idea that helps gold rises again but it might be managed by DXY to stay in lower prices.

..an attempt to showcase the flatteningFlattening for the close. Getting a couple of questions re; flattening after the hints in previous idea, for those following 10s30s you will notice the test of 55/54bps is underway.
↳ The latest breakdown is implying we are at the minimum here in an ABC expectation leg towards support
↳ Inflation readings will be key to drive this one, this is signalling a dangerous environment for equities and risk in general going into September.
↳ To the other side, buyers will need to break through 11th May highs to call for reassessment in the flattening view.

ITS DXY 'S TURN AGAIN ???Good day fellas.
Look at US30Y and US10Y. It seams US10-30Y will push DXY higher again and all Dollar pairs will weak in future.
If positive correlation between DXY and BOND is remain yet, So, without any doubt its time to long and hold DXY again.
Be careful guys
good luck

Futures Levels | Look Ahead For the Week of Aug 15There's nothing much to see in the stock indices as the trends, or lack thereof (RTY1!), have continued. This week I'll be watching the 10Y rate to see if a retest of the recent lows matters at all to the broader market.
When things are slow, it's good to measure just how slow. I like to use the 7-D ATR to gauge volatility and I explain how to do so in this post.

Macro - Global Inflation Expectations Rolling OverSpeculation for Macro:
These are the underlying conditions:
- Inflation expectations are what leads risk appetite. After all, who would hold or buy an asset expected to depreciate in value?
- Global inflation expectations turning down and have been in a downtrend for decades. Of course it is deflationary. If DEBT fueled GDP growth (for appearances over results) misses expectations vs. the underlying conditions, what can you really do?
- AMZN missing expectations is a hint. Bonds and currencies lie less than stocks. Stocks are the last to get the message.
AMZN - This is a pattern prevalent globally right now. Look how it resolved in HSI, and now AMZN:
- Druckenmiller says that funds position for 18 months in advance. The sell-off in tech and lack of interest is a huge tell. In decelerating markets, sector losers will be sold off heavily.
- If you cant stimulate earnings & job growth by dumping money into stock buybacks, then you have failed. You will have price inflation ONLY, but it is not creating GDP growth nor lasting means to do so. Only raising DEBT, and then when you take away QE/negative rates you are left with nothing but high prices, and a big asset bubble. Now, we are to assume that investors will keep bidding up assets that are expected to depreciate in value? No they will just sell, and money managers see what is coming just from AMZN + GDP missing expectations.
- When you only have price inflation, but the population not accumulating capital, it will lead to consumers being priced out of discretionaries and demand will decrease. You will revert society back to demanding bare necessities, rather than creating innovation.
- You can keep pouring in money through QE, but rates cant go more negative... CBs will just eventually hold all of their own negative yielding debt and keep printing money when nobody is actually giving you money for the debt? How does it create GDP growth when the money they print is depreciating in value vs. existing debt which needs to eventually be financed?
- Debt is the deflationary force that money printing is fighting against. They need the economy such that it can eat away the debt without them pouring money into it, but if companies fail to produce increasing revenue while debt is increasing, they have failed.
- Then for the next crisis, your are left with no options except to lie down and take it.
- Institutional money will begin to sell off as they realize what is happening and data factors begin to confirm this trend.
Global Liquidity Providers with a red flag:
Softbank:
Evergrande:
Bitcoin/Blackrock - US equities have yet to factor in the selloff in Bitcoin (Bitcoin is the US liquidity provider/Shadow Bank IMO):
- What is the Trigger to actually sell the US equities though? How to action this global shift? Its very tricky obviously, but I am looking at the leaders (FAANG) which have upheld the bull run up till now as hard supports vs. the weakening market breadth. That's why AMZN is an important cue for me.
- Asia is the key. As we know, China is attempting to pop their asset bubble, and it is creating a deflationary wave which has reached HK and now Japan. It will spillover to EU and US without question.
- You can see the COVID and other fears being set up to be blamed as a 'catalyst' to blame, rather than CB's blatant failure to navigate the crisis.
- Of course, stocks aren't the economy... but when smart money realizes that revenue will decline, and no value will be created for them, of course they will sell. i.e. Its going to translate to revenue, innovation, dividends and stock buybacks.
I expect a correction at the very least in the near future in US equities, and a big one in the mid-long term. All I can do is short the setups and prepare for the big one.
But where will investors put their money then?
- Dollars, housing and bonds from the looks of it. Anything to escape the tail risk in equities. Even the junkiest of yields are below inflation as investors seek yield.
- It is a bit sinister, because the Fed is buying bonds and MBS's, and eventually it will be returned in theory. So they retain the ability to strike down the havens.
When new instruments which are riskier and riskier are created so that investors can obtain yield and institutions can sell their risk to them, it piles on more risk into the system, such that the threshold for a tail event is lowered. That is probably where the liquidity eventually flows to.
Just because there is an immense amount of money in the system doesn't mean investors won't sell that risk. When everyone is risk-on, wouldn't it create more yield to just flush risk assets first and then buy the dip?
The great Black Swan here is that inflation is indeed transitory. It would mean that even QE Infinity and negative rates cannot stimulate the economy.
How it Unfolds:
- While M Money Stock has increased, it has done little to reduce debt vs. money, nor increased GDP (growth YoY).
- The Credit Cycle is the beginning of liquidity flows. The global credit impulse is negative, meaning new inflationary credit is not created, and eventually, debt will be called instead. Inflation will be destroyed. Debt is at an all time high.
- For debt to be serviced, those institutions which have sold debt must now pull liquidity from assets in order to service the debt. While the assets have appreciated in monetary value, they have depreciated vs. debt, meaning that they will need to return more M Money than they borrowed. This means that at the end of it, there will be a money SHORTAGE!
GLHF
- DPT

2021-07-20 US 30Y Yield - retracementInteresting price action on US 30 year bond. Inverse head and shoulders potentially developing at previous breakout area.
Fibonacci retracement levels nicely coincide with current level.
There's always the backdrop of more QE and a deflationary shock that could result in a double bottom or worse... At least the floor is 0% right lol? What a mess

UNITED STATES 30 YEAR GOVERNMENT BONDS YIELD TVC Profitable Deals Not a Lot Of Indicators
Good Analyse = 85% Easy Money
You can text me for a business

Smart money positioning LONG USDOne thing they cant hide is the footprint of the money. Divergence in 5y US bond yields is a glaring indication that smart money is positioning LONG USD.
