AUDUSD FREE SIGNAL|SHORT|
✅AUDUSD price will soon enter the supply zone and may show a corrective reaction. A short-term pullback could confirm the retest, aligning with the next downside target near 0.6500. Time Frame 2H.
SHORT🔥
✅Like and subscribe to never miss a new idea!✅
Trade ideas

AUDUSD | 1H ChartAUDUSD | 1H Chart
Price has broken the last Lower High (LH), confirming a Market Structure Shift (MSS / CHoCH).
It also broke the neckline of a Double Bottom pattern.
Currently, price is retracing back to the neckline area — I’ll wait for it to reach the neck base for a potential buy entry targeting the next resistance zone.
🎯 Buy Target → 0.65240
OANDA:AUDUSD

AUDUSD Bullish Trade SetupTrend: Bearish
Divergence: Bullish
Reversal Pattern: Double Bottom
Bias: Bullish
Scenario:Entry at LH Break
Trade Plan
Stop Loss : 0.644
Entry Level: 0.65315
TP: 0.6635

AUDUSD Potential Sell SetupPrice approaching to previous Asian Session High combined with psychological level I’m expecting to price to go down. not financial advice
Entry: 0.65129
Stop Level: 0.65229
TP Level: 64700

AUDUSD Bearish oversold bounce back resistance at 0.6546The AUDUSD remains in a neutral trend, with recent price action showing signs of a corrective pullback within the broader uptrend.
Support Zone: 0.6475 – a key level from previous consolidation. Price is currently testing or approaching this level.
A bullish rebound from 0.6475 would confirm ongoing upside momentum, with potential targets at:
0.6546 – initial resistance
0.6575 – psychological and structural level
0.6590 – extended resistance on the longer-term chart
Bearish Scenario:
A confirmed break and daily close below 0.6475 would weaken the bullish outlook and suggest deeper downside risk toward:
0.6460 – minor support
0.6440 – stronger support and potential demand zone
Outlook:
Neutral bias remains intact while the AUDUSD trades around pivotal 0.6475 level. A sustained break below or above this level could shift momentum.
This communication is for informational purposes only and should not be viewed as any form of recommendation as to a particular course of action or as investment advice. It is not intended as an offer or solicitation for the purchase or sale of any financial instrument or as an official confirmation of any transaction. Opinions, estimates and assumptions expressed herein are made as of the date of this communication and are subject to change without notice. This communication has been prepared based upon information, including market prices, data and other information, believed to be reliable; however, Trade Nation does not warrant its completeness or accuracy. All market prices and market data contained in or attached to this communication are indicative and subject to change without notice.

SELL AUDUSD NOW - Profitable trade opportunity!Based on our deep analysis we can see that AUDUSD will head to the downside. Great time to SELL - it is currently in a MAJOR downtrend and is struggling to break past resistance levels. The next target is the support level to the downside. This is a great low risk high reward trade. SELL NOW!

AUDUSD - Signal#AUDUSD - Signal
H4 - Formation of a triangular structure in continuation of the 5th wave on D1 + rebound from the upper boundary. Stop behind the local maximum.
Entry: 0.64911
TP: 0.64416 - 0.64034 - 0.63570 - 0.63040
Stop: 0.65178

AUDUSD H4 | Heading Into 61.8% Fibonacci ResistanceBased on the H4 chart analysis, we could see the price rise to the sell entry which is a pullback resistance that aligns with the 61.8% Fibonacci retracement and could reverse from this level to the downside.
Sell entry is at 0.6548, which is a pullback resistance that lines up with the 61.8% Fibonacci retracement.
Stop loss is at 0.6621, which is a multi swing high resistance.
Take profit is at 0.6445, which is a multi swing low support.
High Risk Investment Warning
Trading Forex/CFDs on margin carries a high level of risk and may not be suitable for all investors. Leverage can work against you.
Stratos Markets Limited (tradu.com ):
CFDs are complex instruments and come with a high risk of losing money rapidly due to leverage. 65% of retail investor accounts lose money when trading CFDs with this provider. You should consider whether you understand how CFDs work and whether you can afford to take the high risk of losing your money.
Stratos Europe Ltd (tradu.com ):
CFDs are complex instruments and come with a high risk of losing money rapidly due to leverage. 66% of retail investor accounts lose money when trading CFDs with this provider. You should consider whether you understand how CFDs work and whether you can afford to take the high risk of losing your money.
Stratos Global LLC (tradu.com ):
Losses can exceed deposits.
Please be advised that the information presented on TradingView is provided to Tradu (‘Company’, ‘we’) by a third-party provider (‘TFA Global Pte Ltd’). Please be reminded that you are solely responsible for the trading decisions on your account. There is a very high degree of risk involved in trading. Any information and/or content is intended entirely for research, educational and informational purposes only and does not constitute investment or consultation advice or investment strategy. The information is not tailored to the investment needs of any specific person and therefore does not involve a consideration of any of the investment objectives, financial situation or needs of any viewer that may receive it. Kindly also note that past performance is not a reliable indicator of future results. Actual results may differ materially from those anticipated in forward-looking or past performance statements. We assume no liability as to the accuracy or completeness of any of the information and/or content provided herein and the Company cannot be held responsible for any omission, mistake nor for any loss or damage including without limitation to any loss of profit which may arise from reliance on any information supplied by TFA Global Pte Ltd.
The speaker(s) is neither an employee, agent nor representative of Tradu and is therefore acting independently. The opinions given are their own, constitute general market commentary, and do not constitute the opinion or advice of Tradu or any form of personal or investment advice. Tradu neither endorses nor guarantees offerings of third-party speakers, nor is Tradu responsible for the content, veracity or opinions of third-party speakers, presenters or participants.

AUD/USD Recovers, Are Gains Just Getting Started?Market Analysis: AUD/USD Recovers, Are Gains Just Getting Started?
AUD/USD is attempting a recovery wave from 0.6440.
Important Takeaways for AUD/USD Analysis Today
- The Aussie Dollar found support near 0.6440 and is now recovering against the US Dollar.
- There was a break above a key bearish trend line with resistance at 0.6490 on the hourly chart of AUD/USD.
AUD/USD Technical Analysis
On the hourly chart of AUD/USD, the pair dipped from well above 0.6600. The Aussie Dollar declined below 0.6500, but the bulls were active near 0.6440 against the US Dollar.
A low was formed near 0.6440, and the pair is now correcting losses. There was a move above the 23.6% Fib retracement level of the downward wave from the 0.6612 swing high to the 0.6440 low. There was also a break above a key bearish trend line with resistance at 0.6490.
The pair is now above 0.6500 and the 50-hour simple moving average. On the upside, immediate resistance is near the 50% Fib retracement at 0.6525.
The first major hurdle for the bulls could be 0.6545. A clear upside break above 0.6545 could send the pair toward 0.6610. The next area of interest on the AUD/USD chart is near 0.6650, above which the price could rise toward 0.6680. Any more gains might send the pair toward 0.6720.
On the downside, initial support is near 0.6490 or the 50-hour simple moving average. The key breakdown zone could be 0.6465 and 0.6440. Any more losses might send the pair toward 0.6400.
This article represents the opinion of the Companies operating under the FXOpen brand only. It is not to be construed as an offer, solicitation, or recommendation with respect to products and services provided by the Companies operating under the FXOpen brand, nor is it to be considered financial advice.

AUDUSD - Buy the dip at daily support!AUDUSD is still traveling inside a broader descending channel, but on the H1 we’ve carved a tight range/contracting structure.
Price is now approaching a daily support zone that aligns with the channel’s lower boundary and a local rising base—strong confluence for a bounce.
I’ll look for longs from the green support area after a clear H1 bullish reaction (wick rejections, bullish engulfing, or break–retest of the intraday lower-high line). If triggered, I’ll trail into the range highs first, then the upper orange boundary.
All Strategies Are Good; If Managed Properly!
~Richard Nasr.

Potential bearish drop off?The Aussie (AUD/USD) is reacting off the pivot which is an overlap resistance and could drop to the 1st support which acts as an overlap support.
Pivot: 0.6532
1st Support: 0.6400
1st Resistance: 0.6625
Disclaimer:
The above opinions given constitute general market commentary, and do not constitute the opinion or advice of IC Markets or any form of personal or investment advice.
Any opinions, news, research, analyses, prices, other information, or links to third-party sites contained on this website are provided on an "as-is" basis, are intended only to be informative, is not an advice nor a recommendation, nor research, or a record of our trading prices, or an offer of, or solicitation for a transaction in any financial instrument and thus should not be treated as such. The information provided does not involve any specific investment objectives, financial situation and needs of any specific person who may receive it. Please be aware, that past performance is not a reliable indicator of future performance and/or results. Past Performance or Forward-looking scenarios based upon the reasonable beliefs of the third-party provider are not a guarantee of future performance. Actual results may differ materially from those anticipated in forward-looking or past performance statements. IC Markets makes no representation or warranty and assumes no liability as to the accuracy or completeness of the information provided, nor any loss arising from any investment based on a recommendation, forecast or any information supplied by any third-party.

AUDUSD SELL 0.6593On the 4-hour chart, AUDUSD has stabilized and rebounded, and the short-term price is expected to continue to rise. Currently, attention can be paid to the resistance near 0.6593 above, which is a potential short position for a bearish bat pattern and is also within the previous supply zone.

AUD/USD Bulls Eye Mean Reversion HigherBearish volatility diminished last week, with AUD/USD printing a small bullish candle on the weekly chart. The daily chart suggests demand resides around 0.6450 with two lower spikes arriving on Tuesday and Friday, despite softer jobs figures from Australia reviving some hopes of a November RAB cut.
With prices having recovered back above the 200-day EMA and monthly S1 pivot, the bias is for mean reversion high on the daily chart towards trend resistance.
Bulls could seek dips towards the 200-day EMA in anticipation of a move towards the 0.6550 high-volume node (HVN) or bearish trendline.
Matt Simpson, Market Analyst at City Inde and Forex.com.

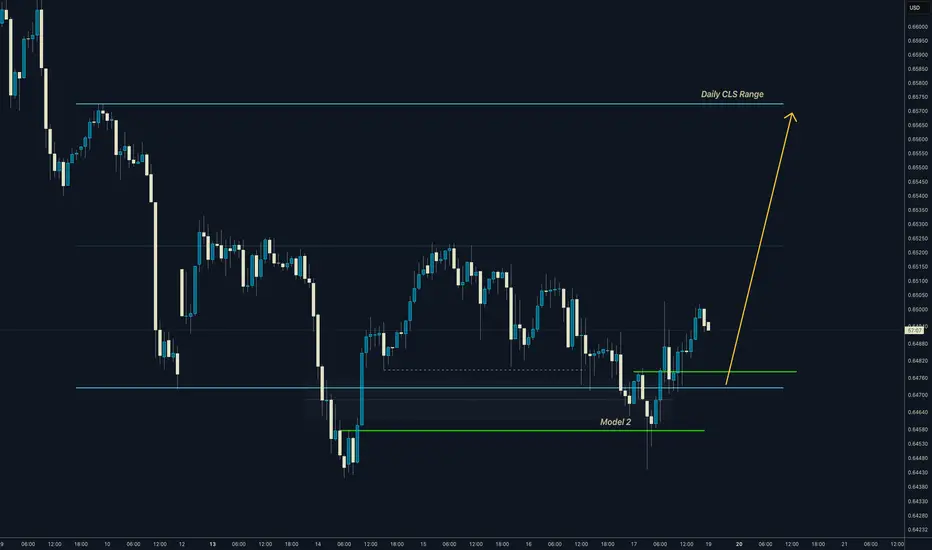
AUDUSD I Daily CLS Range I Model 2 Setup I Full range targetHi friends, new range created. As always we are looking for the manipulation in to the key level around the range. Don't forget confirmation switch from manipulation phase to the distribution phase to make the setup valid. Stay patient and enter only after change in order flow. If price reaches 50% of the range take partial or full close.
🧩 Complete proces and Strategy explained 👇 Click Below
🎯 Why your market approach also should be mechanical ?
NO Fixed Mechanical Trading Logic - You are guessing random patterns
NO Defined trading plan - Every trade different logic
NO Same logic in each trade - Not possible to backtest
NO Backtests on at least 300 trades - Not knowing Statistics
➡️ No Statistics ➡️ No Edge ➡️ Mindset ProblemS
🧠 Core of mindset problems
If you don't know your statistics on large enough data sample. You don't know your probabilities of win rate once the losing streak happen and it happens to every strategy. You will start doubting, hesitating to take next trade because you don't know statistics of your losses. In the end you will be doubting strategy and then jump to different one. You will be in the endless loop for years, looking for new better strategy. 👊 Your ultimate goal as a trader is not to be a generalist who knows 10 000 patterns. But rather create one system with narrowed criteria of each element of the trade to remove subjective and emotional decisions as much as possible and stick to this system no matter what. Practice it 10 000 times become a MASTER.
✨ Trading Mastery is reflection of your life
Have a longterm plan, No Alcohol & Drugs, Ignore others, Focus on your journey , Backtest regularly, Review your weeks, Journal mistakes, Exercise, Sleep well, Read books, Walks in nature (no phone) , Meditate, Reduce social media time, Spend time with family, Live Life.
Trading is hard, but not impossible. I believe in you 💪
David Perk aka Dave Fx Hunter
they need 0.64000 liquidity poolas you can see the price there is one liquidity pool price can reach to excute large orders
of course it will be my next trade

AUD/USD| Bullish Structure & Extreme OB ZoneBias: Bullish
4H Overview:
• High timeframe structure is bullish, price breaking significant highs.
• Move may look “funny/fishy” to those unfamiliar with reading price — strong trend behavior still intact.
30M–5M Refinement:
• Midterm structure mapped and refined.
• Order blocks refined and aligned within discounted areas.
• Orange OB sits right in the 50% equilibrium zone.
• Price currently mitigated into an extreme OB zone.
Lower Timeframe Focus:
• Waiting for lower timeframe confirmation: CHoCH → break of lower highs.
• Pullback into discounted OBs will define optimal entries.
Mindset Note:
Let smart money lead — watch price direction carefully, no forcing trades.

Inside the AUD/USD Pullback SetupsAs gold surges above $4,100 and the U.S. government faces fiscal paralysis. Learn how traders are using pullbacks trades with 30–50 pip stop-losses to capture explosive rebounds in AUD/USD.
Asia sweep plus 15 min ifvgThe low of the Asia session got swept
Soni waited for a 15 minute inversion fair value gap.
Took partials at internal liquidity
Stop to BE
Leaving the rest at external liquidity.
Nice RR

AUDUSD potential roadmapAUDUSD seems to have started w3 of wiii to the upside. beware w4? for further downside.

AUDUSD liveAUDUSD w3 or wC is unfolding. the correction up overnight will present another opportunity to enter the down trend. hold onto positions lock in 50% of current profit, strong possibility a major swing down will continue for another few weeks.

AUDUSD - SELL TP : 0.64403
SL : 0.6523
It looks H1 and H4 - Showed Strong Down Trend.
Daily - Might be toughed the highest price in 2025.
So, I am trading Sell. - Fibo in Daily Chart
It is one of my challenge.
Keep in mind - SL is important.
Good Luck.

AUDUSD The Target Is UP! BUY!
My dear friends,
Please, find my technical outlook for AUDUSD below:
The instrument tests an important psychological level 0.6487
Bias - Bullish
Technical Indicators: Supper Trend gives a precise Bullish signal, while Pivot Point HL predicts price changes and potential reversals in the market.
Target - 0.6498
Recommended Stop Loss - 0.6481
About Used Indicators:
Super-trend indicator is more useful in trending markets where there are clear uptrends and downtrends in price.
Disclosure: I am part of Trade Nation's Influencer program and receive a monthly fee for using their TradingView charts in my analysis.
———————————
WISH YOU ALL LUCK

AUDUSD Daily FRGNT Forecast - FRGNT FUN COUPON FRIDAY📅 Q4 | W42 | D17 | Y25|
📊 AUDUSD Daily FRGNT Forecast - FRGNT FUN COUPON FRIDAY
🔍 Analysis Approach:
I’m applying Smart Money Concepts, focusing on:
Identifying Points of Interest on the Higher Time Frames (HTFs) 🕰️
Using those POIs to define a clear trading range 📐
Refining those zones on Lower Time Frames (LTFs) 🔎
Waiting for a Break of Structure (BoS) for confirmation ✅
This method allows me to stay precise, disciplined, and aligned with the market narrative, rather than chasing price.
💡 My Motto:
"Capital management, discipline, and consistency in your trading edge."
A positive risk-to-reward ratio, paired with a high win rate, is the backbone of any solid trading plan 📈🔐
⚠️ Losses?
They’re part of the mathematical game of trading 🎲
They don’t define you — they’re necessary, they happen, and we move forward 📊➡️
🙏 I appreciate you taking the time to review my Daily Forecast.
Stay sharp, stay consistent, and protect your capital
— FRNGT 🚀
FX:AUDUSD
