AUDUSD TECHNICAL OUTLOOK
AUDUSD exchange rate in the forex window =0.65447
since April 2025 demand rally floor of 0.59165 Australian dollar demand owing to commodities demand globally broke the key resistance roof at 0.63740-0.63642,if GOLD /silver continues to rise AUD one more break of structure could touch 0.7000 level.
AU10Y=4.338%
RBA RATE =3.60%
US10Y=4.081%
FEDERAL FUND RATE = 3.75%-4.0%
INTEREST RATE DIFFERENTIAL =0.15%-0.4% FAVOUR USD BUT NEGLIGIBLE DUE TO NARROW SPREED
BOND YIELD DIFFERENTIAL= 0.257 FAVOUR AUD LONG
CARRY TRADE = FAVOUR AUD LONG
FUNDAMENTAL OUTLOOK.
HEAD OF RBA =MICHELE BULLOCK
HEAD OF FEDS =JEROME POWELL
RBA UPCOMING EVENTS ON 4TH NOVEMBER 2025
Cash Rate FORECAST 3.60% PREVIOUS 3.60%
RBA Monetary Policy Statement
RBA Rate Statement
RBA Press Conference
USD ECONOMIC DATA REPORT
4TH NOVERMBER
Tentative
JOLTS Job Openings FORECAST 7.21M PREVIOUS 7.23
5TH NOV
USD ADP Non-Farm Employment Change 28K -32K
Final Services PMI 55.1 55.2
ISM Services PMI 50.8 50.0
Crude Oil Inventories -6.9M
#AUDUSD #AU10Y #US10Y #DOLLAR #DXY
Trade ideas

AUDUSDAUDUSD 1hr timeframe trade plan
Pattern:Double bottom
Confirmation:Bullish Divergence
Strategy 1
Risk:0.75

AUDUSD Daily: Bearish
Wait for confirmation in 1hr timeframe
TP 1:4
Executing the same strategy every day, no matter what.

AUDUSD PAIR TREND ANALYSISAUDUSD PAIR TREND ANALYSIS FOR TREND DETECTION
we have seen a very bullish trend on this pair for so long and here we expect a minor correction to form up next towards the downside

Bullish Gartley
1. Entry Zone
The ideal entry zone for a BUY order is the Potential Reversal Zone (PRZ) between 0.6485 and 0.6505. The current price of 0.64994 is perfectly within this zone, offering a potential entry.
2. Stop Loss
To protect against the pattern failing, a stop loss should be placed just below the X point of the pattern.
Stop Loss: Below 0.64433 (the X point). A logical level would be 0.6435.
3. Profit Targets (Take Profit Levels)
Targets are based on Fibonacci retracements of the entire CD leg or the XA leg.
TP1: 0.65500 (Previous resistance)
TP2: 0.66000 (Key level, often a 0.618 retracement of AD)
TP3: 0.66500 (Equal to the X point or a significant resistance level)
Summary of the Corrected Trade Plan
Component Level / Action
Pattern Bullish Gartley
Bias Buy
Entry Zone 0.6485 - 0.6505
Stop Loss (SL) 0.6435
Take Profit 1 (TP1) 0.65500
Take Profit 2 (TP2) 0.66000
Take Profit 3 (TP3) 0.66500
if you think it's a good idea please 🚀 boost

Uptrend It is expected that a trend change will take place within the current resistance range and we will witness the beginning of a correction.

AUDUSD FRGNT Daily Forecast - Q4 | W44 | D31| Y25 |📅 Q4 | W44 | D31| Y25 |
📊 AUDUSD FRGNT Daily Forecast
🔍 Analysis Approach:
I’m applying Smart Money Concepts, focusing on:
Identifying Points of Interest on the Higher Time Frames (HTFs) 🕰️
Using those POIs to define a clear trading range 📐
Refining those zones on Lower Time Frames (LTFs) 🔎
Waiting for a Break of Structure (BoS) for confirmation ✅
This method allows me to stay precise, disciplined, and aligned with the market narrative, rather than chasing price.
💡 My Motto:
"Capital management, discipline, and consistency in your trading edge."
A positive risk-to-reward ratio, paired with a high win rate, is the backbone of any solid trading plan 📈🔐
⚠️ Losses?
They’re part of the mathematical game of trading 🎲
They don’t define you — they’re necessary, they happen, and we move forward 📊➡️
🙏 I appreciate you taking the time to review my Daily Forecast.
Stay sharp, stay consistent, and protect your capital
— FRNGT 🚀
OANDA:AUDUSD

check the trend Considering the price behavior in the current support range, possible scenarios have been identified.
As long as the price fluctuates above the support range, an upward trend is likely.

Bullish bounce off?The Aussie (AUD/USD) has bounced off the pivot and could potentially rise to the 1st resistance, which is an overlap resistance.
Pivot: 0.6539
1st Support: 0.6521
1st Resistance: 0.6581
Disclaimer:
The above opinions given constitute general market commentary, and do not constitute the opinion or advice of IC Markets or any form of personal or investment advice.
Any opinions, news, research, analyses, prices, other information, or links to third-party sites contained on this website are provided on an "as-is" basis, are intended only to be informative, is not an advice nor a recommendation, nor research, or a record of our trading prices, or an offer of, or solicitation for a transaction in any financial instrument and thus should not be treated as such. The information provided does not involve any specific investment objectives, financial situation and needs of any specific person who may receive it. Please be aware, that past performance is not a reliable indicator of future performance and/or results. Past Performance or Forward-looking scenarios based upon the reasonable beliefs of the third-party provider are not a guarantee of future performance. Actual results may differ materially from those anticipated in forward-looking or past performance statements. IC Markets makes no representation or warranty and assumes no liability as to the accuracy or completeness of the information provided, nor any loss arising from any investment based on a recommendation, forecast or any information supplied by any third-party.

AUDUSD: Long Signal Explained
AUDUSD
- Classic bullish pattern
- Our team expects retracement
SUGGESTED TRADE:
Swing Trade
Buy AUDUSD
Entry - 0.6552
Stop - 0.6540
Take - 0.6575
Our Risk - 1%
Start protection of your profits from lower levels
Disclosure: I am part of Trade Nation's Influencer program and receive a monthly fee for using their TradingView charts in my analysis.
❤️ Please, support our work with like & comment! ❤️

AUD/USD: Testing Resistance Confluence After Triangle BreakoutAUD/USD is testing the upper boundary of consolidation near 0.6624 after a breakout from an ascending triangle. Price is now interacting with both a downward and upward trendline, forming a key confluence zone that may act as an exhaustion point.
A rejection here could trigger a pullback toward 0.6529, signaling a short-term retracement phase. If momentum stalls near the 0.6620–0.6640 resistance range, bears may regain control.

AUDUSD 1H Long AB=CD Pattern
Price bounced at 0.382 Fib level.
Simple breakout plan.
Cup and Handle forming at 4H timeframe.

AUD/USD in focus ahead of CPI, FOMC and Trump-Xi summitAhead of the release of inflation data from Australia and the Fed's rate decision, both on Wednesday, the AUD/USD was among the strongest FX pairs our there today, rising in tandem with stock indices. The pair has broken out of a short-term bear channel and risen above its 21--day exponential average. Key short-term support now comes in at 0.6500-0.6530 area, and resistance around 0.6580-0.6600.
Rising expectations that the Trump-Xi meeting will result in the extension of the trade truce between the world's largest economy continues to underpin the risk rally, which has benefitted the Aussie.
The AUD/USD will face a key test, not only due to the Trump-Xi summit which is likely to take place on Thursday, but we will also have CPI data from Australia and a likely rate cut decision from the Fed on Wednesday to look forward to.
Australia's CPI is due at 12:30 GMT in the early hours of Wednesday. A 1.1% quarter-over-quarter reading is expected, up from 0.7% in the previous quarter, while the year-over-year rate is seen edging higher to 3.1% from 3.0% previously.
Earlier this week, RBA’s Gov Bullock said:
- We will have to decide whether need cut to help job market
- Unemployment Could Come Down Again Next Month
- Monthly Numbers Can Be Volatile But Unemployment Rate Jump Was Surprise
- Unemployment Rise Was Not A Huge Amount Above Forecast
- Board Is Cautious About Policy, Rates Still A Bit Restrictive
While a rate cut is not out of the question, the RBA is among the more hawkish of central banks out there, and should the US-China trade relations improve, we could see further appreciation in the Aussie dollar - especially in light of the pair breakout out of its bearish channel.
By Fawad Razaqzada, market analyst with FOREX.com

AUD/USD: Buy Opportunity, Forecast for Continued Rise!The AUD/USD pair has shown strong signs of upward movement in recent days. This is especially true in the context of strong economic data from Australia, particularly core inflation, and the expectation that the RBA will not cut interest rates in the short term, which has strengthened the AUD. Additionally, the market continues to maintain confidence in Australia's monetary policies.
The 4-hour chart shows that the AUD/USD pair is in a clear uptrend, breaking through previous resistance levels and staying above the rising trendline. The pair is now approaching the resistance at 0.66500; if this level is broken, the price could continue to rise towards 0.66800 or higher in the short term. The nearest support level is 0.65800, where the price is creating a new bottom and maintaining the upward trend.
Conclusion: With strong economic data and support from solid resistance levels, AUD/USD is likely to continue rising in the short term. Traders can consider buying near the 0.65800 support zone with a target towards 0.66500.

AUD/USD Snaps 5-Day Winning Streak At ResistanceThe less-dovish-than-expected FOMC meeting overshadowed Australia’s hot CPI report, sending AUD/USD lower after a five-day winning streak. Price action printed a bearish pinbar around the 0.66 handle, aligning with the October VPOC and monthly pivot point — a confluence that triggered profit-taking among bulls.
On the hourly chart, a bullish pinbar and doji have formed around the weekly R2 pivot, with RSI deeply oversold. A minor intraday bounce in Asia looks likely, though sellers could fade rallies toward 0.6573 (weekly R1) or 0.6528 (gap support).
If a retracement lower unfolds, I’ll be watching for signs of a swing low on the daily chart — a potential springboard for the next leg higher in the Australian dollar towards its 200-week EMA.
Matt Simpson, Market Analyst at City Index and Forex.com

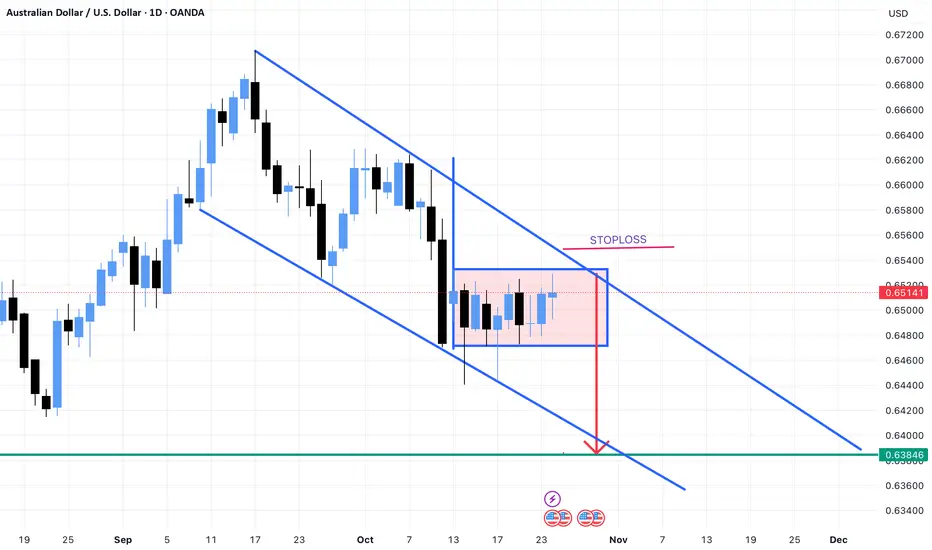
19-10-2025 _ Short Term Bullish Idea _ AUDUSD H41- Price is moving in a Descending Channel.
2- Price bounced from the bottom of the channel, retraced and formed Double Bottom, coupled with Bullish Divergence on the MAs.
3- Strong Bullish Momentum - Three White Solders
4- Therefore, after retracement one can expect a push to the UP Side.

Australian Dollar Rises Above $0.660Australian Dollar Rises Above $0.660
According to the AUD/USD chart today, the Australian dollar has climbed to its highest level in three weeks. The currency’s strength stems from the following factors:
→ Australia’s monthly consumer price index (CPI) came in stronger than expected. According to Forex Factory, annual inflation reached 3.5%, compared with analysts’ forecasts of 3.1%. This marks the highest reading since July 2024, pointing to renewed inflationary pressure.
→ As a result, traders have significantly reduced bets on further monetary easing. Data from Trading Economics shows that the probability of the Reserve Bank of Australia keeping its interest rate unchanged at 3.6% at its 4 November meeting is now close to 90%.
Technical Analysis of the AUD/USD Chart
Since mid-September, movements in the AUD/USD pair have formed a descending channel (shown in red), built on a series of lower highs and lows starting from point A.
However, note that in mid-October:
→ the price dipped below the lower boundary;
→ the RSI indicator entered oversold territory;
→ candles displayed large bodies;
→ an inverted head and shoulders reversal pattern emerged.
From a Smart Money Concept perspective, it is reasonable to assume that within the area marked by the purple rectangle, Smart Money was accumulating sellers’ liquidity to build long positions.
Following this, the Australian dollar showed strong momentum as the price broke through:
→ resistance at 0.6520 near the channel’s median (forming a bullish gap in the process);
→ the upper boundary of the red channel around 0.6565.
Building on this view → the price now appears to be moving towards a liquidity zone, where Smart Money could find sufficient buy-side liquidity. This area may lie above the 0.6630 level, which previously acted as resistance in early October.
It is also possible that today’s Federal Reserve decision (the Federal Funds Rate announcement scheduled for 21:00 GMT+3) will help this scenario play out.
This article represents the opinion of the Companies operating under the FXOpen brand only. It is not to be construed as an offer, solicitation, or recommendation with respect to products and services provided by the Companies operating under the FXOpen brand, nor is it to be considered financial advice.

Hot CPI Kills Hopes of an RBA CutAustralia's Q3 inflation figures have just dropped, and all surprised to the upside. Not only does this kill hopes of a cut next week — and likely for the rest of the year — but it also suggests the RBA may have already reached the terminal rate of this cutting cycle. I take a quick look at the figures, AUD/USD, and the ASX 200.
Matt Simpson, Market Analyst at City Index and Forex.com.

AUDUSD - Scalping longAUDUSD - Scalping long
a quickly signal for scalping long.
In this moment we have a H&S Long pattern ready for a long

Emerging Markets vs. Developed MarketsIntroduction
Global financial markets can broadly be divided into two categories — developed markets and emerging markets. This classification plays a vital role in understanding investment strategies, economic potential, and risk-return dynamics. Developed markets, often referred to as advanced economies, are characterized by stability, technological innovation, and mature financial systems. In contrast, emerging markets represent nations that are transitioning toward industrialization and modernization but still face structural, political, and economic challenges.
The distinction between emerging and developed markets is not merely geographical; it reflects differences in income levels, governance quality, capital flows, infrastructure, and market maturity. Understanding these differences helps investors, policymakers, and corporations make strategic decisions in global trade, investment diversification, and growth planning.
Definition and Classification
Developed Markets
Developed markets are countries with high per capita income, robust industrialization, stable political systems, and mature financial infrastructure. These economies exhibit slow but steady economic growth and low volatility. The International Monetary Fund (IMF), the World Bank, and financial index providers like MSCI and FTSE classify countries such as the United States, United Kingdom, Japan, Germany, France, Canada, and Australia as developed markets.
Key characteristics include:
High GDP per capita (typically above $12,000).
Advanced infrastructure and technological capabilities.
Stable currency and monetary systems.
Transparent legal and regulatory frameworks.
Deep and liquid financial markets.
Emerging Markets
Emerging markets refer to countries undergoing rapid growth and industrialization, moving from a developing to a developed status. These markets display expanding economic activity, growing middle classes, and increasing integration into global trade systems. Examples include China, India, Brazil, South Africa, Indonesia, Mexico, and Turkey.
Emerging economies typically show:
Moderate to high GDP growth rates.
Rapid industrialization and urbanization.
Expanding capital markets but with higher volatility.
Political and institutional challenges.
Greater potential for long-term returns coupled with higher risk.
Organizations like MSCI Emerging Markets Index include over 25 nations that collectively represent a significant share of global GDP and trade.
Economic Growth and Development Patterns
The most striking difference between emerging and developed markets lies in their growth trajectories. Developed markets tend to have slow but stable growth, whereas emerging markets exhibit fast but volatile expansion.
Developed Markets: Economies like the U.S. or Japan grow at annual rates of around 1–3%. Their mature industrial bases and saturated markets limit further expansion, but the growth is sustained by innovation, services, and technology.
Emerging Markets: Countries such as India and China have historically grown between 5–8% per year, driven by manufacturing, exports, infrastructure, and consumption. The catch-up effect — where developing nations grow faster as they adopt technologies and practices from advanced economies — explains their higher growth rates.
However, this rapid expansion is often accompanied by inflationary pressures, income inequality, and dependency on external capital.
Infrastructure and Industrial Base
Infrastructure is a key determinant of market classification.
Developed Markets: They possess world-class infrastructure, including efficient transportation, advanced energy grids, and digital networks. Industries in these economies are diversified, with a focus on high-value sectors such as aerospace, biotechnology, artificial intelligence, and financial services.
Emerging Markets: Infrastructure development remains a top priority. Many nations are still expanding highways, energy networks, and digital access. Industrialization is often manufacturing-driven, with growth concentrated in textiles, automotive, and electronics sectors. The Make in India initiative or China’s Belt and Road Initiative are prime examples of infrastructure-led growth strategies in emerging economies.
Political and Regulatory Environment
The political and regulatory climate significantly influences investor confidence.
Developed Markets: Typically feature stable democracies, established rule of law, and predictable regulatory systems. This fosters investor trust and reduces systemic risk. Regulatory institutions such as the U.S. Securities and Exchange Commission (SEC) or the European Central Bank (ECB) ensure market integrity and transparency.
Emerging Markets: Political systems vary from stable democracies (India) to authoritarian regimes (China). Policy changes can be abrupt, and corruption or bureaucratic inefficiencies may persist. Currency controls, trade barriers, and sudden regulatory reforms create uncertainty, impacting investment sentiment.
Despite these challenges, emerging markets are progressively adopting governance reforms and digital transparency measures to attract foreign capital.
Financial Markets and Investment Opportunities
Developed Market Dynamics
Developed financial markets are highly liquid and efficient. They are characterized by:
Strong institutional participation (pension funds, mutual funds, hedge funds).
Sophisticated instruments like derivatives, ETFs, and structured products.
Stable interest rates and monetary policies.
Lower transaction costs and higher transparency.
For example, the New York Stock Exchange (NYSE) and London Stock Exchange (LSE) represent mature ecosystems with global influence.
Emerging Market Potential
Emerging financial markets, while less liquid, provide substantial growth potential. Factors such as urbanization, rising consumer demand, and technological leapfrogging create massive investment opportunities in sectors like infrastructure, energy, and digital finance. However, market volatility, limited liquidity, and political interference can heighten risks.
Instruments such as Emerging Market ETFs or sovereign bonds allow global investors to gain exposure while balancing risks. The BRICS economies (Brazil, Russia, India, China, South Africa) collectively represent more than 40% of the world’s population, making them central to global growth narratives.
Currency and Inflation Dynamics
Currency stability and inflation management are central to economic maturity.
Developed Markets: Maintain stable currencies (like USD, EUR, GBP, JPY) supported by independent central banks and deep foreign exchange reserves. Inflation rates typically range from 1–3%, ensuring purchasing power stability.
Emerging Markets: Frequently face volatile exchange rates due to capital flows, current account deficits, or political uncertainty. Inflation can rise rapidly due to supply chain disruptions or weak fiscal discipline. For instance, Argentina and Turkey have experienced persistent inflation crises, while India and Indonesia have improved monetary control through institutional strengthening.
Trade and Global Integration
Emerging markets increasingly drive global trade. They serve as both manufacturing hubs and consumer markets for multinational corporations.
Developed Markets: Have historically dominated global exports in high-tech goods, services, and intellectual property. They also invest heavily in emerging regions to tap into new markets.
Emerging Markets: Are now central to global supply chains. China, often referred to as the “world’s factory,” exports everything from electronics to automobiles. India’s service sector — particularly IT and outsourcing — contributes significantly to global digital trade. However, emerging markets remain vulnerable to trade wars, tariff policies, and commodity price fluctuations.
Demographics and Labor Markets
Demographics form a vital structural difference between emerging and developed markets.
Developed Economies: Often face aging populations, shrinking labor forces, and rising dependency ratios. Japan and much of Western Europe experience demographic challenges that constrain productivity and fiscal stability.
Emerging Economies: Benefit from youthful populations and expanding labor pools. India, for example, has a median age below 30, providing demographic dividends that fuel consumption and innovation. However, unemployment, underemployment, and skill mismatches pose challenges to maximizing this advantage.
Technological and Digital Transformation
Technology acts as a bridge between economic stages.
Developed Markets: Lead global innovation with dominant technology firms (Apple, Microsoft, Amazon). They invest heavily in research, AI, and digital infrastructure.
Emerging Markets: Rapidly adopt new technologies, often leapfrogging traditional stages. The rise of fintech in Kenya (M-Pesa), e-commerce in India (Flipkart), and digital payments in China (Alipay, WeChat Pay) illustrate how innovation in emerging economies can reshape global business models.
Risk and Return Trade-Off
Investors differentiate markets based on the balance between risk and reward.
Developed Markets: Offer predictable but modest returns. Their stability and low-risk profiles make them suitable for conservative investors and institutional portfolios.
Emerging Markets: Present higher growth potential but come with greater volatility. Political instability, currency fluctuations, and weaker governance contribute to risk. Yet, investors seeking alpha — above-average returns — often find emerging markets attractive, particularly during global economic expansions.
Diversification strategies often combine both market types to balance safety and growth.
Impact of Globalization
Globalization has blurred the line between emerging and developed markets. Capital, technology, and labor now flow more freely across borders. Multinational corporations operate seamlessly in both categories, integrating global supply chains. However, globalization also exposes emerging markets to external shocks — such as the 2008 financial crisis or the 2020 pandemic — which can rapidly disrupt capital inflows and currency stability.
Developed markets, on the other hand, face increased competition from low-cost emerging producers, compelling them to innovate and shift toward service- and knowledge-based industries.
Sustainability and ESG Trends
Environmental, Social, and Governance (ESG) factors increasingly define global investment patterns.
Developed Markets: Lead in green finance and sustainability policies. They set global climate standards and promote decarbonization through regulatory frameworks.
Emerging Markets: Confront the dual challenge of sustaining growth while managing environmental impact. Nations like India and Brazil are investing in renewable energy, but limited capital and institutional capacity often hinder progress.
The integration of ESG principles is creating new partnerships between developed and emerging economies, driving sustainable global development.
Future Outlook
The future global economic landscape will likely feature greater convergence between emerging and developed markets. The digital revolution, demographic shifts, and policy reforms are enabling emerging economies to catch up rapidly. Meanwhile, developed markets continue to lead in innovation, capital formation, and governance models.
However, geopolitical tensions, climate challenges, and automation could reshape comparative advantages. The balance of global economic power is gradually tilting toward Asia — particularly China and India — signaling a multi-polar economic order.
Conclusion
The comparison between emerging and developed markets reveals a complex yet complementary global ecosystem. Developed markets offer stability, innovation, and mature institutions, while emerging markets provide dynamism, growth, and opportunity. Both are indispensable to global prosperity.
For investors and policymakers, the key lies in understanding their distinct risk-return profiles, structural differences, and evolving interdependencies. In an interconnected world, the lines between “emerging” and “developed” continue to blur — giving rise to a new era of global economic synergy and shared growth.
AUDUSD Eyes 0.6500 as Softer CPI and Weak Jobs Data Weigh on USDHey Traders,
In the coming week, we’re monitoring AUDUSD for a potential buying opportunity around the 0.65000 zone. The pair remains in a broader uptrend, with the current pullback shaping up as a healthy correction toward key structural support.
Structure:
Price continues to respect its ascending trendline, and the 0.65000 area aligns with a strong confluence of horizontal support and dynamic trend structure — a level that has previously attracted strong buying momentum.
Macro Outlook:
The latest U.S. inflation print came in softer at 3.0%, undershooting expectations, while labour market data continues to signal cooling conditions. Together, these developments reinforce a dovish shift in Fed sentiment, weighing on the U.S. Dollar Index (DXY).
At the same time, Gold continues to rally, underpinned by the weakening Dollar and rising safe-haven demand. Given the positive correlation between AUD and Gold, this macro backdrop strengthens the bullish case for AUDUSD in the coming sessions.
Next Move:
A sustained bid around 0.65000 could mark the start of another impulse leg higher — targeting a retest of recent highs if momentum confirms.
Trade safe,
Joe

AUD/USD Gap-Fill Support (0.6513) - High-Probability Long SetupAUD/USD created an opening gap with a strong heavy-volume zone behind it, a rare but powerful setup. I expect price to pull back, fill the gap, and react at the key support at 0.6513. If price returns there, I plan to go long, looking for a strong bounce from this institutional volume area.

AUDUSD inverted flag pattern in a down trend pattern shortAUDUSD showing the down trend pattern within this it has formed the flag pattern and price likely will go down . This is well aligned with NZDUSD analysis which also showed the bearish flag further supporting these highly co related pairs.