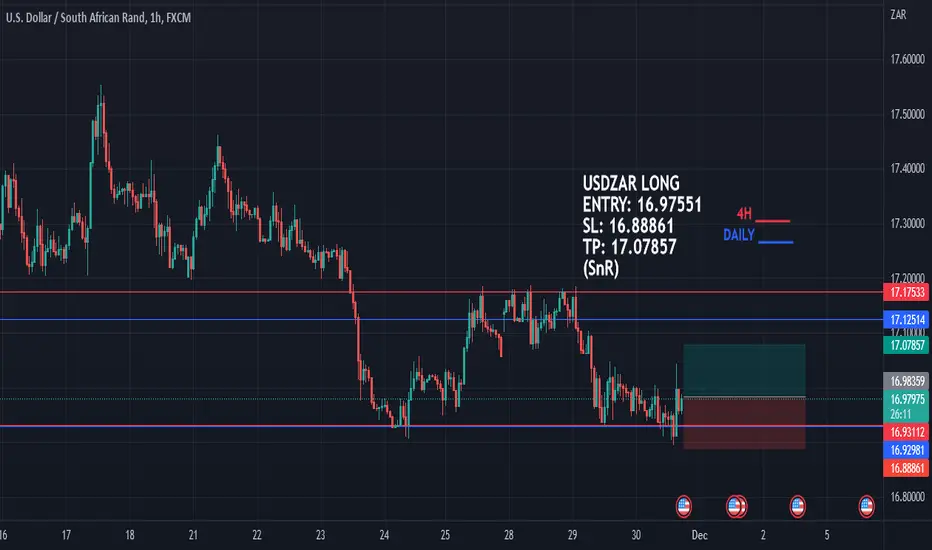
USDZAR LONG | ASSIGNMENT | WEEK 8USDZAR is going long because of the ongoing inside bar bullish candle and also the formation of a green candle at the 4H and Daily timeframe resistance.
USDZAR trade ideas
UZThis was an idea I had but because this is not on my watchlist I could have never ever taken it as it would have disturbed what I set out in my rules. I quickly learned how the UZ moves and the long candles that take place within it. So if I had adjusted the SL, this would have been a great trade.

USDZAR top-down analysisHello traders, this is a complete multiple timeframe analysis of this pair. We see could find significant trading opportunities as per analysis upon price action confirmation we may take this trade. Smash the like button if you find value in this analysis and drop a comment if you have any questions or let me know which pair to cover in my next analysis.

The rand is going up FINALLY! Target R15.92 - With confusion!Rounding Top (Scallop) has formed on the daily chart.
The price has broken below the neckline which signals bearish for USD
Also the moving averages are almost looking good.
21 > 7 >200 - Bearish
First target R15.92
The correlation between the Rand and the JSE stocks have somewhat reversed as of late. When stocks rise, the rand tends to strengthen and vice versa.
Now this makes sense in a way that a stronger rand means more buying power for consumers and more confidence in the economy.
However, we are a HIGH export country where we export in US dollars. As the heavy weightings of the JSE is with resources, we used to fall with a weakening US dollar.
Also, we tend to mirror the S&P500 and the DOw Jones as it's a leading indicator.
So the question we need to ask is... Is America signalling that we are in for massive downside again soon and this has just been a bull trap for us buyers.
OR is this the change in correlation where the JSE will continue up despite what happens in America and the US Dolla.
I Hope the latter.
Things aren't as they always seem.

USDZARRecently got very goood profit from usdzar in shorter tfs
now its breaks ascending channel in daily tf
expecting another 6 to 7% BEARISH MOVE IN COMING DAYS


$USDZAR Bear flag breakBear flag break
Moving back to test the neckline of the first breakout around R16,30ish.
Target R16,28

usdzar possible for longsdxy hinting to a bullish market .......sliighty hinting on a productive year ahead

USDZAR 23rd NOVEMBER 2022Investors tend to be side-lined ahead of the minutes of the US central bank's (The Fed) FOMC meeting and the thanksgiving holiday. The weakening of the dollar was supported by the return of risk on sentiment.
USDZAR breakout daily support from bullish channel pattern. A bearish trend has the potential to occur in the next few days.

NO.27It has completed its ab=cd pattern and I am expecting a bullish trend from here on that is why I have opened a long position.

USDZAR | Breakout Confirmed—Here We Go!Breakout occurred on USDZAR which is likely to send the pair nosediving!
The pair has over 90% positive correlation with USDCAD which is also headed down.
Trade well and take care.


USD/ZAR Wave 5 Sell-OffUSDZAR has been trading bullish in the long-term or higher timeframe, we are currently trading in a corrective phase as a 1-2-3-4-5 where wave 1-2-3-4 has already occurred and we are waiting for wave 5 completion. Wave 4 is a possible triangle pattern, keep in mind that waves 1 and 4 can not overlap so we can use that idea to use as stop loss or invalidation level. After wave 5 completion, we can expect a short-term corrective pattern in the upside direction before the last drop as a (c) wave.

USDZARDue to the rand Being up and making thing hard for SA i am focasting that it should drop to the R14.90 mark its been long since it touched that pace...
Idea Not A signal
Learning But Earning
Evolve or Remain

USDZAR 2023 FORCASTlooking at USDZAR on a daily timeframe we noticed that the bullish market structure has been broken, where the market was creating higher high within the trend channel the market just broken out of the trend channel and retested the support of the trend channel

USDZAR SHORT | ASSIGNMENT | WEEK 7USDZAR going short because its following the dow theory and also the TP is just at the very strong resistance.

What i see coming...what i see coming for this coming week.
Is buys.
till the resistance.
this because you can see that the market is or has formed the new high low and is getting ready to break above the current resistance. and if it breaks above it. i will have a clear confirmation to be look for buys.
what could invalidate this set up?
is that the market can retest on the current resistance and move further down and continue with the bearish trend to the downside
lets use proper risk management and lets do the most

USDZAR WeeklyThe best time to analyze the market is when its closed. After a analyzing the weekly chart of USDZAR, I think this market could continue its overall trend to the upside. The market is currently under the 14MA, meaning this market is selling.
Lets compare last week engulfed sell candle compared to this week. WHERE IS THE SELLING MOMENTUM? It does not make any sense for this market to have amazing selling power last week and this week it died down. Consistency is key and this market is NOT consistent in the selling momentum.
Looking at this market, I am expecting USDZAR to continue to travel towards the upside and I am expecting this market to break the highest high 19.06 continuing to go higher.
We will see :)

USDZAR break down Following the break of the present consolidation, USDZAR should make a massive movement to the down side ,hitting 15.672 because it the 0.5 fib level of the highest high

USDZAR PENNANTKey characteristics of a Pennant pattern
When looking at a Pennant continuation pattern, you will see the following:
A flagpole: A Pennant pattern always begins with a flagpole, which differentiates it from other types of patterns (such as the symmetrical triangle). The flagpole is the initial strong move preceding the symmetrical triangle.
Breakout levels: There will be two breakouts, one at the end of the flagpole, and one after the consolidation period, where the upward or downward trend continues
The Pennant itself: The Pennant is the triangular pattern formed when the market consolidates, between the flagpole and the breakout. The two converging trendlines form the triangle - the Pennant.
These characteristics can be seen with respect to the Bullish Pennant Pattern

#USDZAR Weekly chart - exhaustion - time for some rand strength?#USDZAR lots of indecision from the bulls & bears but the fact that we have had 3 lower highs and 3 lower lows on price in the last 3 weeks (weekly candles) suggests that the ZAR bears (USD bulls) are exhausted. I am expecting some rand strength in the next couple of weeks.
First target 20dma at 17.17, but rising daily so 17.30 would be an approximate level to watch for.

USDZARmoved as we predicted
running in verey good profit now
price action is best way to analz markets till today
