USD/ZARWe are currently looking for more push to the downside.
Feel free to chart me up let's discuss some trading ideas.
Your mentor signing out
USDZAR trade ideas

USDZAR SHORT | ASSIGNMENT | WEEK 10USDZAR expected to go short because more indications are towards bears as compared to those of bulls.


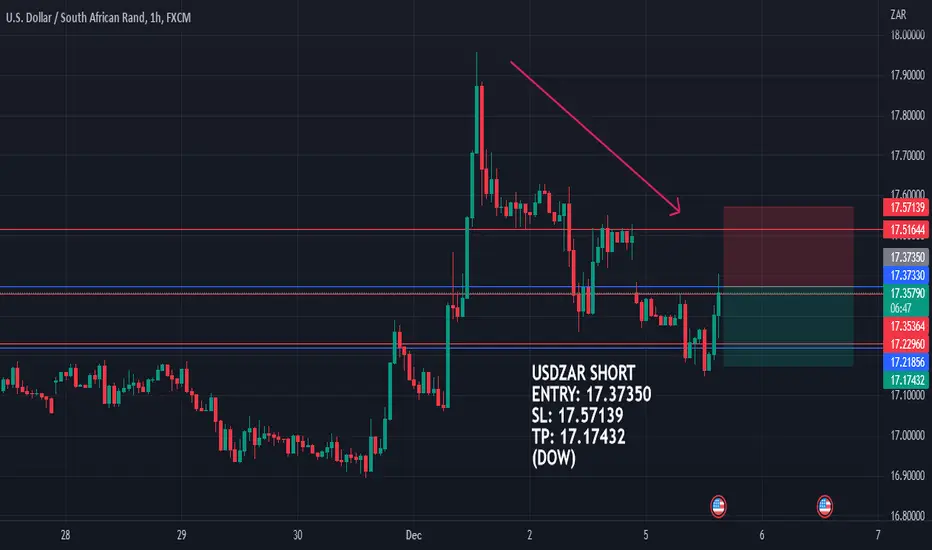
USDZAR SHORTPrice is at the support zone , and want to see price act on it and go bullish to the previous support that turn resistance @17.3800, or get higher to the 17.5200 zone then price might reject at that zone and sell to 17.05800 zone, but the zone I expect price to likely reject is the 17.3800 zone.

Long USDZARBought some USDZAR here at 17.25. Looking for a move to 17.75. Stop loss at 17.05.
General thoughts are that the Fed's job got a lot harder with the huge rally in risk post the soft CPI data yesterday. I would not be surprised if JP adopts a hawkish tone today. That opens the door for some USD strength. Tech setup also decent with USDZAR in a clearly defined uptrend. Simple to set your levels. Let's see how we go... good luck!

USDZAR LONGPrice broke the support zone on 23RD of November and used same zone as a resistant zone which ended up forming a double bottom, and price went on to break the zone and formed the December highs which came back and gave a false breakout. My expectation for this pair is to test the support zone which will boost it's momentum to the highs of December, price analysis will be updated during the week.

USDZAR Bearish SetupUSDZAR will possibly pulse up for a bearish pullback down to 16.87 with two price targets on the inverse of the fib.

USDZAR TRADE IDEA (12/12/22) : MON/WEEKUSDZAR has been selling for most of last week, closing out with a buy action. Once it hits market structure it’ll look to buy to supply.
This is just an idea.

uszarmonthly bullish
weekly bullish'
daily still bullish grabbed external liquidity
4h bullish what more do i need

ZAR DECEMBER 2022 IPDA DATA RANGEDXY seasonality: Bearish
ZAR seasonality: Bullish
Fed: 4.00%
SARB: 7.00%
DXY COT model: Net short but hedging
ZAR COT model: Net long
London Killzone = PO3
New York Killzone = 2022 ICT Model
s/o ict and forensicfx


Rand looking positive heading into year-end.The USD/ZAR pair seems to be in an ABC corrective wave pattern after completing a 5-wave impulse that commenced in April this year. Following last week's presidency scare, the rand has been able to pull the pair back below the 23.6% Fibo retracement rate of 17.50. Positively for the rand, it managed to keep the pair below the 50-day MA resistance rate of 17.74 and the neckline of the upward blue channel. The major support rates that need to give way for further rand strength as we head into year-end sits on the 38.2% Fibo rate of 16.87 and the major support of 16.80, the 61.8% Fibo retracement from the rand post covid bull run. As long as 16.80 holds the possibility of seeing 19.34 still remains. I'm however expecting a re-test of the support range between 16.80 and 16.86 and a break below this range will allow the rand to pull the pair onto the 200-day MA of 16.50.
In terms of technical indicators, the RSI is showing bearish divergence, which is rand positive. Conversely, there is currently a buy signal on the MACD following last week's presidency scare.
Apart from increased loadshedding and electricity uncertainty the fundamentals for the rand are looking relatively positive. SA GDP increased 1.6% q-o-q in 3Q2022, putting the economy back above pre-pandemic levels. Agriculture grew 19.2% in this period which will boost exports going into year-end which is rand positve.
SA 10-year government bonds currently yield 9.105%, so the carry trade is still strong as US 10-year treasuries currently sit at 3.540%, down from the highs of 4.25% in October.
In terms of commodities (the rand behaves as a commodity currency) I mainly look at platinum. Platinum is currently trading around $990 per ounce, up 19.57% from the lows we saw in August.

USDZAR ON A STRONG SUPPORT From a daily time frame usdzar went down to test a strong support and then went up breaking our resistance and that's a signal to show bulls are getting stronger, down to the 4h/1h we've had a pull back testing a minor support, so from there we expect mor buying opportunities. If you think I'm wrong comment and maybe let's see your analysis

USDZAR SHORT | ASSIGNMENT | WEEK 9USDZAR going short because of the dow theory and also strong daily resistance just below the previous LH can push the price down.
USDZAR2nd entry has been activated, USD has been very weak to due Seasonality and FED comments. hope to see a bounce here

USDZAR Monthly analysis - Rand to strengthen to the USD The Rand seems to have a double top formation on the price action, which suggests that the ZAR is to strengthen to the USD in the coming months/years
The MCB also printed a lower high, which suggests momentum to the downside

South African Rand in no mans land but can strengthen soonIt's been an interesting development with the USDZAR.
Since it broke out of April's uptrend, the price is now retesting the resistance (which was support).
I suspect that the price will be oscillating between the range of 17.63 and 16.91 in a box formation for a few weeks.
Only if the price breaks above or below, will we get some sign of where the rand is going.
For instance, if it breaks below, it would have formed an Inverse Cup and Handle showing major downside for the USD to come (which we can hope for).
If the price breaks out, the fakeout will spook the bears and the price will run up to ATH...
I'm bearish overall, but only time will tell.

HullBuster |USDZAR bouncing off supportGann Technical Analysis: USDZAR 4 hour chart
Overall, we’re bouncing off the 12 April low with the price action firmly contained above the rising 1:1 line. The recent pullback from the 22 October peak could not penetrate the descending 1:4 line and is now enjoying a powerful rally. According to Gann principles we could see the price continue to climb until the negative 2:1 line. Then look for a bounce off the negative 3:1 line. A break above the 8:1 line would put the USDZAR in blue sky territory while a fall below the rising 1:1 line would indicate major dollar weakness. The Gann Timing Box offers a text book stop level at the 38% line. Happy Trading! And Happy Holidays!
Methodology:
I use external Gann software to calculate the angles. The software uses a fixed grid calibrated per instrument. I use the TradingView Gann Fan to illustrate the analysis. It is not used in the calculation so the angles do not match your viewport orientation. Please see my angle gauge for a 360 degree representation of the calculation result using the current instrument price as of this date. The peak angle is represented using negative coordinates so as to preserve the Gann parlance and event recognition. It is not part of the formal indicator.
William Delbert Gann (1878-1955):
Commodities trader who developed a technical analysis method using geometric angles to forecast price movement. The core of his work relies on pivot points and lines drawn at fixed rates of speed. He is also the author of numerous finance books and trading courses. Although he developed several time and price indicators, this analysis uses only two: the Gann Fan and Gann Square.
USDZAR:
The South African Rand is a commodity currency established in 1961. It has been steadily weakening against the U.S. Dollar since 2012 due to mining industry decline and significant trade deficit. It is prone to lengthy periods of volatility against the major currencies. It’s currently trading at around 17 ZAR’s to the dollar. Looking at the weekly chart it’s easy to see where this currency is headed. Widespread unemployment, crime and political unrest is likely to keep pressure on this currency for the foreseeable future. However, trading this currency will require and iron will and either deep pockets or tight stops. The nominal swing range is around 3000 pips with relatively frequent bursts of 10000 pips or more.

USDZAR ForecastUSDZAR is potentially bullish to 17.2 and find resistance to fall in the 17.1 region for a bullish pullback up to 17.4.
The overall trend is bearish, but for now, I see a bullish pulse in the higher time frame.

fibonacci levels USDZAR.....Waiting for the pull back Hi Guys Good luck to you! Please consider to put a like to my idea for supporting me & subscribe for more ideas. Idea is not the financial advice!

USDZAROn the Daily chart we now have our first impulse that left behind a FVG, Tomorrow is NFP and the 14th of December its CPI. a good read on NFP could be the fuel this even more, a higher CPI read could really fuel this to the upside.
Rates in the US will go higher, a 0.50 % hike or 0.75% hike doesn't matter its going higher.

USDZARUSDZAR
Price is currently at a key institutional level @ R17.00
Price aligns with a weekly Bullish order block and also on the 61.85 retracement that put the price at a discount, Wont be surprized that we start seeing accumulation of longs here. To target R19.33

