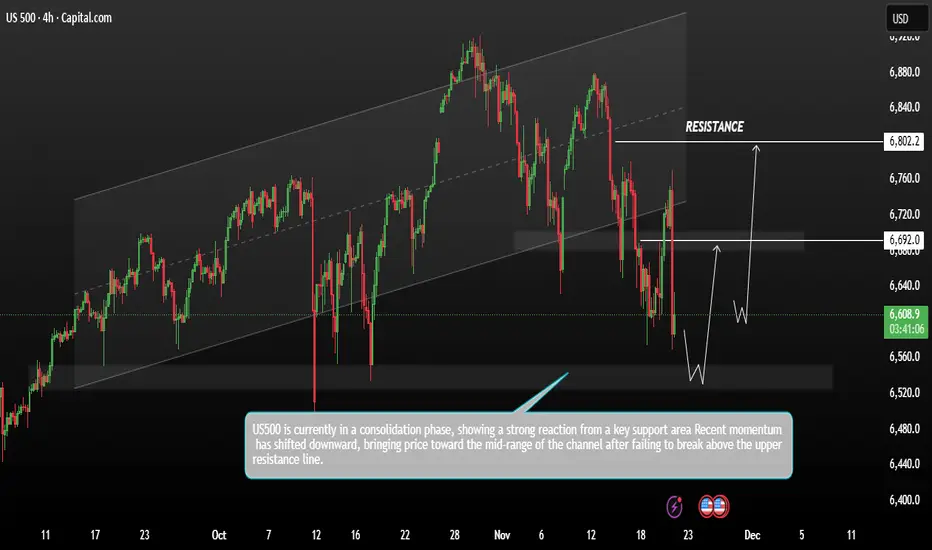
US500 Price Showing Bullish forming a reversal patternUS500 price action moving within a broad ascending channel, with multiple touches on both the upper and lower trend boundaries. Recent momentum has shifted downward, bringing price toward the mid-range of the channel after failing to break above the upper resistance line.
A key support zone sits around 6,550–6,500, highlighted by a shaded region where previous buyers stepped in. The projection on the chart suggests a potential dip into this support area, forming a reversal pattern before pushing higher.
If a bullish rebound occurs from this support, the next critical level is the mid-range supply zone around 6,690 / 6,720. A successful breakout above this zone could open the path toward the major resistance area near 6,802, which is clearly marked as the upper target.
You may find more details in the chart.
Trade wisely best of luck buddies,
Ps; Support with like and comments for better analysis Thanks for Supporting.
Market insights
monitoring SPX 6400 supportmonitoring SPX 6400 support
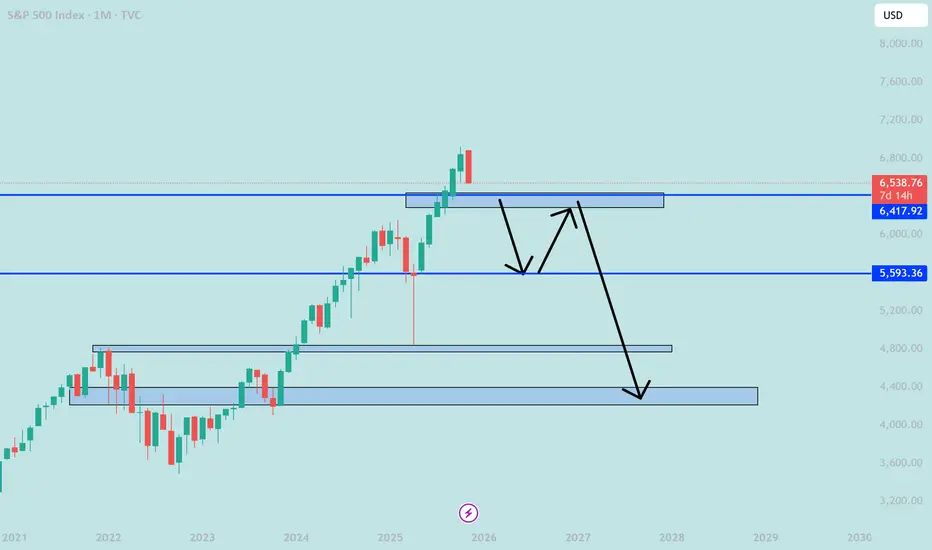
prepare for recession next year
6900 drop to 4400 drop by 36%
I believe I need a lower target later like 3870
S&P500 crashes! Due relief rally or further pain?Nvidia delivered impressive earnings, but the stock reversed and closed nearly 3% lower, triggering heavy selling across tech and risk assets as odds for a December rate cut have collapsed to just 34%, with policy uncertainty amplified by the cancelled October NFP report. Despite a strong market and rising unemployment in September's NFP report, traders remained defensive and fuelled the declines.
Key drivers:
Nvidia beat earnings, but post-report selling intensified sector losses.
The Fed’s odds for a December rate cut have dropped to 34%, amplifying caution.
The abrupt cancellation of the October NFP means the market lacks fresh labour data, fuelling defensive positioning.
S&P 500, Nasdaq, and Bitcoin broke major supports, confirming risk-off conditions.
Right now, the S&P 500 has broken below channel support near 6,600 and failed to climb back in. If prices stay below this threshold, expect another sharp move lower targeting 6,500 and possibly 6,350. There’s potential for upside, given momentum divergence on the RSI 4-hour chart. If we see a short-term bounce and a return to the channel, a move toward 6,682 is possible, which sets up a tactical short opportunity.
Trade idea:
Entry: Midpoint of 23.6/38.2 Fibonacci (6,655–6,682 area)
Stop-loss: Above 61.8% Fib (6,775)
Take Profits: TP1 6,500 (recent low/support), TP2 6,440 (major support), TP3 trail stop to 6,170 (long-term support)
Risk-off drivers are in control. Earnings reversals, Fed uncertainty, and cancelled NFP data are fuelling this price action. Technically, it comes down to whether we see a return inside the channel for a relief bounce or a sharp continuation downward.
Watch your levels, remain nimble, and let fundamentals and technicals, not emotions, guide your trade.
Let me know your setups in the comments, and follow for more high-action technical and macro trade ideas.
This content is not directed to residents of the EU or UK. Any opinions, news, research, analyses, prices or other information contained on this website is provided as general market commentary and does not constitute investment advice. ThinkMarkets will not accept liability for any loss or damage including, without limitation, to any loss of profit which may arise directly or indirectly from use of or reliance on such information.

US500 retreated on a hawkish Fed shift and a tech-sector fall
September nonfarm payrolls rose by 119k (cons. 51k), but August was sharply revised down to -4k from 22k, while continuing jobless claims increased by 28k from the prior week. The unemployment rate climbed to 4.4% (prev. 4.3%, cons. 4.3%), the highest in four years, further weighing on sentiment.
Fed commentary added to the pressure. Cleveland Fed President Mester noted that, despite signs of labor-market cooling, inflation remains elevated. Chicago Fed President Goolsbee also cautioned that inflation has not yet reached the 2% target, signalling reluctance toward additional rate cuts.
Today’s PMI and consumer expectations data will be key indicators of current US economic conditions.
US500 broke below the lower boundary of the ascending channel, extending its sharp decline. The diverging bearish EMAs indicate a potential continuation of the downtrend.
If US500 breaks below 6500, the index could retreat toward the next support at 6430.
Conversely, if US500 closes above 6650, where EMA21 intersects, the index may advance toward the following resistance at 6700.

Hellena | SPX500 (4H): LONG to resistance area of 6775.Dear colleagues, according to the last forecast the price is at the support level, but as it turned out, the correction in wave “4” is a bit more complicated than I thought.
Wave “4” consists of three waves “ABC” and should be over soon. The upward movement is still in priority, but I will target the not so distant resistance area of 6775.
Once it is reached, we will think about how to reach higher levels.
Manage your capital correctly and competently! Only enter trades based on reliable patterns!

$SPX. What was confusing about this?? Literally no one that reads TA should have not seen this. MacD Crossing the centerline on the DAILY is classic

Commodity Supercycle Trends1. Understanding the Concept of Supercycles
Commodities traditionally move in cycles based on supply–demand fluctuations, but a supercycle is different in scale and duration. Price trends in supercycles tend to:
Last for 10–20 years
See sustained upward trajectories
Be driven by massive structural demand
Cause large-scale capital investments and supply expansions
Supercycles usually involve multiple commodities rising together, including crude oil, copper, aluminum, iron ore, wheat, corn, and rare earth metals.
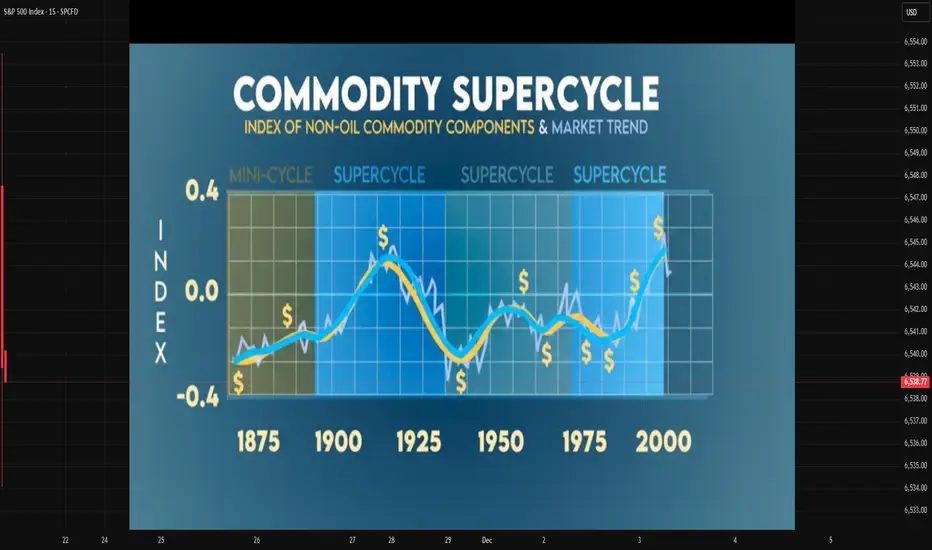
2. Historical Commodity Supercycles
Economists identify four major commodity supercycles in the past 150 years:
a. Late 19th-Century Industrialization Supercycle (1890s–1910s)
This era coincided with the rapid industrial expansion in the US and Europe. Demand surged for coal, metals, and agricultural output to support railway construction, electricity expansion, and manufacturing.
b. Post-WWII Reconstruction Supercycle (1945–1970)
After World War II, Europe and Japan undertook large-scale rebuilding. This sharply increased the demand for energy, steel, and industrial metals. The global population was also rising rapidly, driving agricultural commodity consumption.
c. China-Led Supercycle (2000–2014)
Perhaps the most notable modern supercycle, driven by:
China’s industrialization and urbanization
Massive infrastructure investment
Globalization and trade expansion
Strong energy demand, especially crude oil
Metals like copper, iron ore, and aluminum saw exponential price growth during this period.
d. The “Green Transition” and Renewables Supercycle? (2020s–ongoing)
There is debate over whether the post-2020 environment constitutes a new supercycle. Still, strong demand for battery metals, rare earth elements, lithium, nickel, copper, and silver—essential for clean energy technologies—suggests a potential long-duration upward trend.
3. Drivers Behind Commodity Supercycles
Supercycles are created by mega-trends rather than short-term economic fluctuations. Key drivers include:
a. Industrialization and Urbanization
Emerging economies (e.g., China in the 2000s, India in the 2020s) undergo phases where construction, manufacturing, and infrastructure grow at a rapid pace. This increases demand for:
Steel and iron ore
Cement
Base metals
Energy fuels
b. Technological Shifts
New technologies can reconfigure commodity demand:
Electric vehicles → lithium, nickel, cobalt
Solar energy → silver, polysilicon
Semiconductor demand → rare earths
Technological revolutions often create entirely new commodity markets.
c. Population Growth and Changing Consumption Patterns
Growing populations increase demand for:
Food grains (wheat, rice, corn)
Protein (soybean, livestock feed)
Energy (oil, natural gas)
Urban lifestyles also increase per-capita metal and energy consumption.
d. Underinvestment in Supply
Supercycles often begin after years of:
Low commodity prices
Reduced mining investment
Capacity shrinkage
Supply chain disruptions
When demand picks up suddenly, supply cannot catch up, causing prices to surge.
e. Monetary and Fiscal Stimulus
Loose monetary policy or money supply expansion can raise:
Inflation
Liquidity in markets
Investment in commodity funds
This increases speculative and real demand for commodities.
4. The 2020s: Are We in a New Commodity Supercycle?
Analysts worldwide debate whether the 2020s reflect the start of a new supercycle. Several powerful forces suggest this possibility:
a. Energy Transition and Green Technologies
The transition to a low-carbon global economy hugely increases demand for:
Copper (electric grids, EVs)
Lithium (EV batteries)
Nickel, cobalt (battery chemistry)
Silver (solar panels)
Rare earths (wind turbines, electronics)
Estimates show the energy transition may require 3–10 times more metals compared to the current baseline.
b. Supply Constraints
This decade faces:
Mine depletion
Scarcity of high-grade ores
Stringent environmental rules
Slow permitting processes
Geopolitical resource nationalism (Africa, Latin America)
Supply shortages amplify price pressures.
c. Geopolitical Shifts
Conflicts and tensions between major powers affect commodity flows:
US–China rivalry impacts rare earths
Middle East tensions influence oil
Russia’s sanctions affect natural gas and metals
Realignment of supply chains supports longer-term price elevation.
d. Climate Change Disruptions
Extreme weather affects:
Agricultural output
Mining operations
Shipping routes
More frequent droughts, floods, and storms disrupt supply and raise volatility.
5. Major Commodities Likely to Dominate the Coming Supercycle
1. Copper
Considered the “new oil” of the green economy, copper demand is expected to surge due to:
EVs requiring 2–4 times more copper
Renewable energy grids
Electrification of industries
2. Lithium
A core input for batteries, with demand expected to grow 10–15x by 2035.
3. Nickel and Cobalt
Key metals for high-density battery chemistries.
4. Crude Oil
Despite renewable energy growth, oil demand remains strong due to:
Aviation
Petrochemicals
Industrial use
Slow transition in developing countries
5. Natural Gas and LNG
Seen as a “bridge fuel” in the transition away from coal.
6. Agricultural Commodities
Food prices are rising due to climate volatility and rising global population.
7. Precious Metals (Gold, Silver)
Investors hedge against inflation, currency depreciation, and geopolitical uncertainty.
6. Investment and Trading Implications
a. Long-Term Opportunities
A supercycle supports multi-year rallies in:
Mining stocks
Metal ETFs
Energy companies
Commodity indices
b. Volatility Will Remain High
While long-term trend is upward, short-term fluctuations will be sharp due to:
Interest rate swings
Policy changes
Currency volatility
c. The Role of Emerging Markets
India, Indonesia, Vietnam, and parts of Africa are entering new phases of:
Industrialization
Infrastructure spending
Urbanization
This will add structural demand to the global commodity landscape.
d. ESG and Sustainability Constraints
Environmental regulations limit new mining capacity, pushing prices higher.
7. Conclusion
Commodity supercycles represent long-term, structural shifts in global economic dynamics. They arise when powerful forces—industrialization, population growth, technology transitions, geopolitics, and supply constraints—drive sustained commodity demand. The world today is experiencing pressures that resemble previous supercycle conditions, especially with the rise of green energy, supply chain restructuring, and climate-driven disruptions. Whether or not this evolves into a full-fledged supercycle, commodities like copper, lithium, nickel, crude oil, natural gas, and agricultural products are likely to experience elevated demand and significant price appreciation in the years ahead. Understanding these trends helps investors and policymakers strategize effectively in a resource-constrained and rapidly evolving global economy.
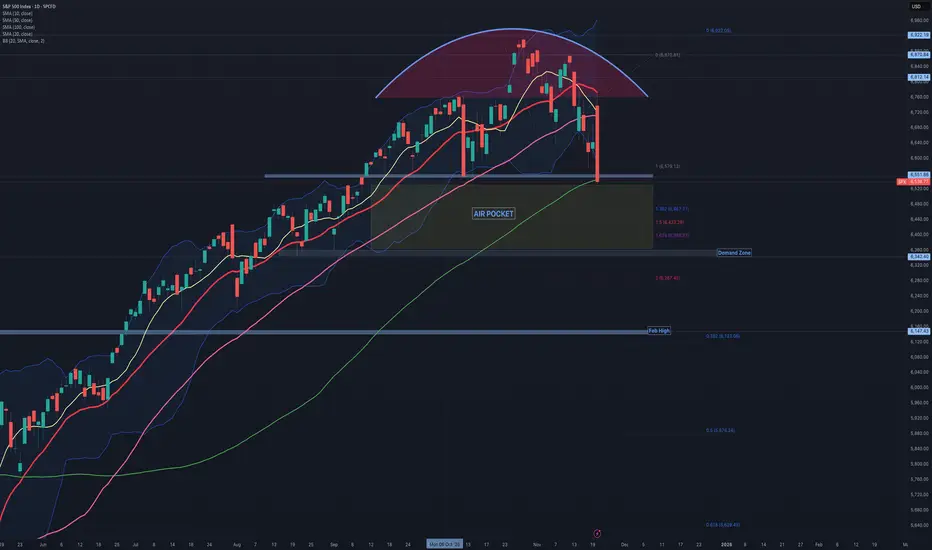
$SPX: A worrying Intraday Turnaround!While everyone, even the taxi driver, was celebrating NVDA's positive earnings report, the SP:SPX suddenly reversed. After touching the 20-day simple moving average, it dropped sharply with no buyers stepping in. With a 3.5% swing between the intraday high and low, the SP:SPX closed slightly below the horizontal support level at 6,550 and the 100-day moving average.
It's unfortunate that the right shoulder is missing, as it would otherwise form a perfect head and shoulders pattern—though it might be more accurately described as the head of a one-armed head and shoulders. Jokes aside, the technical outlook for the SP:SPX has significantly deteriorated. The market's bullish sentiment has evaporated, making it more challenging to establish a bottom.
If the S&P 500 doesn’t recover and consolidate support around 6,550 by Friday—an extremely important level that also aligns with the 1:1 extension below—we could face an “Air Pocket” of approximately 175 points. Within this Air Pocket area, we have extensions at 1.382, 1.5, and 1.618. The 14-period RSI is approaching oversold conditions, but it's not quite there yet.
SPX500 ShortHello traders,
I am expecting the SPX500 to see a potential 20% correction. Current sentiment appears mixed while valuations remain elevated, which increases downside risk. This view also aligns with the technical setup:
On the weekly timeframe, price is respecting a well-defined channel.
On the daily timeframe, a double-top pattern has just formed, suggesting possible trend exhaustion.
Not financial advice, just sharing my market perspective.

SPX Big Drop Today - H4 DowntrendSPX opened up big today and quickly erased all the gains. It created a lower high (LH) on 61.8 and rejected there for a nice short. Price broke support on H4 signaling weakness, so we pull out fibs to measure where the next possible LH could be. First TP is on the -27% red line, which also lines up with previous daily support. Lets see how price reacts in that area. Feel free to drop opinions!

Ray Dalio’s bubble warning aged fast today Ray Dalio’s warning not to “sell just because there’s a bubble” didn’t land today as a delayed September jobs report showing 119,000 new jobs cut into hopes of a December Fed rate cut.
The S&P 500 swung from a 1.9% gain to a 1.1% loss, and the Nasdaq flipped from up 2.6% to down 1.5%. The S&P 500 chart now shows declining momentum with lower highs forming. That kind of engulfing behaviour can mark exhaustion phases in extended rallies.
Bitcoin also unraveled, dropping nearly 5% and sinking back under 87,000 as liquidations accelerated. The current monthly candle could be confirming a potential shift in trend momentum after a multi-year climb.

SPX500 Will Go Down!
HI,Traders !
#SPX500 made a retest
Of the horizontal resistance
Level of 6678.85 from where
We are already seeing a
Bearish reaction so we are
Locally bearish biased and
We will be expecting a
Further local move down !
Comment and subscribe to help us grow !

SPX US🌎The first wave of the current impulse has ended, and we are now in the second.
The second wave's target has been met—the gap has been closed.
A breakout of 6870 will confirm that we are entering the third wave.
This marking fits well with the New Year's rally.
Also, the expectation of a Fed rate cut, as well as the end of the shutdown, will support the bullish momentum.

VIX may give the clueSPX popped from the NVDA earnings and may continue higher, but as long as we're below the 18 daily, the bias is down. The Vix is still above it's 18 ma and 20 support zone. Gold - choppy and in no man's land here. Oil - choppy. Nat Gas, maybe a nice short in this area. BTC could drop a little then rally higher.

SPX 500: Bullish Rebound to 6760?FX:SPX500 is priming for a bullish rebound on the 4-hour chart , where price has pulled back to a critical support zone following a sharp decline, forming a potential bounce setup amid a broader uptrend—highlighted by the rebound pattern near key levels that could ignite buying if buyers defend against further downside. This confluence at the support offers a high-reward long opportunity in the index's volatile range.
Entry zone between 6530-6550 for a buy position. Target at 6760 🎯near the resistance zone, delivering a risk-reward ratio greater than 1:4 .Set a stop loss on a close below 6500 📊 to manage risk effectively. Watch for confirmation via a strong bullish candle with rising volume above the entry, capitalizing on the index's resilience despite recent pressures🌟.
Fundamentally , the S&P 500 closed at around 6646.7 on November 19, 2025, down over 2% in November amid economic concerns and high valuations, particularly in AI stocks, with the index dipping below its 50-day moving average for the first time since April—yet historical patterns suggest a median 15% upside to 7710 over the next year if it follows median rebounds. Earnings growth remains robust at 16.9% YoY, beating estimates, supporting potential recovery despite tariff worries. 💡
📝 Trade Setup
🎯 Entry Zone (Buy): 6530 – 6550
🎯 Target:
• TP: 6760 (major resistance)
❌ Stop Loss: Close below 6500
⚖️ Risk-to-Reward: Greater than 1:4
What's your outlook on this rebound? Drop your thoughts below! 👇

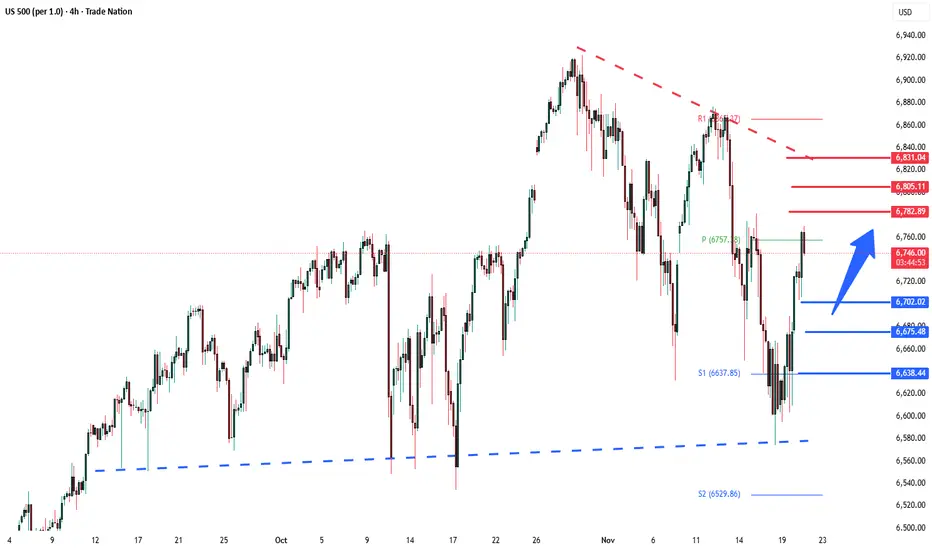
S&P500 Key Trading LevelsKey Support and Resistance Levels
Resistance Level 1: 6780
Resistance Level 2: 6805
Resistance Level 3: 6830
Support Level 1: 6700
Support Level 2: 6675
Support Level 3: 6638
This communication is for informational purposes only and should not be viewed as any form of recommendation as to a particular course of action or as investment advice. It is not intended as an offer or solicitation for the purchase or sale of any financial instrument or as an official confirmation of any transaction. Opinions, estimates and assumptions expressed herein are made as of the date of this communication and are subject to change without notice. This communication has been prepared based upon information, including market prices, data and other information, believed to be reliable; however, Trade Nation does not warrant its completeness or accuracy. All market prices and market data contained in or attached to this communication are indicative and subject to change without notice.
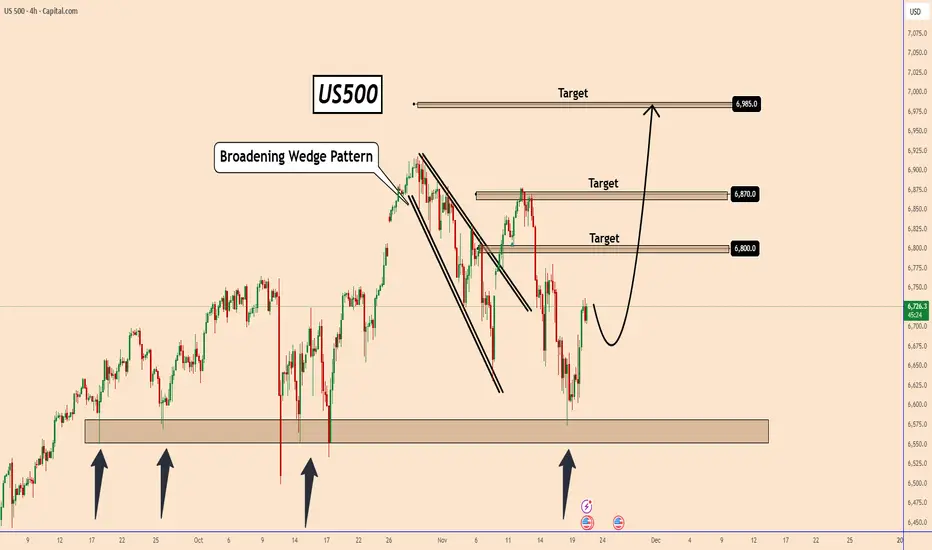
US500: Strong Reversal Zone Holding | Potential Rally AheadUS500 – Strong Reversal Zone Holding | Potential Rally Ahead
US500 has once again reacted strongly from the major support zone marked on the chart — an area that has held multiple times in the past.
Buyers stepped in aggressively, preventing further downside and maintaining the broader bullish structure.
After forming a broadening wedge pattern followed by a sharp decline, price has stabilized and is now showing early signs of a potential bullish reversal.
If momentum continues building, the next upside targets are:
6,800
6,870
6,985 (major target)
You may find more details in the chart!
Thank you and Good Luck!
❤️PS: Please support with a like or comment if you find this analysis useful for your trading day❤️
S&P 500 needs a correctionLooking at the volume, we see that the price is rising but the volume is declining in line with it. This indicates a high probability of a correction, in my view. Short the S&P 500 to 6146, where I expect at least an attempt to form a new bottom. Let the bears do their thing; an update will follow.
⚠️ Not financial advice.

SPX500 – Key Breakout Levels Ahead of NFP | Bearish Below 6734SPX500 | OVERVIEW
Stocks soar on Nvidia earnings relief as the company delivered forecasted quarterly revenue well above Wall Street expectations, easing recent concerns over AI-sector valuations that had contributed to a market pullback.
Markets now shift focus to the U.S. Non-Farm Payrolls (NFP) report, which is expected to generate strong volatility across indices.
Technically:
Stocks rally after Nvidia’s strong earnings forecast, easing some AI-valuation concerns. Markets now await the NFP report, which could fuel major intraday volatility.
Below 6734: Bearish continuation toward 6670 → 6635 → 6610
Above 6754: Bullish breakout toward 6800 → 6844
Pivot: 6734
Support: 6670 · 6635 · 6610
Resistance: 6769 · 6800 · 6844
SPX500 stays bearish under 6734, and only a strong candle close above 6754 will confirm bullish momentum.


S&P 500 dip-buying setup?Keep an eye on this technical setup; I watch it closely, and it has proven to have a good track record. As you can see from the charts below, the VIX has closed north of the upper Bollinger Band (set to 2 standard deviations), and the daily price of the S&P 500 recently formed an AB=CD pullback to 6,594. This technical confluence often delivers a dip-buying opportunity.
Written by FP Markets Chief Market Analyst Aaron Hill

De-Globalization and Globalization: Role in the Trade Market1. What Is Globalization?
Globalization refers to the increasing interconnectedness of countries through trade, capital flows, technology, labor mobility, and communication networks. It removes barriers between nations by promoting:
Free trade agreements
Cross-border investments
Multinational corporations expanding globally
Technology transfer and innovation diffusion
Movement of goods, services, and people
Key Drivers of Globalization
Trade Liberalization: Reduction of tariffs and quotas by organizations like WTO.
Advances in Technology: Internet, logistics, digital payments, AI.
Global Supply Chains: Production spread across multiple countries.
Capital Mobility: Foreign direct investment (FDI), foreign portfolio investment (FPI).
Transportation Efficiency: Low-cost shipping, aviation growth.
Benefits of Globalization
Lower cost of goods and services.
Higher economic growth for emerging markets.
Access to global markets for domestic producers.
Innovation through global competition.
Greater consumer choices.
Challenges of Globalization
Job losses in industries exposed to global competition.
Income inequality within countries.
Over-dependence on global supply chains.
Faster transmission of economic crises.
Despite these challenges, globalization dominated world trade through the 1990s and early 2000s, shaping a highly interconnected economic landscape.
2. What Is De-Globalization?
De-globalization refers to the process of reducing global interdependence. It involves countries restricting trade, limiting foreign investments, reshoring manufacturing, and prioritizing domestic production over global integration.
The shift began with economic nationalism and strengthened due to several global events:
Key Causes of De-Globalization
Geopolitical Tensions:
US–China trade war, Russia-Ukraine conflict, Middle-East instability.
Supply-Chain Vulnerabilities:
COVID-19 exposed heavy reliance on foreign manufacturing.
Protectionism:
Rising tariffs, import bans, and industrial subsidies.
National Security Concerns:
Restrictions on semiconductor exports, defense technologies, and data.
Energy and Food Security Risks:
Nations prioritize domestic reserves to avoid shortages.
Characteristics of De-Globalization
Regionalization of trade (Asia-centric, EU-centric, US-centric blocs).
Friend-shoring and near-shoring instead of global sourcing.
Declining share of global trade in GDP.
Stricter FDI regulations.
Rise of self-reliance policies—e.g., India’s Atmanirbhar Bharat.
Impact of De-Globalization
Higher manufacturing costs.
Slower global GDP growth.
Volatile commodity and currency markets.
Strategic competition between major economies.
De-globalization does not mean an end to global trade—it indicates a restructuring toward secure and region-based trade networks.
3. Role of Globalization in the Trade Market
Globalization has been the backbone of the modern trade market for 30+ years. Its influence can be identified in multiple areas:
(a) Expansion of International Trade
Countries specialized based on comparative advantage:
China in manufacturing
India in IT services
Middle East in oil
USA in technology and finance
This specialization increased global efficiency and lowered production costs.
(b) Growth of Multinational Corporations (MNCs)
Companies like Apple, Toyota, Samsung, and Unilever built supply chains across continents, boosting cross-border trade and investments.
(c) Deep Supply Chains
Products became globally integrated.
Example: A smartphone may involve design in the US, chips from Taiwan, assembly in China, and software from India.
Such supply-chain integration increased trade volume significantly.
(d) Increased Capital Flows
Globalization enabled investors to diversify by investing in foreign stocks, bonds, and real estate. It boosted foreign direct investment (FDI) and global liquidity.
(e) Boost to Emerging Markets
Countries like India, China, Vietnam, and Indonesia benefitted from export-led growth, attracting foreign companies and creating millions of jobs.
(f) Lower Prices & Higher Consumer Choice
Global competition reduced product costs, giving consumers access to global brands at affordable prices.
4. Role of De-Globalization in the Trade Market
De-globalization has introduced new dynamics that reshape how global trade functions.
(a) Rise of Protectionism
Countries impose tariffs to protect local industries.
Examples:
US tariffs on Chinese steel and electronics
India’s import restrictions on certain electronics to promote local manufacturing
This reduces global trade flows and pushes countries toward self-reliance.
(b) Reshoring Manufacturing
Companies move factories closer to home markets to avoid supply disruptions.
This impacts trade routes and reduces dependency on distant suppliers.
(c) Regional Trade Blocs
ASEAN, EU, USMCA, and African Continental Free Trade Area (AfCFTA) are forming tighter regional trading networks.
Trade becomes more regionalized rather than global.
(d) Geopolitical Trade Wars
Strategic competition, especially US–China, impacts:
Semiconductor exports
Technology transfer
Patents and IP laws
Digital trade regulations
Such restrictions create uncertainty in global trade.
(e) Commodity & Energy Security
Nations stockpile oil, gas, and minerals to ensure autonomy.
This leads to price volatility and new trade corridors like India importing discounted oil from Russia.
5. Combined Impact on Global Trade Markets
The world is entering a hybrid phase—neither fully globalized nor fully de-globalized.
Key Trends Shaping the Future
Shift from globalization to regionalization but not complete isolation.
Digital globalization continues through data, software, AI, and digital payments.
Supply-chain diversification reduces over-reliance on any single country.
Strategic industries (chips, defense, energy) remain highly protected.
Developing countries like India, Vietnam, and Mexico gain new manufacturing opportunities.
Winners in This Transition
Countries offering supply-chain stability
Nations with strong digital and technology ecosystems
Economies able to balance both global and domestic trade strategies
Losers
Countries dependent on single-market exports
Economies heavily reliant on cheap manufacturing
Nations vulnerable to geopolitical conflicts
Conclusion
Globalization and de-globalization are not absolute states but two ends of a spectrum continually shaping the world economy. Globalization promoted trade expansion, innovation, economic growth, and international cooperation. De-globalization emerged as a corrective phase to address vulnerabilities exposed by global tensions, supply-chain crises, pandemics, and national security threats.
The modern trade market is now characterized by a blend of globalization’s connectivity and de-globalization’s strategic caution. Countries are trading more selectively, focusing on trusted partners, secure supply chains, and balanced economic policies. Going ahead, the world is likely to embrace “smart globalization,” where nations seek benefits of global trade while protecting their strategic interests.
S&P 500 to print final move to 6500It goes without saying, this bull market has been the most hated I’ve ever known. Retail traders attempts to go “short” on every leg up resulted in quick squeezes. Every 1% to 4% correction brought renewed calls for the end of all things. Including time I believe. There is a reason why 90% of market participants fail in trading. Emotions.
The last four long ideas published by Without Worries are linked below. Read the comments in each to get an impression of the distain retail traders have for this bull market. The Cup and Handle idea for example, published on November 9th 2023. Many reading the idea were understandably skeptic. I tell you that to tell you this... The idea was much more than a chart pattern. The idea included studies from Dollar index and more importantly market sentiment.
So lets focus on those two in a little more detail.
** Market sentiment **
The market sentiment in November last was incredibly bearish. The Put/Call ratio was sky rocketing, in other words retail traders were all “short” on the market. That was a mistake. Guess what? They're doing it again.
Weekly Put/Call ratio
If you follow my practices you’ll know one of our golden rules, we never never long into active resistance. Just don’t. Don’t even think about it.
On the above weekly Put/Call chart we can see retail traders are betting heavily with both feet for a market correction as the Put/Call ratio shows a strong demand for “Short” contracts. We can see RSI is actively rallying into resistance. Oh dear…
** The dollar index **
The dollar has entered a bull market. Or so it appears. On the 2-day chart below price action has printed a Life Cross with the index trading above the 2-day/200 sma.
However on closer inspection just as in late 2022 and indeed late 2023, both price action and RSI support have failed. This will be a short lived bull market, for now.
Support and resistance is the ultimate cheat code. It has been integral to the previous ideas shared. It amazes how many continue to dismiss the importance of practicing this simple concept. Look left.
2-day DXY
** The conclusion **
On the above monthly chart several technical developments have occurred. Together with market sentiment and dollar index structure, the combination provides a powerful message.
The red arrows highlight each significant market top over the last 10 years when sentiment was incredibly bullish. The blue arrows record sentiment at extreme bearish levels.
Here’s the interesting part, when sentiment was this bearish price action was already at the lower half of the rising channel. There is not an instance when a rise from lower to higher half of the channel with confirmation of support (we’ve confirmed) did not result in a resistance test at the top of the channel.
The resistance is now between 6500 and 6700.
Is it possible the market collapses like many retail traders are now calling for? Sure.
Is it probable? No.
Ww
** previous S&P 500 ideas **
S&P 500 - Cup and Handle
S&P 500 - Why everyone is wrong
S&P 500 - Why everyone is wrong - Part II
S&P 500 to 6000
