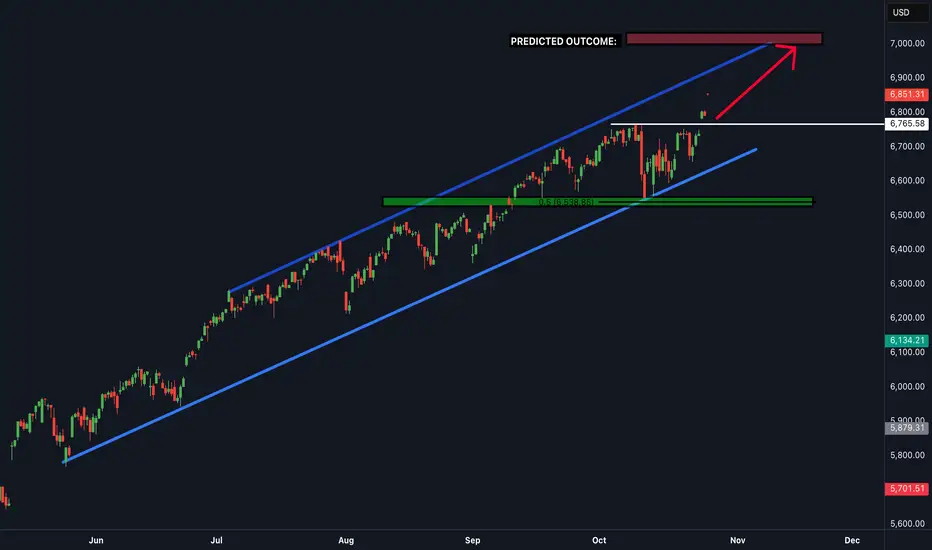
SPX500 Bullish Breakout!
HI,Traders !
#SPX500 is going up now
And the price broke the
Key horizontal level
Around 6695.82 and
The breakout is confimred
So we are bullish biased
And we will be expecting
A further bullish move up !
Comment and subscribe to help us grow !
Trade ideas

High CPI, Higher Markets: America’s Paradox of ConfidenceBy Giorgalexis
The CPI is high, inflation refuses to die — yet Wall Street keeps climbing.
Indices sit at all-time highs, the Fed is signaling possible rate cuts, and investors keep chanting the same mantra:
“We’re Americans. We can handle everything.”
Soft landing? ✅
Unemployment at 4.3%? “Totally fine.”
AI-driven construction and growth? “The new frontier.”
The narrative feels bulletproof — or at least that’s what we want to believe.
The Illusion of Strength
In global negotiations, a falling market equals weakness.
No U.S. president wants to appear vulnerable, especially with geopolitical rivals watching.
When the S&P 500 is breaking records, America looks unstoppable — confident, dominant, secure.
So everything must happen before the cracks start to show.
But illusions don’t last forever.
The Secret Recession
Beneath the headlines, the economy tells a different story.
Corporate margins are thinning, credit card delinquencies are creeping higher, and consumer sentiment is quietly deteriorating.
Liquidity is evaporating for small businesses, even as megacaps report “record profits.”
Everyone feels the slowdown — yet few are willing to admit it.
This is the Secret Recession: a quiet contraction hiding behind the noise of a bullish market.
The Gold Paradox
Even gold has joined the party — trading at all-time highs while stocks do the same.
That’s not normal.
Gold usually shines when fear dominates, not when markets are euphoric.
When both gold and equities rise together, it signals a market that’s swimming in liquidity but drowning in doubt.
Investors are hedging against something — maybe inflation that never really went away, maybe a Fed policy mistake, or maybe the silent recognition that global stability is more fragile than it looks.
Central banks keep buying gold, the dollar stays firm, and everyone pretends it’s business as usual.
But every ounce of gold at record highs is a vote of no-confidence — not in America’s power, but in its sustainability.
The Paradox of Confidence
The Fed faces a dangerous equation:
Cut rates too soon, and inflation re-ignites.
Hold them too high, and growth breaks.
Yet markets have priced in both — strong growth and imminent easing.
It’s a fantasy of eternal expansion.
AI will save productivity, rates will drop, earnings will rise, and geopolitics will magically calm down.
Until data proves otherwise.
Because once the market starts doubting the narrative, once data becomes stronger than politics, the illusion fades — fast.
How Long Can It Last?
For now, momentum is on America’s side.
Global capital still wants to flow into the U.S.
China and Russia may challenge the order, but Wall Street remains the global benchmark for optimism.
Still, confidence is not infinite.
Markets rise on belief — and collapse on doubt.
Gold already senses what equities refuse to see.
Final Thought
As traders, we live for momentum.
But even the strongest trend hides a reversal point.
When optimism turns into policy, and markets become diplomacy, it’s only a matter of time before reality reclaims the chart.

SPX for Thursday October 23rdSimilar pattern to Dax.There is now an uptrend.Running into resistance.Lets see what happens

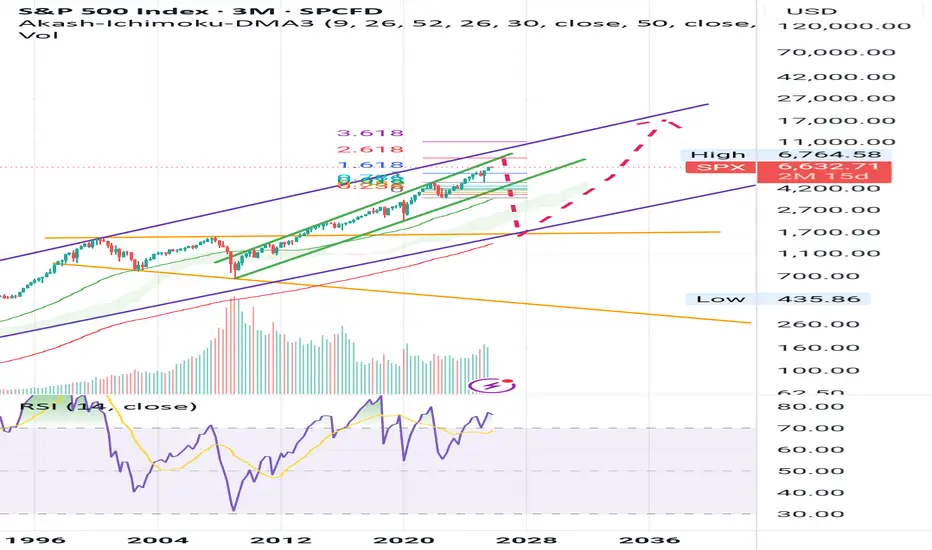
S&P 500 Bear Market in 2026The Stock market is going to send Crypto into a Bear market in 2026.
It just broke it's weekly cycle count and it's currently painting a bullish divergence. This means only one thing - we are going into a blow-off top within the next 2 months.
We are going to top above 7000 area, and in case we don't have a proper retracement into the Weekly Cycle low within November, we are going to make a blow-off top in December/January.
2026 Year will be profit taking year and the stock market is expected to retrace 20%, while Bitcoin will go down by more than 50%.
It's the last leg of the bull and it's time to get allocated in the market.

S&P500 expected to open on a cautious note- earnings in focusUS equities lost momentum yesterday, with the S&P 500 falling -0.53%, snapping a three-day winning streak as renewed US-China trade tensions, weak corporate earnings, and continued government shutdown worries weighed on sentiment.
Key Drivers:
Trade concerns dominated after reports that the Trump administration is considering export restrictions to China on products containing or developed with US software, in retaliation for China’s rare earth export limits. This escalation hit semiconductor and tech stocks, with the Philadelphia Semiconductor Index down -2.36%.
Later, more conciliatory comments from Trump—suggesting a deal with China was still possible—helped stem deeper losses but failed to lift markets meaningfully.
Oil prices were the exception, with Brent Crude rising above $64/bbl after the US imposed new sanctions on Russia’s largest oil producers, intensifying pressure on global energy markets.
Gold continued its slide, falling another -0.65%, following Wednesday’s sharp selloff.
Corporate News:
Tesla shares came under pressure after profits plunged despite record sales, as rising costs hit margins. CEO Elon Musk used the earnings call to defend his proposed $1 trillion pay package.
Broader earnings sentiment weakened amid several disappointing results, adding to the cautious tone.
Global Developments:
In Canada, Prime Minister Mark Carney announced a plan to diversify exports away from the US and attract skilled immigration, signaling shifting trade dynamics in North America.
Outlook for Today:
Markets are expected to open on a cautious note, with traders monitoring fresh earnings releases and US data for signs of resilience. The S&P 500’s near-term direction will likely hinge on whether confidence improves around trade and earnings, or if risk aversion continues to build into the weekend.
Key Support and Resistance Levels
Resistance Level 1: 6720
Resistance Level 2: 6755
Resistance Level 3: 6765
Support Level 1: 6645
Support Level 2: 6590
Support Level 3: 6560
This communication is for informational purposes only and should not be viewed as any form of recommendation as to a particular course of action or as investment advice. It is not intended as an offer or solicitation for the purchase or sale of any financial instrument or as an official confirmation of any transaction. Opinions, estimates and assumptions expressed herein are made as of the date of this communication and are subject to change without notice. This communication has been prepared based upon information, including market prices, data and other information, believed to be reliable; however, Trade Nation does not warrant its completeness or accuracy. All market prices and market data contained in or attached to this communication are indicative and subject to change without notice.

SPX500 On the way to the upside! BUY NOWSPX500 is in a clear upwards channel and has broken the last bit of resistance (white line shown) - this is a clear confirmation that the next target will be the next resistance zone to the upside shown above (this is a great buy trade opportunity)
SPX | Daily Analysis #7 - 27 October 2025Hello and welcome back to DP Weekly Market Review,
Past Week Overview:
The past week saw a strong inflow of volume from investors optimistic about a market rebound, following the sharp two-week decline driven by renewed U.S.–China trade tensions. The S&P 500 initially showed a K-shaped reaction, but buyers quickly stepped in, pushing prices higher. By Friday, the market not only recovered but also broke above the previous high, setting a new record.
On Sunday, Treasury Secretary Bessent announced that the U.S. and China are ready to reach a trade agreement. This news fueled bullish sentiment in the Asian session, causing a major gap-up in the markets, with the index opening around the 6,850 zone.
Week Ahead:
This week stands as one of the most critical of the quarter for global markets.
Federal Reserve Decision: All eyes are on the Fed’s rate announcement—whether they hike, cut, or hold. Every word from Chair Powell regarding “soft landing,” “inflation progress,” or “economic resilience” could move global markets sharply.
Tech Earnings Season: The “Tech Titans” — Apple, Microsoft, Meta, Amazon, and Google — report their earnings this week. These giants collectively account for around 35% of the Nasdaq’s total weight.
U.S.–China Relations: President Trump is expected to meet President Xi for the first time in his second term, with trade tensions still in the background.
1H – 4H Technical Outlook:
As shown on the chart, the market opened with a large bullish gap. Some short-term traders anticipate a pullback to fill the gap, which could push prices down toward the 6,800 area. However, a sustained move above 6,860 may signal further bullish momentum toward the upside.
Trading Strategy:
For now, patience is key — let the market reveal its reaction around key price zones before entering new positions.
Disclaimer:
This content is for informational purposes only and does not constitute financial or investment advice. © DIBAPRISM
Amir D.Kohn

Utilities vs S&P 500 — defensive spread for market extremesWhen markets reach phases of overvaluation and extreme concentration, we believe positioning in the Utilities vs S&P 500 spread (XLU/SPX) can make sense.
Looking back, in every correction of more than 20% in the S&P 500, the Utilities sector has outperformed — by margins ranging from +13% to +68%, depending on the severity of the selloff.
This spread acts as a defensive play, isolating sector risk and reducing exposure to market-wide drawdowns, while still participating in the broader market cycle.
Utilities tend to hold up better when:
Rates stabilize or decline.
Market breadth narrows to a few mega caps.
Risk-off sentiment starts to rise.
📈 We’re watching this spread closely at current levels.

US500 BREAKS 6,740:Bull Market Roars, But Inflation Shadows PeakUS500 Snapshot
US500 is exhibiting a clear bullish trend, pushing to new all time highs above 6,740. Strong momentum is driven by robust corporate earnings, particularly from large cap technology stocks, and prevailing bullish investor sentiment.
Key Drivers and Catalysts:
Earnings Strength: Resilient corporate earnings, particularly within the "Magnificent 7" mega cap technology stocks, remain the primary engine for the index's upside.
Sticky Inflation & Fed Policy : Persistent inflation in the services sector is injecting selective caution but reinforcing the appeal of strong, high growth companies. With expectations elevated for the US Fed to cut rates to protect a weakening US Jobs market further supporting the index.
Political Policy Influence: The forward outlook is being shaped by economic policy prospects, notably potential tariffs and tax changes under President Trump's administration.
Outlook: Key Risks & Levels:
The general consensus among major financial institutions is for further growth towards year end, with targets ranging from the conservative 5,700 to the bullish 7,100.
The prevailing scenario is a continuation of the upside toward the next major resistance level near 6,800.
While continued earnings expansion and a relatively stable macro backdrop support single digit growth expectations, the outlook is tempered by key risks:
High Valuations: Elevated index valuations could limit aggressive buying.
Macro/Policy Risks: Moderate volatility is expected around upcoming inflation and interest rate data. Furthermore, ongoing uncertainties related to trade and policy (e.g., the tariff debate) pose a risk to sentiment.
Analysis by Terence Hove, Senior Financial Markets Strategist at Exness

S&P 500 made new all time highs of 6807- S&P 500 does not left behind, it also made new all time highs from Shocks of Tariffs to Market Recovery 📈
- The U.S. market witnessed a sharp 3% drop after Trump’s 100% tariff announcement on China, wiping off nearly $3 trillion in market cap.
- Yet, in just 15 days, the index bounced back, adding back those trillions and stabilizing near a $58 trillion market cap.
- Volatility remains high as trade tensions and election uncertainty drive investor sentiment. ⚖️

SPX500 – Overview | Bearish Pressure Below 6,699SPX500 – Overview | Bearish Pressure Below 6,699
U.S. stock futures opened the week flat, as easing U.S.–China trade tensions offered some relief to markets.
Investors are now turning their focus to a busy earnings week and upcoming inflation data, while diplomatic meetings between U.S. Treasury Secretary Scott Bessent and Chinese Vice Premier He Lifeng aim to further defuse tensions ahead of a potential Trump–Xi summit later this month.
🕯 Technical Outlook
SPX500 remains under bearish momentum while trading below 6,699, targeting 6,670 → 6,633 → 6,610.
If the price closes a 1H candle above 6,716, it would shift momentum bullish, with upside targets at 6,754 and beyond.
Pivot: 6,699
Support: 6,670 – 6,633 – 6,610
Resistance: 6,716 – 6,731 – 6,755

SPX — Still Below Anchored VWAP, Eyes on Lower Channel BoundSPX remains capped below the anchored VWAP — sellers still dictating flow. If price can’t reclaim above, a move toward the lower bound of this descending channel remains in play. Watching for a reaction near channel support.
Macro Backdrop:
Sticky yields: 10Y holding near cycle highs keeps pressure on equity multiples.
Fed tone: “Higher for longer” stance limits risk appetite and valuation expansion.
Slowing growth: Softening ISM and consumer data hint at cooling demand.
Earnings compression: Margin pressures building as labor and input costs stay elevated.
Geopolitical overhangs: Middle East tensions and trade friction adding to risk-off tone.
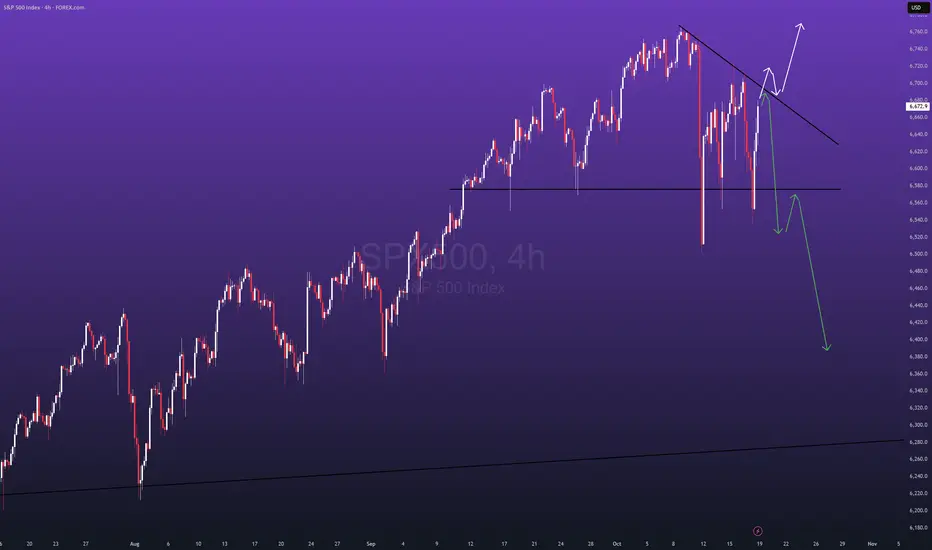
SPX Setup - overdue for a dip, is it time?Lets see what price does when it reaches the trendline above. A break and retest, or rejection on the line would be a good risk/reward setup.
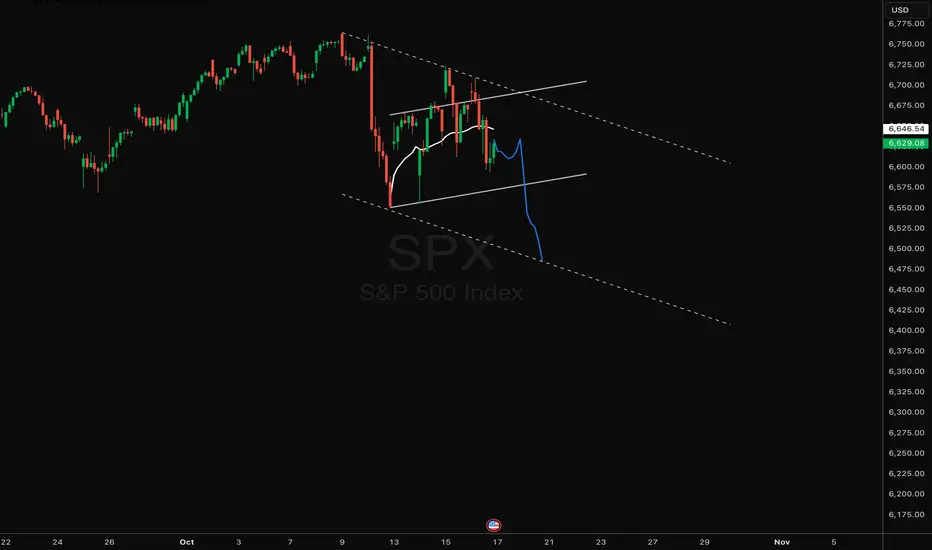
SPX short term roadmapPath says it all. Not financial advice. Will show zoomed out channel in another post.
S&P 500 May Show Signs of FatigueS&P 500 has rallied steadily since April, but some traders may see signs of fatigue.
The first pattern on today’s chart is the large bearish candle last Friday, October 10, as trade wars resurfaced. Prices have remained trapped inside the range since. Does the sideways trend mark an end to the six-month uptrend?
Second is the high on September 22, higher high on October 9 and lower high on October 15. That may be viewed as a potential rounded top. A pair of bearish outside bars could also be viewed as reversal signals.
Third is the October 3 weekly close of 6,715. SPX peaked near the same level on Wednesday and Thursday, which may suggest resistance has been established at a lower level.
Fourth, you have the September 26 weekly close of 6,644. The index plunged beneath that price last Friday and tried unsuccessfully to rebound above it in the first half of this week. That may reflect a lack of new support.
Next, SPX is potentially breaking a rising trendline that began in late May.
Finally, MACD has recently turned negative and prices may be stalling at the 8-day exponential moving average.
TradeStation has, for decades, advanced the trading industry, providing access to stocks, options and futures. If you're born to trade, we could be for you. See our Overview for more.
Past performance, whether actual or indicated by historical tests of strategies, is no guarantee of future performance or success. There is a possibility that you may sustain a loss equal to or greater than your entire investment regardless of which asset class you trade (equities, options or futures); therefore, you should not invest or risk money that you cannot afford to lose. Online trading is not suitable for all investors. View the document titled Characteristics and Risks of Standardized Options at www.TradeStation.com . Before trading any asset class, customers must read the relevant risk disclosure statements on www.TradeStation.com . System access and trade placement and execution may be delayed or fail due to market volatility and volume, quote delays, system and software errors, Internet traffic, outages and other factors.
Securities and futures trading is offered to self-directed customers by TradeStation Securities, Inc., a broker-dealer registered with the Securities and Exchange Commission and a futures commission merchant licensed with the Commodity Futures Trading Commission). TradeStation Securities is a member of the Financial Industry Regulatory Authority, the National Futures Association, and a number of exchanges.
TradeStation Securities, Inc. and TradeStation Technologies, Inc. are each wholly owned subsidiaries of TradeStation Group, Inc., both operating, and providing products and services, under the TradeStation brand and trademark. When applying for, or purchasing, accounts, subscriptions, products and services, it is important that you know which company you will be dealing with. Visit www.TradeStation.com for further important information explaining what this means.

Longer term S&P500 potential Slightly longer term look at the S&P 500 if we see a further decline in price. This is a weekly chart and would need to see price decline by some 15% from the current level. Theres a few current catalysts that could contribute to such a move:
- US government shutdown comes to an end. The shutdown itself maybe wouldn't have the biggest market reaction but at the moment markets are trading in the dark with the absence of major US macro data so the eventual release of this data will cause some very big volatility, just a matter of seeing in which direction.
- We've seen some positivity in the geopolitical space and market were continuing to rally although it seems it's either priced in now or has been shrugged off, well see how goes through the remainder of trumps peace deal.
- We're also coming into Q3 earning and some of the big names have been massively helping to drive indexes higher. Any big misses or beats on earnings could also provide some big volatility, lots of stocks are propped up with high expectations so downside could be big on misses.
- Finally, market is still uneasy since that last tariff threat to China , confirmation on the end of this would also spread some good positivity in the equity space.
Any of these current drivers could have the potential to see price towards the weekly trendline or to breakout through ATH's again.
Depending on if you're taking a leveraged shorter term trade or an unleveraged ETF investment would determine how/when you enter on such a pullback.

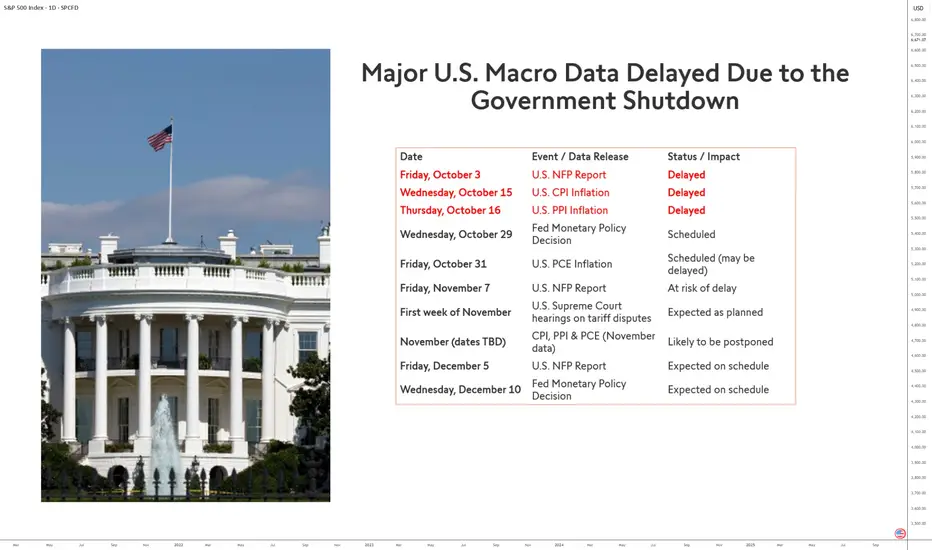
Major Macroeconomic Data Delayed Due to the US govt ShutdownThe recent shutdown of the U.S. government has triggered a domino effect on the release of key macroeconomic indicators. Due to the temporary closure of several federal agencies — notably the Bureau of Labor Statistics (BLS) and the Bureau of Economic Analysis (BEA) — a series of crucial statistics have been delayed, making it more difficult to assess the real-time economic situation of the United States.
A Severely Disrupted Economic Calendar
From early October, several major releases were postponed. The Non-Farm Payrolls (NFP) report scheduled for October 3 was the first casualty and the CPI and PPI inflation indicators on October 15 and 16.
These consecutive delays have disoriented financial markets, depriving them of the statistical benchmarks essential to anticipate the Federal Reserve’s decisions. As a result, visibility on inflation, employment, and consumption trends has been significantly reduced, fueling volatility in U.S. equity markets.
The Fed in the Dark
This disrupted schedule complicates the Fed’s task ahead of its October 29 monetary policy decision, followed by the PCE inflation release on October 31.
Without fresh data, FOMC members will have to rely on partial or outdated information to decide on the path of interest rates. This lack of reliable data could lead the institution to adopt a more cautious stance, postponing any major adjustment to its monetary policy.
Cascading Effects in the Coming Months — Unless the Shutdown Ends in October
The November 7 NFP report and Supreme Court hearings on tariff policies, scheduled for the same week, may also be affected if the shutdown continues. Similarly, November inflation data (CPI, PPI, and PCE) could face further delays, undermining the accuracy of economic forecasts for year-end.
Finally, the December releases — notably the December 5 NFP report and the December 10 Fed meeting — could mark a return to calendar normality, provided the affected agencies manage to catch up on lost time.
In short, the sooner this shutdown episode ends, the faster the overall publication of macroeconomic figures will return to normal.
DISCLAIMER:
This content is intended for individuals who are familiar with financial markets and instruments and is for information purposes only. The presented idea (including market commentary, market data and observations) is not a work product of any research department of Swissquote or its affiliates. This material is intended to highlight market action and does not constitute investment, legal or tax advice. If you are a retail investor or lack experience in trading complex financial products, it is advisable to seek professional advice from licensed advisor before making any financial decisions.
This content is not intended to manipulate the market or encourage any specific financial behavior.
Swissquote makes no representation or warranty as to the quality, completeness, accuracy, comprehensiveness or non-infringement of such content. The views expressed are those of the consultant and are provided for educational purposes only. Any information provided relating to a product or market should not be construed as recommending an investment strategy or transaction. Past performance is not a guarantee of future results.
Swissquote and its employees and representatives shall in no event be held liable for any damages or losses arising directly or indirectly from decisions made on the basis of this content.
The use of any third-party brands or trademarks is for information only and does not imply endorsement by Swissquote, or that the trademark owner has authorised Swissquote to promote its products or services.
Swissquote is the marketing brand for the activities of Swissquote Bank Ltd (Switzerland) regulated by FINMA, Swissquote Capital Markets Limited regulated by CySEC (Cyprus), Swissquote Bank Europe SA (Luxembourg) regulated by the CSSF, Swissquote Ltd (UK) regulated by the FCA, Swissquote Financial Services (Malta) Ltd regulated by the Malta Financial Services Authority, Swissquote MEA Ltd. (UAE) regulated by the Dubai Financial Services Authority, Swissquote Pte Ltd (Singapore) regulated by the Monetary Authority of Singapore, Swissquote Asia Limited (Hong Kong) licensed by the Hong Kong Securities and Futures Commission (SFC) and Swissquote South Africa (Pty) Ltd supervised by the FSCA.
Products and services of Swissquote are only intended for those permitted to receive them under local law.
All investments carry a degree of risk. The risk of loss in trading or holding financial instruments can be substantial. The value of financial instruments, including but not limited to stocks, bonds, cryptocurrencies, and other assets, can fluctuate both upwards and downwards. There is a significant risk of financial loss when buying, selling, holding, staking, or investing in these instruments. SQBE makes no recommendations regarding any specific investment, transaction, or the use of any particular investment strategy.
CFDs are complex instruments and come with a high risk of losing money rapidly due to leverage. The vast majority of retail client accounts suffer capital losses when trading in CFDs. You should consider whether you understand how CFDs work and whether you can afford to take the high risk of losing your money.
Digital Assets are unregulated in most countries and consumer protection rules may not apply. As highly volatile speculative investments, Digital Assets are not suitable for investors without a high-risk tolerance. Make sure you understand each Digital Asset before you trade.
Cryptocurrencies are not considered legal tender in some jurisdictions and are subject to regulatory uncertainties.
The use of Internet-based systems can involve high risks, including, but not limited to, fraud, cyber-attacks, network and communication failures, as well as identity theft and phishing attacks related to crypto-assets.
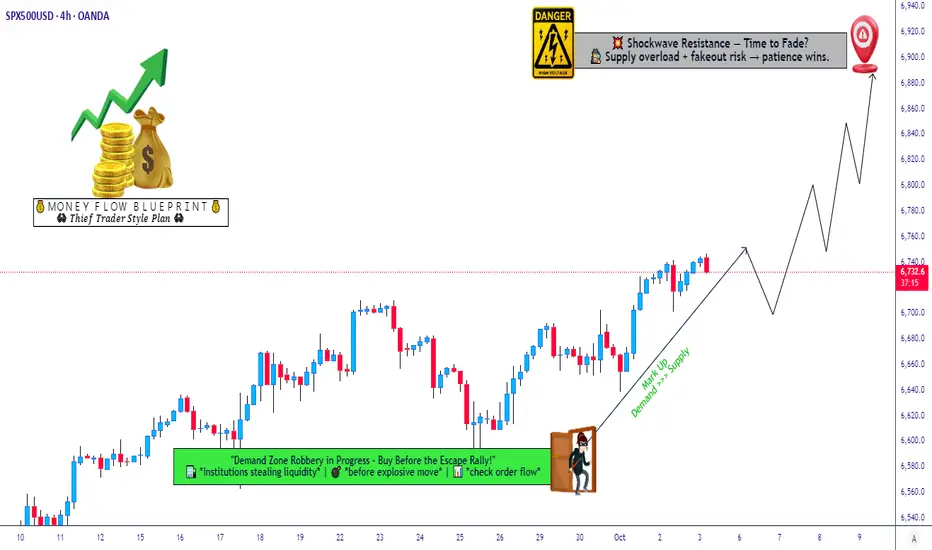
SPX 500 Swing/Day Trade Plan | Bullish Layers & Risk Guard✨ SPX 500 Index | Market Wealth Strategy Map (Swing/Day Trade) ✨
🚨 Plan: Bullish bias with Thief Strategy (layered limit entries).
🕹️ Style: Multiple buy-limit orders placed at different levels (“layering method” for smarter entries).
🎯 Entry Plan (Layered Thief Style)
🔑 Buy Limit Layers: 6660, 6680, 6700, 6720
➕ You can add more layers if market conditions allow.
🧠 Idea: Scaling in like a true Thief 🕶️ — stealing the best spots!
🛑 Stop Loss (SL)
Thief SL: @ 6640
⚠️ Note: Dear Ladies & Gentlemen (Thief OG’s), I’m not recommending you to use only my SL.
It’s your money → your choice → your risk management.
🎯 Target (TP)
Primary Target: @ 6900
🌀 Why? Shockwave resistance ⚡ + overbought zones 📈 + liquidity traps 🪤.
⛑️ Again, it’s your choice to set your own TP — escape with profits when you feel comfortable!
📊 Related Pairs & Correlations to Watch
CAPITALCOM:US500 / SP:SPX / CME_MINI:ES1! → Direct correlation to SPX 500.
NASDAQ:NDX / NASDAQ 100 → Often leads tech momentum, affects SPX swings.
TVC:DXY (US Dollar Index) → Strong dollar = pressure on indices. Weak dollar = fuel for bulls.
CAPITALCOM:US30 (Dow Jones) → Sometimes diverges from SPX, offering confluence signals.
TVC:VIX → Volatility Index — spikes = watch out for fakeouts / liquidity grabs.
💡 Key Takeaways
✅ Thief layering entry style = Scaling smarter, not harder.
✅ SL/TP = Flexible to your own trading psychology & risk appetite.
✅ Always respect risk management & don’t copy-paste blindly.
✅ Remember: markets love traps — be the thief, not the victim.
✨ “If you find value in my analysis, a 👍 and 🚀 boost is much appreciated — it helps me share more setups with the community!”
⚠️ Disclaimer: This is a Thief-style strategy shared just for fun & market learning purposes.
Not financial advice — trade at your own risk!
#SPX500 #US500 #SP500 #SPX #ThiefStrategy #DayTrading #SwingTrading #IndexTrading #MarketAnalysis #StockMarket
Monday up, Thursday lowOr something like that. I expect a C wave down next which should take a few days at least. Gold also probably pulls back to 4100-4k. BTC probably lower, now at resistance. All moves down would likely be short lived, so caution is necessary.

BUY SPX - S&P500- Amazing low risk high reward trade!Based on our deep analysis we can see that SPX - S&P500 will head to the upside. Great time to buy - it has broken major resistance levels + trends.

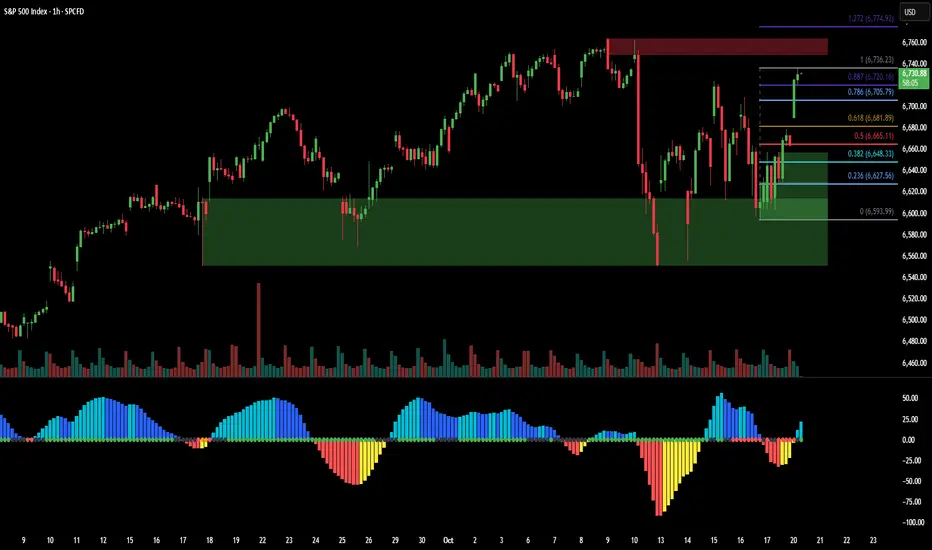
SPX Hourly Structure: Rotation From Demand Toward SupplySPX has been climbing steadily off the mid-October demand base near 6,600–6,620, an area that absorbed multiple downside attempts over the past week. The current advance has now retraced the prior swing decline almost in full, reaching into the 0.886–1.0 Fibonacci zone near 6,720–6,736.
This region also overlaps with a prior overhead supply zone (≈ 6,740–6,760) that capped the early-October highs. That confluence makes this area a potential battleground between recovering buyers and residual sellers from the last breakdown.
Key structural notes:
Demand zone: 6,600 – 6,620 remains the short-term pivot for support.
Fib confluence: 0.786 – 1.0 zone aligns with prior rejection levels.
Momentum: Positive but flattening, hinting at possible consolidation if supply reacts.
Watching how SPX behaves inside this upper band will reveal whether the current move is part of a larger trend resumption or simply a retest within a range.
— Volatility Structure Notes
Educational analysis of SPX structure, supply/demand, and volatility context.
BUY SPX - S&P500- Profitable trade opportunity!Based on our deep analysis we can see that SPX (S&P500) will head to the upside. Great time to BUY - it is currently in a uptrend and is holding on to powerful support levels. The next target is the resistance level to the upside. This is a great low risk high reward trade. BUY NOW!

S&P 500 Index Shows Elevated VolatilityS&P 500 Index Shows Elevated Volatility
On the 4-hour chart of the S&P 500 Index (US SPX 500 mini on FXOpen), the ATR indicator with standard settings has not fallen below the 30 mark, signalling higher current market volatility compared to previous periods. Traders’ decisions are being influenced by the ongoing government shutdown, developments around a potential US-China tariff deal, and an increasingly active earnings season. Market sentiment has also been shaped by renewed concerns over regional bank stability and profit-taking in AI-related stocks.
Looking ahead, the new week is also expected to bring heightened volatility, as:
→ US Treasury Secretary Scott Bessent and Chinese Vice Premier He Lifeng are set to meet in the coming days, paving the way for a potential meeting between Presidents Trump and Xi later this month.
→ Attention will also turn to quarterly results from Netflix, Coca-Cola, Tesla, IBM, and Intel. With key US economic data releases suspended due to the government shutdown, investors are likely to look to corporate earnings for direction.
Technical Analysis of the S&P 500 Chart
Major turning points on the 4-hour S&P 500 chart, highlighted in bold, outline a broad ascending channel that reflects the market’s expanded price swings.
From a bullish perspective:
→ The price remains in the upper half of the channel.
→ Market sentiment is improving, with prices moving closer to last week’s highs during the European session.
→ As indicated by the arrow, a wide bullish engulfing pattern formed near the lower boundary of the channel, confirming strong buying interest around the 6,560 level.
From a bearish standpoint:
→ Selling pressure was particularly aggressive near 6,720, pushing the price lower on 10 October.
→ Last week, this level once again acted as resistance, suggesting that bears maintain control there, limiting near-term upside potential.
Given these dynamics, traders may wish to adjust their strategies to account for the prevailing volatility. Should positive headlines emerge on US-China trade progress, supported by upbeat corporate forecasts, the S&P 500 could make a push towards the upper channel boundary, potentially setting a new record near the 6,800 mark.
This article represents the opinion of the Companies operating under the FXOpen brand only. It is not to be construed as an offer, solicitation, or recommendation with respect to products and services provided by the Companies operating under the FXOpen brand, nor is it to be considered financial advice.
