AUS 200 Short To 4hr LowsBelieve it will drop back into the downtrend but may retrace around amber line so will exit if it begins to bounce from there.
SPI200 trade ideas

AUS200 7 FEB 20 - Bearish outlook.Hello guys, I expect a mega ascending triangle breakout on the level of 7033. Probably it will keep its bullish ride to the top of the triangle, and then it will drop, so i'd wait to open it. we just need a confirmation, and then I'll open it at the breakout point with a target on 6887

AUS200 1. Pattern @ YH
2. TDI Confluence (Price Keeps Moving Up TDI Keeps Trending Down)
3. Waiting For LSB (15 or H1)
4. Bearish OF


AU200 – SHORT (SELL)The AU200 have reached records highs that have not been seen since November 2007 with a major Monthly Resistance Area broken through like a hot knife through warm butter. On the H4 timeline we are starting to see a clear correction emerging.
I have already entered this trade earlier and is already in profit based on the analysis in this trade idea, but there is still opportunities for you as well. Please note that the SL (Stop Loss) in this analysis is for your trade you might want to take and not my actual SL since I am already in this trade.
The Linear Regression Trend is perfectly in line with our trend idea. l expect the AU200 to continue on its Monthly Bullish trend but we are simply trading a minor correction on a smaller time frame. The light green Linear Regression line together with the Three Phase Market Setup gave me a perfect entry opportunity
The AU200 have been one of my favorite trades for many years simply because of its slow moving trends that is easily identifiable on the Heikin Ashi bars.
The Monthly Trend is Bullish
The Weekly Trend is Bullish
The Daily Trend is Bullish with a Correction starting to show
The H4 Trend I would now consider Bearish since the last 2 trading days.
The Three Phase Market Setup Analysis:
You will see 3 x light orange boxes on the chart, I simply call this the Three Phase Market Setup Analysis and you can use this on any timeline. I was taught this analysis by a brokerage firm, I have not seen it yet here on Trading View trade ideas yet. This is basically what the Forex market is build on and you see this trend over and over, it is simply a case of training yourself to be able to identify it. This is in a nutshell the Forex Market setup, we can even call it the Forex Market's own strategy.
It is therefore important for you to be able to identify this setup every time before you place a trade, by doing this you will know exactly where the market is and how in line you are with the market. Let me repeat it again you will see this setup time and time again on every timeline. Make sure that you strategy is in line with the market's strategy. When the market is setting up, you are setting up, it has nothing to do with your opinion on what you think.
Phase 1:
Phase 1 is the Contraction phase where the volume starts to decrease dramatically due to Banks and Big Firms starting to take profits and getting rid of their previous long positions, this can further be determined by having access to a COT Report (or create your own COT* analysis)
You never trade phase 1, never ever enter a trade in phase 1. This is a basic rookie mistake where they see a market trending sideways and then they think that the market is reversing, this is where the market simply takes your money as it moves into phase 2.
* The Commitments of Traders (COT) is a report issued by the Commodity Futures Trading Commission (CFTC). It aggregates the holdings of participants in the U.S. futures markets (primarily based in Chicago and New York), where commodities, metals, and currencies are bought and sold.
Phase 2:
Phase 2 is the Expansion Phase where we see Increasing Institutional Volume. The range now start opening up, it is now taking out highs and lows and there goes the retail traders stop loss. How many times have you seen a trade going in the actual direction you predicted but simply for you to get stopped out before it start trending in your direction, now you know the reason.
Smart money is now accumulating positions at discounted prices and retail traders who don't know what they are doing gets beaten up like crazy during phase 2. You still do not trade phase 2 and you simply use phase 2 to start identifying a clear trend reversal where you can have a possible entry point. The Linear Regression Trend is one method the you can use to identify a possible entry point
Phase 3:
Phase 3 is the trend phase where Institutional traders is start to take profits, also known as the payout cycle. The market now start making its moves to higher or lower prices (in this case, lower prices).
Retail traders will now make temporarily profit in phase 3 since they are going to trade right back into phase 1 again with their late entries, fear of missing out (FOMO) and not knowing where to place their take profits (TP) Whatever profits most retail traders make in phase 3 they will loose again in phase 1 as the market cycle repeats itself.
Retail traders who enter late (about 80% of all retail traders) simply give the Institutional traders (Banks and Big Firms) their liquidity to cash out again, and so the cycle continues. This cycle is as consistent as the sun coming up every day.
Now please do me a favor and go and open up the AUD200 on the Daily time-frame. You will now see the Three Phase Market Setup even more clearly over there. When looking at the AUD200 chart the general tendency is to predict that the market will simply continue on it Bullish trend, but now that you know Three Phase Market Setup Analysis you can almost enter most of your trades exactly where the Institutional traders (Banks and Big Firms) enter their trades.
Here is just a quick overview of what the AU200 is:
The main index (S&P/ASX 200 Index) of the Australian Securities Exchange is calculated on the basis of stock prices of 200 largest companies, traded on this Exchange. Overall, stocks of more than 2000 companies are traded on the Australian Exchange. The stocks, included in the index, provide the largest part of the turnover and well reflect the overall state of the Australian Securities Exchange. In IFC Markets this index is presented as a synthetic continuous (without expiration) instrument.
Entry:
As indicated on chart, find you best entry point on the H1 and M30 chart. The Linear Regression Channel has already given you and entry point simply fine tune it on the H1 and M30 chart
Take Profit:
As indicated on chart
Stop Loss:
As indicated on chart
Good Luck – Trade Responsible
Use 1% risk per Position!
Always strive to continuously improve your trading strategy and knowledge

ASX - Bearish Divergence - SELLGood morning traders,
The ASX has reached a key level failing to break above the inclining channel.
There is currently a bearish divergence on the RSI followed by an inclining wedge formation.
With global indices looking very fragile at the moment due to the Coronavirus, Impeachment and earnings season in the US, the ASX could follow suit.
Any comments are welcome!

Asx200 shortClear break out with a really strong impulse move.
It’s been over bought with 2 technical pattern on H4 there is a double top waiting to be broken and a H&S.
A clear break of 7040 will see more move to the downside.

Time to reduce risk Asx200 $XJO My forecast for the Hang Seng and Dow Jones are that a reversal back to the moving averages.
Now we are likely to see the same for XJO towards mid February.
The worst case scenario is we reversal back to the long term trendline support.
At this stage, it is unlikely that would happen.
Therefore, reversal back to 6800-7000 is more likely to me.
I have reduced my portfolio from 11 positions to 4 heading to next week.

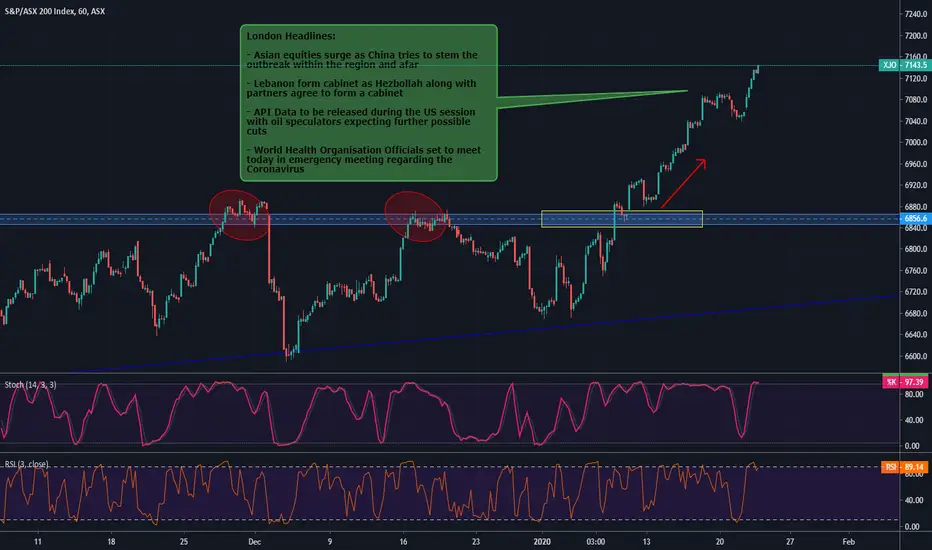
Asian Equities Surge as Fears Over Virus SubsideHeadlines:
- Asian equities surge as China tries to stem the outbreak within the region and afar
- Lebanon form cabinet as Hezbollah along with partners agree to form a cabinet
- API Data to be released during the US session with oil speculators expecting further possible cuts
- World Health Organisation Officials set to meet today in emergency meeting regarding the Coronavirus

AU200 – SHORT (SELL)The AU200 have reached records highs that have not been seen since November 2007 with a major Monthly Resistance Area broken through like a hot knife through warm butter. On the H2 timeline we are starting to see a clear correction emerging.
The Linear Regression Support line have been broken and now serves as the new H2 resistance line, we still expect the AU200 to continue on its Monthly Bullish trend but we are simply trading a minor correction on a smaller time frame.
The AU200 have been one of my favorite trades for many years simply because of its slow moving trends that is easily identifiable.
Here is just a quick overview of what the AU200 is:
The main index (S&P/ASX 200 Index) of the Australian Securities Exchange is calculated on the basis of stock prices of 200 largest companies, traded on this Exchange. Overall, stocks of more than 2000 companies are traded on the Australian Exchange. The stocks, included in the index, provide the largest part of the turnover and well reflect the overall state of the Australian Securities Exchange. In IFC Markets this index is presented as a synthetic continuous (without expiration) instrument.
Entry:
As indicated on chart, find you best entry point on the H1 and M30 chart. The Linear Regression Channel has already given you and entry point simply fine tune it on the H1 and M30 chart
Take Profit:
As indicated on chart
Stop Loss:
As indicated on chart
Good Luck – Trade Responsible
Use 1% risk per Position!
Always strive to continuously improve your trading strategy and knowledge

AU200 SHORT (SELL)The chart explains itself, my apologies everyone not enough time at the moment to explain my analysis in details


Asia Markets Higher on Monday Open Whilst Crude Prices Stay FlatHeadlines:
- Crude finishes the Asian session flat as markets seemed to steer clear of negative news over the weekend.
- Asian equity markets took much of the spotlight during the session as ASX200 finished up +0.85% as well as the Nikkei225 up +0.73% with Industrials and Minerals leading the chart in Australia.
- During the Asian saw China post Trade Balance data which beat market expectations slightly showing slight increase in strength in the Chinese economy even after a lower quarter of exports to the United States during this period. Expected number of 315billion was below expectations which came out at 329B.

ASX200 All-Time Highs After Better than Expected Retail Sales Asian Session:
- ASX200 breaks all time highs breaking past strong resistance level of 6850-70
- Australian Retail Sales post better than expected numbers +0.9% for the month of December

ASX200 - approaching sturdy resistance?The median line of this Schiff pitchfork has proved strong resistance for this index twice since 2009 has lead to healthy declines each time it's been hit. 3rd time lucky to break out or not.......?


Australia Stocks and S&P/ASX 200 Drops At The End Of TradingOn Wednesday, Australia stocks were softer after the stock trading. It was due to the deficits in the IT, Consumer Discretionary, and Financials sectors that led the shares weaker.
At the end of trading in Sydney, the S&P/ASX 200 plunged 0.13%.
The best performers of the trading session on the S&P/ASX 200 were Independence Group NL , which soared 6.00% or 0.390 points to trade at 6.890 at the close.
Meanwhile, Newcrest Mining Ltd also increased by 4.03% or 1.240 points to end at 32.000 as well as Regis Resources Ltd that rose 3.70% or 0.160 points to 4.480 in late trading.
On the flip side, the worst performers of the session were Polynovo Ltd declined 8.13% or 0.165 points to trade at 1.865 at the end of the stock trading.
Pendal Group Ltd also dropped 5.32% or 0.480 points to end at 8.540 along with Pilbara Minerals Ltd that decreased 4.76% or 0.015 points to 0.300.
Meanwhile, falling stocks outnumbered advancing ones on the Sydney Stock Exchange by 761 to 402, and 333 ended untouched.
Moreover, shares in Independence Group NL grew to 5-year highs; up 6.00% or 0.390 to 6.890.
The S&P/ASX 200 VIX , which is measuring the implied volatility of S&P/ASX 200 options, strengthened 3.14% to 13.018.


