WAVESBTC trade ideas

Waves LONGWaves has formed a large falling wedge, a very large one
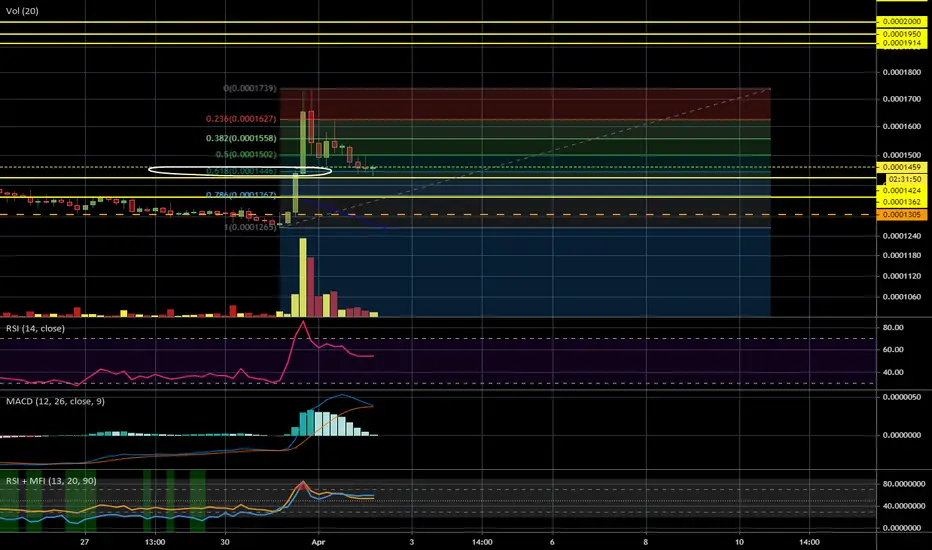
Currently sitting above the 50MA now isn't a bad entry point for long entry, of course it could go lower but you are still holding through the falling wedge of course
Included a Fibonacci retracement to see how a bullish viewpoint progresses


WAVES / BTC : LOOKING FOR BUY IN SHORT TERM AS PER ELLIOTT WAVE THEORY , WE HAVE COMPLETED THE 2 ND WAVE NOW 3RD WAVE IS RUNNING !!

WAVES is about to enter Support | 58% Do Like If you are holding WAVES
Price action is clearing the Next Possible Support Level.
Rising Wedge Target is marking the Support area which is supported by Previous Trendline.


Waves boiling kettle.What we can observe now on the chart is very careful but clear reaccumulation after the bounce from the bottom.
The lid on the kettle is starting to jump as this process is almost complete ale price ready for new highs.
Here are some factors confirming that:
-almost all EMAs are condensed within narrow price range which will serve as a strong support in coming months
-we are approaching the support of rising channel
-dynamic upward spikes are getting hard to control and it looks like it is really easy to go up from where we are now
What is to be expected in coming weeks?
I expect the price to move swiftly over 25k sats after this lengthy consolidation ends and Golden Cross will be the main trigger. As you can see on the chart it can happen very soon as the structure tightens and becomes too obvious to ignore. Short term speculators will push this up hard after the move is triggered. It may be easier to miss the move than you think so for those hoping there is plenty of time to enter the trade you better watch Waves carefully.
This is not financial advice.

WAVES: Slowly climbing upFor those who've forgotten, LPOS blockchain platform for dApps. One of the few crypto projects that shows signs of life does not look like a zombie.
Short analysis:
Waves is slowly climbing up still, roughly about +0.7%/day. Looks like some kind of relief rally or rising wedge on daily, I not a fan of patterns tho.
Just observing, have no plans to touch this, until it reclaims 0.00025 level at least. Or if bitcoin will suddenly become mega bullish (not pathetic-$200-swings-bullish, but MEGA bullish) - it will be one of the candidates for a buy.
Hit the "LIKE" button or sign up with my ref links below to support, thank you.
Information is just for educational purposes, never financial advice. Always do your own research.

WAVES/XBT moves down to test support for the third timeKRAKEN:WAVESXBT , which has recently been in a conservative upward trend, is moving down to test support for the third time. Given the bigger picture of the general trend, it is expected that WAVES/XBT will deflect upward after testing support.
Keep in mind, however, that the cryptocurrency space as a whole is looking rather bearish, and this does have a real chance of throwing off the current bullish trend in WAVES/XBT.


WAVES / BTC 4 HOUR SHORT CUTWaves looks ready for leg 2, bounche on the 0.618 fib, Bullish hammer, volume dropping fast bearsh divergence played out
Keep an eye on this one mates!
Waves Will Test EMA300 Next, See InsideWaves (WAVESBTC) just tested EMA100 as support and is now aiming at EMA300 or 0.0001785.
Depending on how this level is handled we can determine the next step.
We are looking at about 19% from the current price to our target. Prices can go much higher of course and hit the upper trendline of the ascending channel... WAVESBTC is looking really good.
Thanks a lot for reading.
Namaste.

WAVES/BTC (Resume uptrend?: up to 45% profit)WAVES/BTC
WAVES may have temporarily found support at 100D MA and ascending trendline support at 1290 sats area.
If this is the new higher low, our target is the swing high in the 1877 sats area.


WAVESBTC | Consolidated and ready to break Fib 0.618 resistanceWAVESBTC price was pumped on 11th of March, however further Bitcoin dump brought the price back. The previous price increase was caused by fundamental and thus increasing demand on WAVES while dump was caused mostly by panic sell and manipulative BTC market price actions.
Technicals reveal that WAVES price action is accumulated and now entered new growth phase
It is a Black Friday for WAVES and we recommend to accumulate the coin before it breaks through Fib 0.618 resistance because further the market players will receive a great signal to buy until it reaches 50% retracement level
Entry zone, targets and stop loss are in the automatic premium signal

Cuppa WAVES? $SHORTRead em and weep
- @a1mtarabichi
Please be sure to read the disclaimer after I publish and edit it in before even considering any of my publications or reading any statements, analysis, projections or conjecture in accordance with the 1934 Securities Exchange Act, Section 16A & more recently the Insider Trading Prohibition Act under Section 10(b) and the SEC’s Rule 10b-5.
Disclaimer
Note: This is strictly conjecture based on my own technical analysis and not any information based on any sources from the GOP Or federal government/treasury dept / ay institution of any form this example is for educational purposes only and should not be relied upon for any other use. Please invest responsibly and make all decisions based on your head; not your gut. Any projections or figures provided in this analysis are Forward-looking statements And have no basis Other than my own opinion and not information related to the GOP, SEC or wall sf in general. Just the wiz doing what he always did best — Disclaimer must be extended and extensive So forgive me as I need to truly emphasize None of the information obtained in conducting this analysis was provided by insider trading in anyway shape or form.
[i[Certain information set forth in this presentation contains “forward-looking information”, including “future oriented financial information” and “financial outlook”, under applicable securities laws (collectively referred to herein as forward-looking statements). Except for statements of historical fact, information contained herein constitutes forward-looking statements and includes, but is not limited to, the (i) projected financial performance of the Company; (ii) completion of, and the use of proceeds from, the sale of the shares being offered hereunder; ( iii ) the expected development of the Company’s business, projects and joint ventures; (iv) execution of the Company’s vision and growth strategy, including with respect to future M&A activity and global growth; (v) sources and availability of third-party financing for the Company’s projects; ( vi ) completion of the Company’s projects that are currently underway, in development or otherwise under consideration; ( vi ) renewal of the Company’s current customer, supplier and other material agreements; and ( vii ) future liquidity, working capital, and capital requirements. Forward-looking statements are provided to allow potential investors the opportunity to understand management’s beliefs and opinions in respect of the future so that they may use such beliefs and opinions as one factor in evaluating an investment.
These statements are not guarantees of future performance and undue reliance should not be placed on them. Such forward-looking statements necessarily involve known and unknown risks and uncertainties, which may cause actual performance and financial results in future periods to differ materially from any projections of future performance or result expressed or implied by such forward-looking statements.
Peace & Love
Twitter / LInkdeln / Steemit / TradingView / StockTwits / IG
-@a1mtarabichi

WAVESBTC -> resistance and ascending wedgeMedium term looks bullish, but long term may be firstly bearish, until break the red resistance


Waves Trade IdeaHello Traders,
Waves broke out a rectangle formation and did an bullish pivot indicating that is going to the next resistance level. It is expected due to the previous bullish trend.
Please push like button and follow us on our social medias.

WAVES ANALYSIS (BOUNCE LONG INCOMING!)WAVES
WAVES has retraced back into a known buy in entry zone located at 1000 sats. One small green hammer wick hit almost 920 sats (under buy in) but was quickly eaten up by buyers. This is bullish. Not only that, Stoch has been sitting in oversold for days now as the accumulation at this level occurs. I expect WAVES to be at a great buy in zone. 50 is looking to cross the 200 MA soon as well. A pop above 1100 sats is long term bullish. Especially if 50 crosses the 200ma. Look for T1 at 1100 sats, followed by T2 at 1225 sats. Lastly, the previous top at 1400 sats for T3.
Possible Entries: 1000 sats

Waves Finds Support, Retrace Over? Next Target MappedWaves (WAVESBTC) finds support just below the .618 Fib. retracement level for the last bullish wave... This can signal that the retrace that started on the 1-Jan. is over.
As prices for Waves bounced and started to move up, prices went above EMA10/50 and are now challenging EMA100.
We can see increasing volume/a volume breakout, a very strong RSI and a bullish MACD.
All these signals are telling us that the retrace is complete.
Our main targets are marked with magenta dashed lines on the chart.
This is not financial advice.
If prices move lower, 0.0001027 is the immediate support.
0.0000935 can be used as a stop-loss. We use manual stop-loss when trading cryptocurrency.
You can read more about it here:
Feel free to hit LIKE to show your support.
Namaste.
