Waves touching suport, easy 20%Waves is touching again the suport area, and if didn't break down is easy to check the resistances...
STOPloss is necesary arround 6780!
WAVESBTC trade ideas

WAVES Midterm Strong resistance at 69000 Satoshi. If BTC stops, waves schould leave the channel and reach some of my levels marked with green candles.

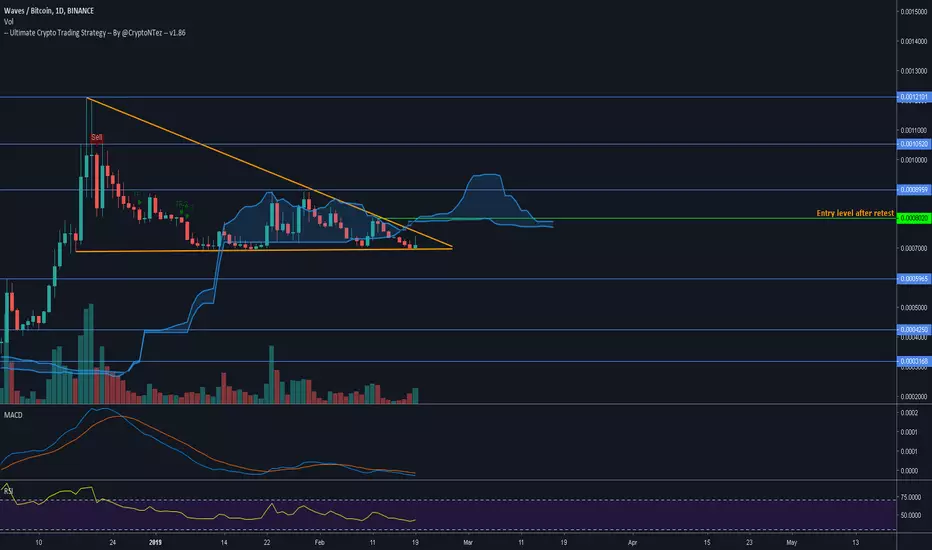
Descending triangle in play.With current market conditions, I would expect for it to break to the upside. Both MACD & RSI flat. No signal yet from the UCTS. Volume decreasing but something will happen. Set alerts and wait. Potential targets on the chart #WAVES
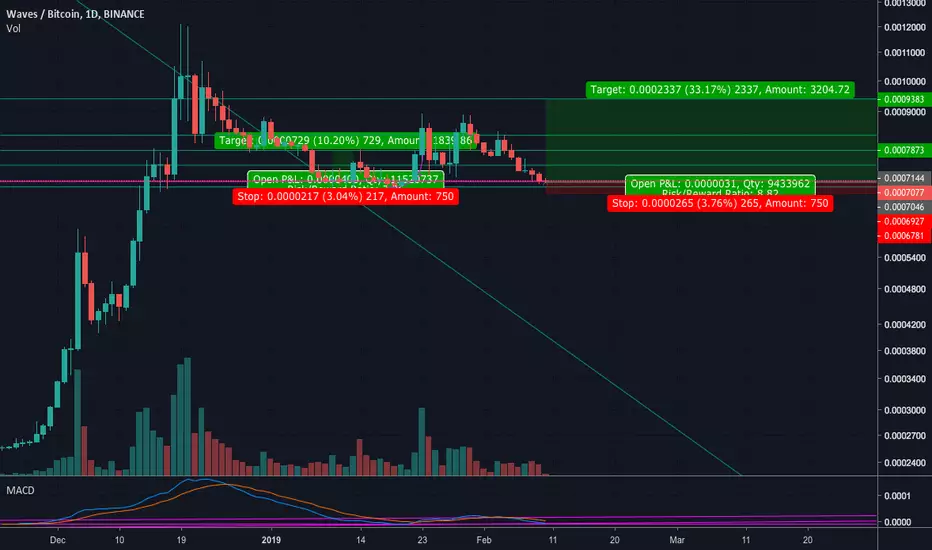
WAVESBTC R8Hello,
Soon money from majors will flow in large and medium caps. Some nice ideas avaliable at the moment.
One of them with high Risk:Reward is WAVESBTC.
Enter: 0.0007000
SL: 0.0006888
TP: 0.0007885
Risk:Reward 7.9

WAVES FOR 15-25%Buy Min price: 0.0007030
Buy Max price: 0.0007150
Stop: 0.0006750
T1# 0.0007531
T2# 0.0007996
T3# 0.0008637


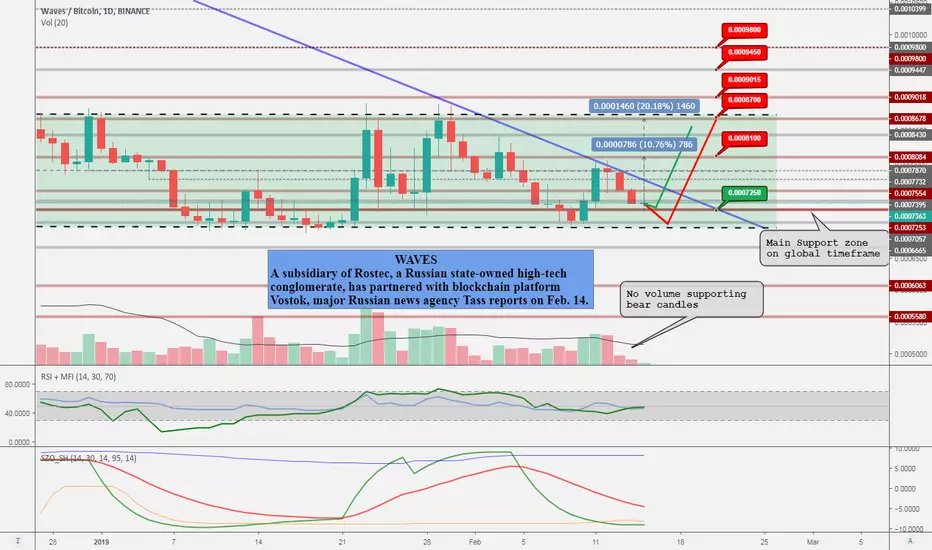
WAVES ready for new series of waves.WAVES are still in consolidation channel after +360% price boost experienced in November-December. Right below current price is a solid support zone between ~7050 and 7250. While there are no guarantees price will bounce, if it does, we may expect 10-20% profit + potential parallel channel breakout, that will lead to new higher highs in 2019.

Looks like Waves is ready to take off ?It just broke out of a smaller wedge in the 4H TF and it is getting close to the breakthrough level on the 1D charts.
The momentum looks good and the valtility is jumpy... always a good sign on cripto


WAVES/BTCThe Pathway of Waves To 920 , maybe more !
They will introduce a major international partner on Februry 17th


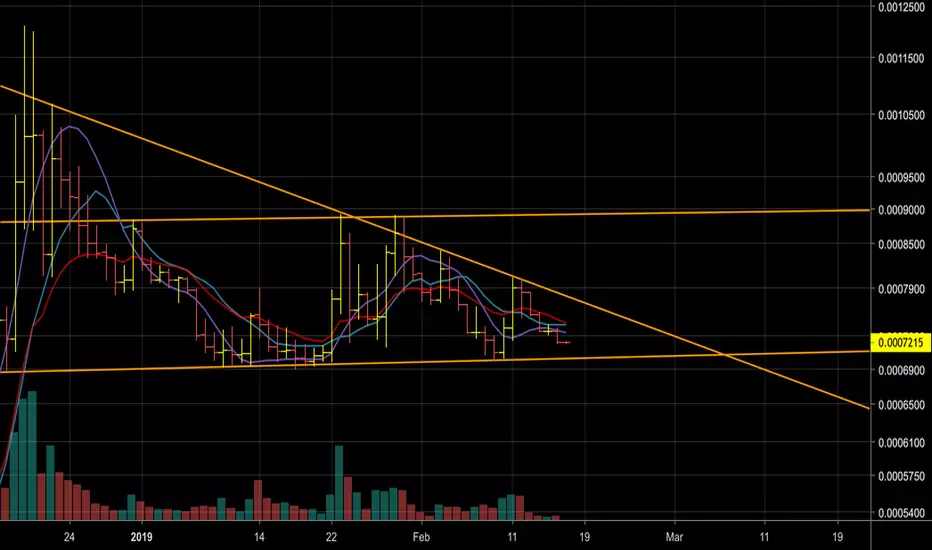
Posible triángulo/banderín en WavesInteresante Waves/Btc que estaría tratando de salir de una onda 2 de Elliot como nos indica el SAR.
Presenta un par de posibles figuras:
Triángulo alcista que, de cumplirse, nos llevaría hasta los 12.000
Banderín con el mismo triángulo que, de cumplirse, lo haría pasar de los 16.000
Hay otro posible triángulo que he marcado con una línea discontinua verde que lo mandaría a los 13.000
Si vamos a 2h vemos un posible HCH que acabaría de romper, aunque no me gusta el volumen de la figura.
El volumen cuadra con los posibles triángulos.
En cuanto a indicadores básicos, las medias móviles que empleo estarían a puntito de generar un triple cruce alcista.
En el Bollinger se observa un cierto estrechamiento pero no suficiente para marcar claramente un cambio de tendencia.
En resumen, todo parece indicar que se va a la luna, aunque sería recomendable esperar a la ruptura del triángulo amarillo.
Éste es mi análisis y no supone ningún tipo de consejo de inversión. Llevo poco tiempo en esto así que se aceptan todo tipo de correcciones.


Waves ($WAVES) - buy and sell zones. Looks like $WAVES already started it's new bull cycle.
Buy - green. Sell - red.
It's not a financial advice.
Trade carefully and good luck!

WAVEBTC SELL WAVE - 40% Bad scheduleToday I saw a bad signal for investors WAVE coin. Wave growth was very fast and unreasonable. This growth is similar to the company's marketing. Be careful with this cryptocurrency now!
This is not a trading signal. It's my opinion.


buying waves herethis is the loading zone of this range since the pump and volume is still good so lets ride