Walton4hr wtc chart here......looking for it to retouch trend line, looking to reload some more at 0.00136. Yellow line is from ath
WTCBTC trade ideas


WTCBTC....ready for bull runhey guys. i checked WTC's weekly and daily charts.
weekly shows bull signals like prior bull run.... piercing candle stick pattern exist
daily shows as well.... the VWMA have crossed the SMA which is the same as the prior bull run. also if you look at the daily MACD it's crossed.
i think the new bull run is on the way and to me the trade active.
*** we can see slight retracement after hitting the first target
good luck
its for myself not an advice
comments and likes are wellcome

The Waltons 2WTC has pushed thru resistance and is now sitting on it as support as the candles move back toward the uptrend of the 1x1 Gann fib ray - On the dollar chart we can see that the candles have gained the 38.20% fib - The Gann 1x1 should hold as should the fib and its likely we see more upside soon

A possible low risk high reward trade for WTC>Respected upward support line
>Higher low
>Currently resting on resistance turned support line
>Unpumped Binance coin

Fractal IdeaFirstly, BTC is king and sets the tone for the market, and I dont think were in the clear yet. Too many similarities (the fractals are remarkable) between November 2013 through 2014 to where we are today. I think we are where BTC was in late May of 2014 right now. That being said, enjoy alt season while it last.
WTC looks like it may break out in the 4-5 days. RSI looks like its getting rejected at 55 on the daily. I think theres limited upside to this play, but could still get you ~40%
T1 18 (+20%)
T2 24 (35%)
SL 12.5 (-15%)

$WTC next long run incomingBINANCE:WTCBTC its time for my sweety again.. last price range was my entry + close position.. AO looks good and will possibly break out at my favorite month in the year.


WALTON (WTCBTC) Trade (260% Earning Potential) ON BinanceWalton Just Cross the triangle. Bull run already started!
Buy Between : 151.000 Sat To 160.000 Sat
Sell Target 1 @ 200.000 Sat
Sell Target 2 @ 240.000 Sat
Sell Target 3 @ 300.000 Sat
Sell Target 4 @ 400.000 Sat
Enjoy this big explosion next days weeks!

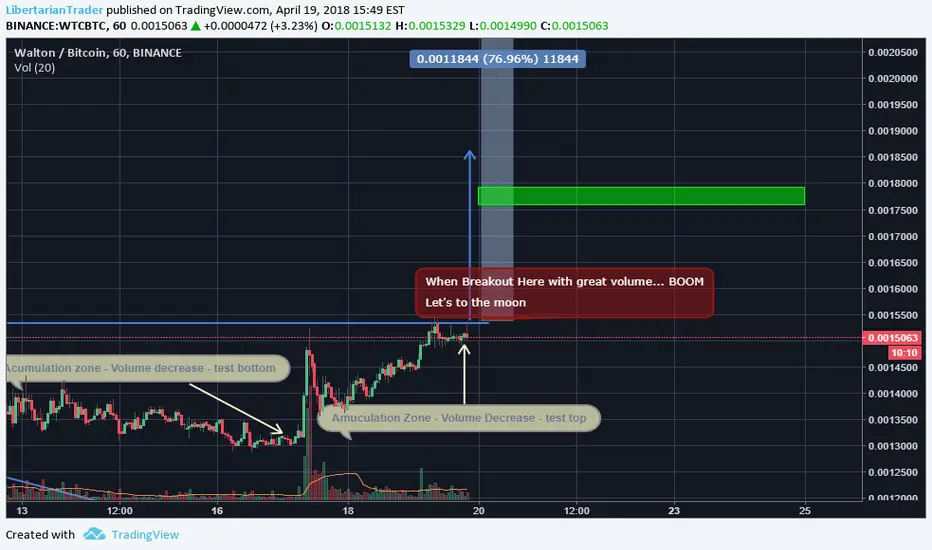
WTC - 75% ProfitEnter 0.0015500 if great volume
Target 1 - 0.00177000
Target 2 - 0.0023000
Target 3 - 0.0027000
Stop Loss - 0.0015000
Follow the LibertarianTrader and enjoy.
WTCBTC READY FOR WAVE 5We are forming an ascending triangle which is about to be broken and will confirm the next move up for the short term. Long term we are looking at the 5th elliot wave which could bring a 500% profit potential at minimum.

WTC-BTCWalton is at an interesting point to me. It's testing resistance levels and the 50MA. We can see that it broke its channel and is trying to find gains upwards. We will have to monitor to see if it has strength enough to push thru the barriers and look towards at least a 38.2 fib retrace of the previous ATH. The levels to look for are coinciding with the ICHI Cloud. With minor profit levels @ 175k and 205K sats in between. Entry levels are either now @ 150k sats area, or with more certainty breaking at least the 50MA and resistance level around @ 156k-160K. Goodluck

No brainer buyWTC hitting support on the 786
Been accumulating for a while
Indicators looking very nice
Entry should be made on a lower time frame. There will be a little pull back so dont miss your chance.
Don't forget to hit the like button or follow me on Trading View for more chart analysis :)

WTC - 2HR CHARTWTC Has previously broken out of the downward trend & seems to be consolidating into an ascending triangle pattern.
Let's see if this isn't a fake break out & we can see it break to the upside again out of the triangle..
I've placed what I believe are 3 targets based on past popular resistance/support zones.
Always keen for feed back.
Thanks


WTC/BTC 4H BreakoutBreakout on the 4H WTC/BTC chart, MA's also crossed bullish?
Breakout on the 4H WTC/USD chart


WTC/BTC Short term price action incoming!BINANCE:WTCBTC is coming to the apex of the descending triangle which found support at the 61.8 @ 0.0013319 sat level. RSI is rising with the MACD heading towards bullish. Strong resistance with the 50/200 EMA just at the downward resistance. If resistance is broken expect a big upward movement towards the 0.0015 sat level. If supports fails look to the 0.0012128 level for next support.

WTCWTC seems to have found support (fib 0.236 and ancient trend line) and usually goes up when BTC is calming down from a big move. Either way, short or long term, this is looking great. I got on WTC today and I'm thinking about riding it all the way up to 0.006. I could be selling earlier (29494) but this a hodl and I'm going to ride it out

Wtc ready to moveReady to move....as long as btc is somewhat stable should pop....going long with tight stop.

WALTON CHAIN: LESS THAN 3 HOURS = 13.639% PROFIT!!!Our "Crypto Scalper" Trade Signal has correctly identified a buy in point on the 17th of April 2018.
Using this buy in point and selling at today's price, you would have expected to net 13.63% PROFIT!!!
The increase in price may also be explained by positive developments including:
1. Rumours that Waltonchain Officially Listed as Alibaba IoT Industry Partner
2. Airdrop of GMN Airdrop completion on the 15th April 2018
3. Integration of Walton Chain with logistics platform on 14th April 2018
Analysis using the Crypto Bull/Bear Signal suggests the move may be in line with a general increase in buying activity mainly as a result of Waltchain's induction into the Alibaba ioT Industry partnership.

WTC breakoutWaltonchain WTC is currently ranked at 53 in CMC,with 25M circulating supply.
WTC reached its all time high in Jan28 and then entered the correction phase.It has a strong support @0.00123 which is the 0.786 fib level.It bounced from this level today and brokeout off the falling wedge.RSI is now in oversold region in 4h timeframe.I'm expecting it to retest the top of the wedge @0.0013-0.00135.Red lines are the targets.Secure your profits at those levels.
Other lines are keylevels for daytrading purpose.I've added an example for such breakouts in comment section.
Recommended buy zone 0.0013-0.0014
Targets
0.00178
0.00245
0.00316
