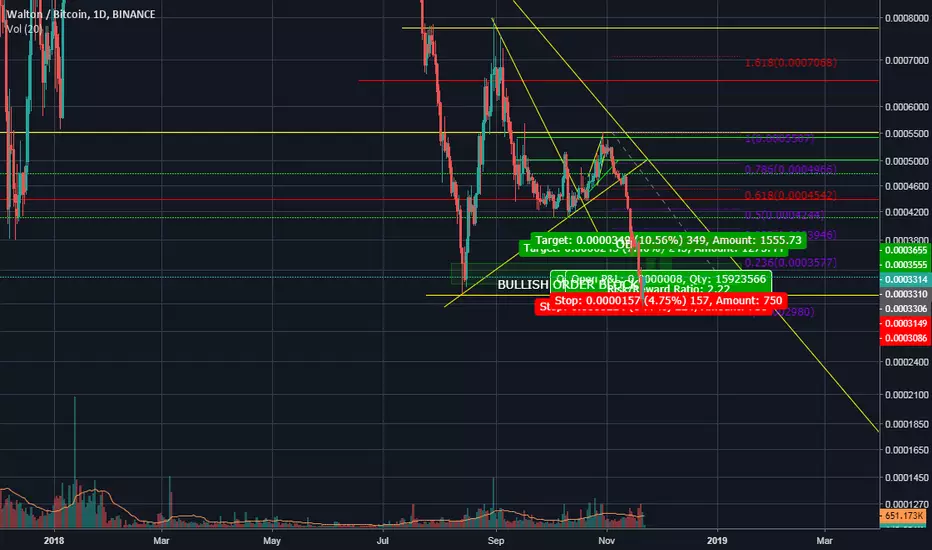
WTC Bullish Flag is ReadyWtc is ready for going up..
Buy and after say to me: "Thank you for call " !!!
WTCBTC trade ideas


WTCBTC long / HTF double bottom bull divLong position considering
- HTF double bottom pattern with bullish div
- 4H close above EMA
- 1H ema retest
Increase position if retest bullish block 1H (low green)
Increase position if break and retest bearish block 1H (high green)
Stop under bullish 1H block
TP on bearish daily blocks (orange)

WTC - My Love/Hate RelationshipWell, well, well. The one coin that I've sold and rebought a number of times due to FUD and my personal annoyance with their marketing efforts. HOWEVER, that doesn't stop this from being a good trade setup. I am at a net loss on this coin, but I added a bunch more at the 39000 satoshi level, after seeing a clear bottom happening on August 13th, 2018. I added a few coins on that day, because it seemed like a great buying opportunity. I also added a bit recently at 49000 with some BATBTC profits.
Since then, WTCBTC seems to have formed a "classic" Adam & Eve double bottom. The Adam (pointy) bottom had a huge rejection, that took it all the way up to 80K sats, only to lose steam and form a more rounded (Eve) bottom. Looking at the chart we have today, it seems like WTCBTC just bounced off its short term uptrend line. RSI still seems a little high though, so our bottoming could extend for a bit longer. If we hold above 50000, we should see a move up from here. If not, as I said, the bottom will extend further, and there may be another buying opportunity near strong support at 41000. These scenarios are shown in Orange and Maroon.
Another thing to note is that there was a lot of coordinated FUD on this coin recently. Since the FUD abated, the coin has been on a steady rise. Doesn't seem like a coincidence to me. Anyway...
BUY Targets:
41000-42000
49000-52000 (STOP LOSS below 49000)
SELL Targets:
80000
100000
150000 - Will likely redistribute my portfolio a bit here, if it makes it.
All time High+
This is not investment advice, nor am I a qualified professional financial advisor. This is just another one of my long term setups, for personal use, and for people to follow along with the trade.
-Victor Cobra

Daily Bullish Signal $WTC #WTC WTC/BTC (12 November)BLUE ARROW indicates the EXPECTED Time and Targets
Contact me if you need help


Waltonchain WTC Potential break thruOn this 1 Hour chart we can clearly see sideways movement for Waltonchain Token, from 09:00 on 7th November this morning the Volume was around 62K, when now (00:30), at the current moment we have a Volume of less than 4K. Two hours later at around 11:00 it hit the minimum expected Top around - 0.0004840 as the Bollinger bands indicates. From there on, until the current moment, as already mentioned we are in a Sideways movement.
Let's take a look at some more details that give me the positive feeling of an Uptrend coming in those 2/3 days.
RSI is currently sitting around 46-47 levels and that's going around from the moment, when we had the maximum Volume for the day (09:00 - 62K - Volume)Buyers couldn't break thru the indicated Resistance 1 line - around 0.0004855, but also Sellers couldn't break the Support 1 line - around 0.0004740.
MACD interestingly forming an uptrend movement, coming to the moment where the 2 averages will make an X and with a bit more volume will break UP as I am expecting to happen in the following days.
My feelings is that positively we can see a minimal break at Resistance 1 line - around 0.0004855
Next level would be Resistance 2 line - around 0.0004940
With a lot of Volume and a green market why not Resistance 3 - around 0.0005050
This analysis is created on a short term basis, analysis could go this scenario in the coming 3 days.
This is not a financial advice or any kind of financial advice.


WaltonChain is a Solid Future GrabSo, many individuals have asked me to assess Waltonchain’s price action over the last few days due to increasing interest in the chain and its idea.
For this price analysis, we’re going to look at the WTC/BTC pairing, specifically.
Over the last 7 days, in particular, the price for $WTC has been getting throttled:
As one can see above, Waltonchain has been seriously shedding against Bitcoin over the past few periods on the H4.
Now, when we draw our connecting trendline going upward, we can see there’s an opportunity for a potential bounce coming up.
What Bounce?
Check it out:
Here’s what could happen if the ‘bounce’ fulfills itself against that trendline:
ZN Reversion Ribbon V2
Based on what can be seen above, a entry position (on a long), does not appear advisable until we can see convergence on the Zerononcense Reversion Ribbon V2 (i.e., the Histogram reflecting bars of decreasing length over time.
Bounce Could Potentially Provide Righteous Gains
Conclusion
Here’s the anticipated price action for the WTC/BTC pairing :

#WaltonChain $WTC - Anticipating a breakout - Long 25-42.5%#WaltonChain $WTC - Anticipating a breakout - Long 25-42.5% Profit
Be patient, build your position in parts to maximize profits
I've been in $WTC for a bit, but here is a trade I'm taking (adding to my position)
A good amount of large caps have been doing well recently & are starting to look like they wanna play a bit
Buy zone 46.5-48.5k sats
TP marks: 61, 65, & 69k sats
Stop (if you want) 0.0004645 $BTC

Walton Revised 1.I was probably too generous with the previous SL. Moved the SL a little higher, to the 21 EMA on 1D chart, which is around 4,9 - 4,85k Sats. The new SL aligns also with the 200 EMA on 4h.
4h:
Last time I forgot to look at the Fibs, 0.618 Fib is another confluence for the 4,9k price zone, imho.

WTC run from here or a pull back first? WTC has found support but needs to pull back on the daily. It could run from here or it could pull back first and then go on a new daily momentum swing, making a small entry here and will add if it takes off.
If not I will wait to enter the rest of the position and average down with the daily momentum dump on Sto RSI.

WaltonCoin - Cup & Handle formationTA Practice - ONLY
Still relatively new to trading and I use this platform for my personal predictions - yes, I am entering this trade.
That said, as you can tell by my previous posts, I am often off the mark with these predictions! So, please don't consider this trading advice by any means. If you do manage to stumble upon it while looking into WTC I would love to hear some feedback.

$WTC long.most fucked up market.. strangest ihs (which actually isnt even one but would fit if we reach 100k lmao) ever seen.. flying a&e? vol rising.. would need to catch up at +65k and hold to see 100k shortterm. kumo would fit with resistance but cloud is still too big at the end in my mind. if breakout goes back then 43k-50k is a nice accumulation zone.


WTC going out of the boxWTC going out of congestion zone with two bullish green trend candle. Waiting for pullback to support and then go long.


WTC/BTC potential around 1500% profitI love this coin, last year he gave a bunch of profit! I do not know how he will achieve this goal, but he will go to her.
Now we are seeing a classic and rather strong reversal pattern.
ITS NOT financial advice!


Bitcoin: WTCBTC tradeBitcoin Walton, Some messy ass chart but it makes sense to me
Buy in Approx 4940 sats
Sell 6061
SL 4690

Walton Ramping UpSo far it resembles an A&E, but according to books it isn't perfect or very likely isn't even a A&E bottom. Nonetheless, WTC seems to be ramping up. A break and confirmation above 6,9k or 7,9k Sats would make me really bullish. Bearish or neutral if we go below 4,7k again.
+ 1D RSI is above the bearish zone and closer to the bullish area
+ smaller TFs show that most of high volume was on green/white candles
+ 1D is above 55 EMA(blue line) (but the last daily closed as a shooting star or iHammer whatever)
- both Stochs on 1D point to more possible downside, hope 55EMA holds as support
- last daily close, 30th Oct, more bearish than bullish
- bear div on the 12h
