GOLD fallingThe correction of the price of gold had certain complications and so far the most correct thing that came to my mind is this analysis.
XAUUSDG trade ideas

Gold Analysis 18/06:24Economic Data Impact
Retail Sales Data:
Positive retail sales data typically strengthens the USD, which may put pressure on gold prices.
If retail sales come in as expected or higher (0.3% for Retail Sales m/m, 0.2% for Core Retail Sales m/m), gold may experience a downward move towards the lower Fibonacci levels.
Conversely, lower-than-expected retail sales would weaken the USD, potentially pushing gold prices upwards.
Industrial Production Data:
Positive industrial production data (expected 0.3%) would support a stronger USD, likely leading to downward pressure on gold.
FOMC Statement:
Hawkish FOMC statements (indicative of higher interest rates) generally lead to a stronger USD and lower gold prices.
Dovish statements would support gold prices due to lower interest rate expectations.
Possible Scenarios
Bullish Scenario:
Retail sales data comes in lower than expected.
Industrial production data is weaker than expected.
Gold could break above the triangle, targeting 2344.847, 2350.692, and possibly 2353.934.
Bearish Scenario:
Retail sales and industrial production data come in as expected or higher.
Gold could break below the triangle, targeting 2281.292, 2271.899, and possibly 2266.690.
Conclusion
Monitoring the retail sales and industrial production data is crucial. A breakout above or below the symmetrical triangle, confirmed by the economic data, will dictate the next significant move for gold.
My opinion For gold im short for the shortterm Atm till we see the data

XAU/USD 17-21 June 2024 Weekly AnalysisWeekly Analysis:
Analysis/Bias remain the same as last week's analysis dated 09 June 2024
-> Swing: Bullish.
-> Internal: Bullish.
Price printed a bullish internal iBOS followed by a bullish swing BOS
Most likely scenario would be for price to pull back following bullish internal and swing BOS (Break Of Structure)
First structural indication, but not confirmation that pullback has initiated would be for price to print a bearish CHoCH which is denoted by a blue vertical dotted line.
Last week's expectation dated 02 June 2024 was for price to pullback following swing and internal pullback and print a bearish CHoCH.
The forthcoming week's expectation is for price to print a bearish CHoCH to indicate, but not confirm bearish pullback.
Weekly Chart:
Daily Analysis:
Analysis/Bias remain the same as last week's analysis dated 09 June 2024
-> Swing: Bullish.
-> Internal: Bullish.
Price has printed a bullish swing BOS. Swing low confirmed and adjusted with swing high yet to be established.
Due to the news on 7 June 2024 whereby China halted reserves buying, Gold sold off, however, from a technical analysis perspective swing and internal structure remains bullish and we are in a Weekly and Daily pullback phase, which has been assisted by the news.
Expectation is for price to continue bearish, react at discount of internal or swing 50% EQ (swing is marked in black, internal is marked in blue) before targeting weak internal high which is denoted with a blue dashed line.
It would not be unrealistic if price continued bearish to the internal or swing low, react at daily demand level before targeting weak internal high.
Daily Chart:
H4 Analysis:
-> Swing: Bullish.
-> Internal: Bearish.
Price traded to the downside, however, price was unable to breach and close below weak internal low where we saw a reaction at a H4 demand level.
Nonetheless, internal structure remains bearish, therefore, price should technically target weak internal low.
Price could potentially continue to trade bullish, react at either premium of 50% EQ or H4 supply level before targeting weak internal low.
Strong swing low is expected to hold, however, it would be worth noting the swing low must be taken as the weekly and daily TF's are both in pullback phase.
Intraday expectation: Price to continue bullish, react at premium of 50% EQ or H4 POI before targeting weak internal low.
H4 Chart:

Gold bulls still need to wait for the right opportunity, maintai**Last Week Review:**
Last week experienced CPI and FOMC economic expectations, and the weekly plan was realized. After the CPI announcement, the market reached 2337 before the U.S. session opened, defining the week's movement as complete. The subsequent market retraced to 2298, showing a slightly bullish pattern, and tested the 2337 level again on Friday.
(Personally, I found last week's market movements very interesting and worth reviewing.)
**This Week's Plan:**
1. Resistance at 2348. If 2337 is broken, the target is 2348, which presents a clear profit point.
2. Support levels are at 2282 and 2260.
3. Monday's intraday plan for the European and U.S. sessions: Monitor the breakout of Friday's narrow range, 2324 to 2335 (very close to 2337).
**Personal Judgment:**
- Gold still has upward momentum at the beginning of the week. The U.S. dollar is expected to peak and retreat after reaching 105.8.
- If 2348 is broken and continues to rise, monitor whether 2348 becomes a peak. A short position can be considered, with a stop loss set at the intraday high (not more than 5 to 8 dollars).
**Special Situation:**
- If 2348 peaks and falls back to 2260, this range might scare off bulls. Looking back at June 7th, the fluctuation was also within this range. Risk-tolerant investors can hold a small position on the left side.
- 2260, 2220, and 2188 (extreme position) are good cost levels for holding positions.
**Related Products:**
- Continuously monitor the trends of gold, the U.S. dollar, and U.S. Treasury yields. Last week, there was a significant difference between the trends of the U.S. dollar and Treasury yields, with the dollar rising and yields falling. Pay attention to whether this situation will correct; otherwise, gold will be difficult to trade.

Reasonably by the end of June 2024The targets are clear and all of them will be seen.
Third week: Visiting the 2410 area.
Fourth week and end of the month: Revisiting the 2350 area.
Good luck

Will test 2180 confirmed 200 days moving average Gold now in Validation Setup , it will continue to fall further downward , it will test 200 ema before continuing upward direction many reasons can be seen as transaction never completed without retrace

The best gold analysis and trading signals.Technical analysis of gold: Gold broke through the triangle convergence range in the morning yesterday. We then gave a bullish view on the retracement. The market also gave the retracement level as expected, and the big sun pulled up to 2365 and then fell back. It is currently trading around 60. Since the market broke upward, we will focus on the continuation of the bulls today. The upper resistance refers to the previous diving position of 2387. The lower support will focus on the upper high point of 2345 yesterday morning. This position is also the second highest point after breaking the triangle. At present, it is obvious that the watershed between strength and weakness is at the 2350 line. After breaking through this point yesterday, it accelerated to rebound by more than 15 points. After the second retracement in the US market, it rose again. This point is also the first time we consider the opportunity to fall back and take more opportunities today. In addition, the focus below is on the high point of 2345 that was hit many times in the white market yesterday. The intraday long position is based on this point as a defense. Today, Friday, we also need to be careful to prevent profit-taking in the market. Once it falls below 2344, we should be cautious to take more within the day. The white market has touched the 2365 line twice and started to fall back. If it breaks through this point again in the evening, it is very likely to continue to rise to 2375 or 2380.
At the hourly level, gold continued to strengthen after breaking through the upper line of the triangle range yesterday. The price broke through two downward trend lines in succession. The K-line rose continuously and went up against the upper rail of the Bollinger Band. The short-term trend showed an obvious upward trend. Today, gold continued to be bullish. Last night, gold hit the 2365 line and was blocked and fell back. There was a certain pressure on the previous top and bottom conversion position of 2365. Another K-line ran strongly above the upper rail, which was not conducive to the continued rebound of the bulls. Therefore, it is not easy to chase the high position in operation. Wait until the market falls back and stabilizes the support level. If it retreats first today, we will go long near 2345 and look up. The upper target is near 2365. If the upward trend is strong, we can continue to look up to the next resistance level near 2387. If the market continues to rise first, we will go short near 2378 and look down. The first target is also near 2362. If it breaks, it can be seen near the support level of 2345. Finally, whether it is long or short, if the market is at a high level during the US session, then we have a wave of short orders. On the whole, today's short-term operation strategy for gold is to short on rebound and long on pullback. The short-term focus on the upper side is the 2365-2367 line of resistance, and the short-term focus on the lower side is the 2345-2350 line of support.
Strategy 1: Short gold in batches when it rebounds to around 2365-2368, stop loss 6 points, target around 2355-2350, break to 2345
Strategy 2: Long gold in batches when it pulls back to around 2345-2350, stop loss 6 points, target around 2360-2365, break to 2368;

XAUUSD Potential Resistance Breakout At $2341.50 20.06.2024XAUUSD Potential Resistance Breakout at $2341.50 on the 30-minute chart.
Upside Targets: If breakout holds, potential targets are $2356.10 and $2374.66.
Downside Risk: If breakout fails, potential targets are $2330.02 and $2321.01.
Apply risk management
Risk Warning: Trading in CFDs is highly speculative and carries a high level of risk. It is possible to lose all of your invested capital. These products may not be suitable for everyone, and you should ensure that you fully understand the risks taking into consideration your investment objectives, level of experience, personal circumstances as well as personal resources. Speculate only with funds that you can afford to lose. Seek independent advice if necessary. Please refer to our Risk Disclosure.
BDSwiss is a trading name of BDS Markets and BDS Ltd.
BDS Markets is a company incorporated under the laws of the Republic of Mauritius and is authorized and regulated by the Financial Services Commission of Mauritius ( FSC ) under license number C116016172, address: 6th Floor, Tower 1, Nexteracom Building 72201 Ebene.
BDS Ltd is authorized and regulated by the Financial Services Authority Seychelles (FSA) under license number SD047, address: Suite 3, Global Village, Jivan’s Complex, Mont Fleuri, Mahe, Seychelles. Payment transactions are managed by BDS Markets (Registration number: 143350)
Disclaimer

XAUUSD PLAN 6/19🏆XAUUSD PLAN 6/19
Support: 2325 - 2308 - 2300 - 2291 - 2286 - 2280- 2274
Resistance: 2338 - 2345 - 2350 -2365
🔴SELL ZONE 2348 - 2350 stoploss 2353
🔴SELL ZONE 2364 - 2366 stoploss 2369
🟢BUY ZONE 2306 - 2304 stoploss 2301
🟢BUY ZONE 2300 - 2298 stoploss 2295
Scalping strategies will be taken until the resistance - support zones above have an entry signal.‼️
Note: TP, SL are full to be safe and win the market.

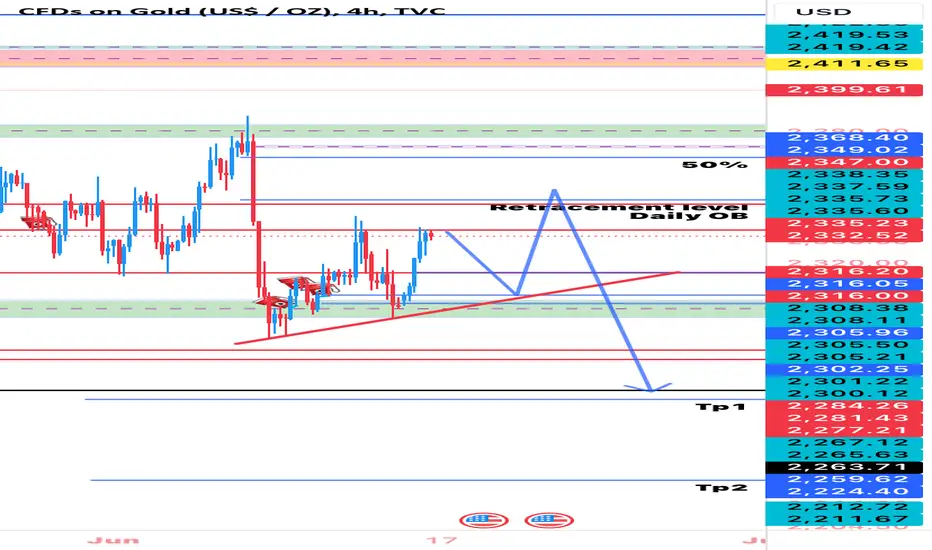
Long sell comingGold will retrace to the line of the trend downside and then bounce from there to upside long reaching retracement area and daily OB as shown on the chart .
XAUUSD market structure analysis on 4 hour, 15 minute time frame4H swing is bullish
1H swing is bearish.
Current price is in the demand zone of the 4-Hour Timeframe.
We can look for a buying opportunity when the 5-Minute Timeframe gives a reversal signal CHoCH

XAU / USD 30 Minute ChartHello traders. I wanted to do a quick post showing my area of interest on the 30 minute chart. As I am writing this, I just saw that today is a bank holiday here in the USA.. Saying that, I will not be range trading today. Let's see how the next 4 hour candle goes. Big G gets a shout out. Trade the trend and be well. With no trading this morning, a wake and bake is certainly in order. Thanks so much.

Gold Bull side 2340Hey there on 1hTF the Gold has looking for upwards from 2323
If breakout 2323 and continue moving downside then we can expect 2312
On Tuesday we had saw the 2306 and upside 2333
So we expect today above 2341
And the resistance level still 2360 so wait for the breakout sessions will be see today

Xauusd long setupXauusd has a strong resistance at 2340 key level. It has to break 2340 for a proper uptrend. 2330 to 2340 is a no trade range so avoid opening positions between these prices.
Enter buy position @ 2340 after retesting and tps are given on chart sl 2330 or according to your risk .

GOLD - Major TopI was expecting Gold to rally until year-end and top around ~2800 but the hard fib reaction @ ~2500 dropping ~5% and also the look of silver chart, along with momentum divergences argues for a major top right here. At the least, a good level to empty your bags here, if not outright short.
TVC:GOLD

GOLD OUTLOOKMy expectation on Gold next Week.
What are you thoughts?
Share them in the comments section.

GOLD / USD * CFDs * H4 * EWP FIBO TC analysisGOLD / USD * Futures * 4 Hour Elliott Wave Principle Fibonacci Trend-Channel analysis

Gold continuing bearish momentumGold is fundamentally bullish and has broken through its latest resistance. Planning buy limit on retracement back to the previous resistance which may turn into a good support for further push upward.
Buy Limit
EP : 2345
SL : 2334
TP1 : 2356
TP2 : 2367


gold long tradelets see this movement on gold, we hope for the long run.Everything depends on the news...

XAUUSD - SELL
Looking very Bearish for some reason
Most probably got to do with Bonds or Yields or some polava
But i sayn it's just a reversal to next order block below
Yes News Events do drive markets but not when there is
no news just profit taking
This is what one needs to know when Trading
Lets see : )

XAUUSDI highly doubt the gold is going down from here before reaching key level above ( old high ) .
let see if it break above 2342, if it breaks , then it will drive up to 2362 before getting a direction.

$XAU - Megaphone Pattern on dailyTVC:XAU - Glod Spot
Re-accumulating inside a Megaphone pattern on daily.
We are going above $2500 for sure
