My view on BTCMy view on BTC in the following 4-12 weeks. We might see the new ATH at the end of July.
XBTUSD.P trade ideas

Bitcoin (BTC) Price Resurgence, Binance Coin (BNB) Hits a New HThe price of the primary cryptocurrency has been on an uptrend in the past few days, rising to as high as $71,700 on June 5. Currently, it hovers the $71,000 mark (per CoinGecko’s data), representing an 11% increase on a monthly scale.
The resurgence coincided with record figures related to spot Bitcoin ETFs in the USA. Those products witnessed a total inflow of almost $900 million yesterday, the second-best day since their approval in January.
Numerous analysts believe BTC could soar even higher in the near future, assuming certain factors are in place. The X user, Captain Faibik, predicted a rise above $90,000 should the asset surpass the “crucial resistance level” of $71,300.
On the other hand, Ali Martinez assumed that a pullback is not out of the cards based on the TD sequential, which presents a sell signal on the four-hour chart. This technical analysis tool identifies potential price exhaustion points in the market and indicates when a trend is likely to reverse.
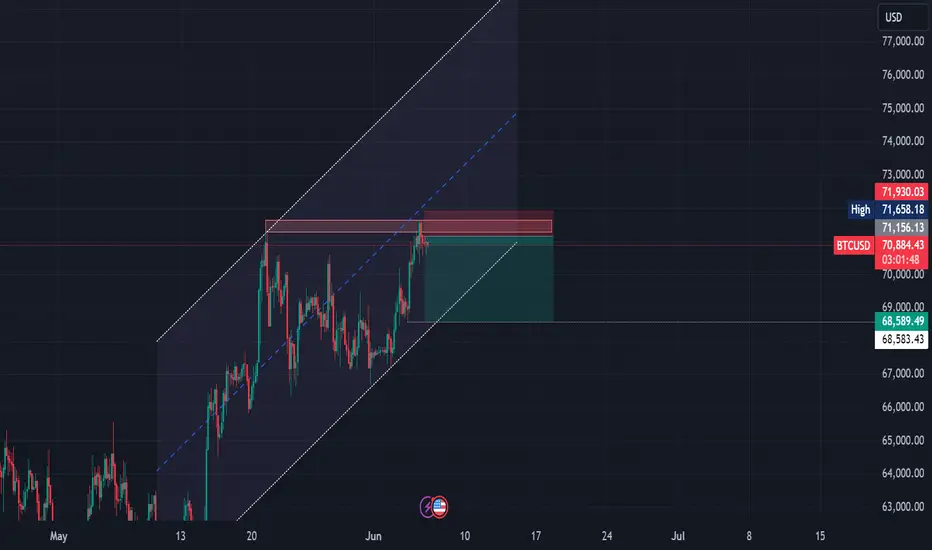
BTC Long PositionBTC has currently been following Dow Theory as successive HH,HL are being formed.
My opinion is to take a long position if today's candle closes above yesterday's candle (69289.67)
My trade plan is visible in the chart. 2 Entries can be taken. 1st: when it closes above 69289.67 price.
2nd: when Resistance 2 is broken (71317.10)
Good Luck!!

BTC | Bitcoin key levels | btcusdt Daily/Weekly/Monthly/YearlyBTC | Bitcoin key levels | btcusdt
Daily to Yearly Support levels
BINANCE:BTCUSD

BTC HIDDEN BULLISH DIVERGENCE A quick way to discover whales volume. This works just like RSI but by using my two volume plots.
Plots showing hence of weakness however what you see happening, when we pair the price action and when we pair this plots volume together, we get divergence.
This is specifically HIDDEN DIVERGENCE. Hidden divergence is coming from a LOW to a LOWER LOW and price; a LOW to a HIGHER LOW in price.
This is HIDDEN DIVERGENCE.
We see opposites happening in price with my 2 plots explaining the hidden divergence.
Here’s our warning. Is this BULLISH or BEARISH?
Let’s unveil it. This is called HIDDEN BULLISH DIVERGENCE.
Now we have two volatility contractions means wants to start a BULL RUN.

BTC LONGMy guess is that BTC will go up on Monday / Tuesday. Like all i could be wrong but this is what i think. Two scenarios and if we go down i do not expect going down more then to 67k. If we go up we will test 72k again. My bet is on 72k since a lot f btc are being bought OTC and on coinbase paper trading.. Short are at all time high so i would like to see them get liquidated.

BTCUSDT continues to conquer the record!On Tuesday, Bitcoin (BTC) traded around $70,400 following significant insights from Glassnode. These insights suggest that the largest digital asset is poised for increased volatility, potentially hitting new all-time highs in the coming days. With record levels on the horizon, Bitcoin's journey to new heights appears imminent and thrilling.

Bitcoin to $431,936 according to historic moves Historical Patterns:
2017 Halving to Top: From the halving in mid-2016 to the peak in December 2017, Bitcoin saw significant price appreciation within a 1.5-year period.
2021 Halving to Top: Similarly, from the halving in mid-2020 to the peak in late 2021, Bitcoin followed a comparable pattern, also over approximately 1.5 years.
Projected Future Targets:
2021 Equivalent Move Target Price: Based on the move from the 2020 halving to the 2021 peak, the projection for October 2025 is approximately $431,936.
2017 Equivalent Move Target Price: Following the 2016-2017 pattern, the projection for September 2025 is approximately $2,081,964.
Trend Channels and Price Targets:
Ascending Channel: The price is trending within an ascending channel marked by parallel white and red lines, indicating strong upward momentum over the long term.

Looking for wave 4 on BitcoinWatching for wave 4 here on Bitcoin.
Could pull back to 50k
Stay safe and stay profitable.
- Dalin Anderson

Clear bullish trend and signsAlthough we could see a draw back to arnd 65k support, btc will see ATH's soon. I predict the end of this bullish cycle arnd 105-115k.
Cup&handle formed.
No advice, just my believe/interpretation.
Due to the power of big players we could see manufactured dips, I'll consider these as false.

BITCOIN SWING SHORT|
✅BITCOIN is approaching a supply level of just below 74,000$
So according to our strategy
We will be looking for the signs of the reversal in the trend
To jump onto the bearish bandwagon just on time to get the best
Risk reward ratio for us
SHORT🔥
✅Like and subscribe to never miss a new idea!✅

BITCOIN BULLISH MOMENTUM!! GOING UP TO $90K - $100KBitcoin has been rejected five times in this value area, but the resistance is getting weaker, hinting at a potential bullish breakout. This isn't a bad area to assume that this dip might be worth buying.
There's a potential for the trend to continue along the trendline at the 13 and 21 daily moving averages, getting close to the bullish order block area on the weekly chart.
Looking at the technical analysis, this chart shows a strong possibility of reaching $90K - $100K. Additionally, the inflow from big institutions like BlackRock, Fidelity, and others adds to this potential. Let's see. 🥂

BTCUSD/ No signs of bullishness on Lower/ higher time framesBTCUSD has complete retest of wave 5 thrice on higher time frame , Or the ATH has been been attempted to retest but failed. On lower TFs no sign of bulls either. Should it continue 66k or lower? D waves system is a private research and is used for recognizing correct dynamics. This is not financial advice.


Be on the lookout possibilities 5 min double top; yellow horizontal 1% and 1.5% ratio has been completed. White horizontal 2.30% might get filled.
Three smart money bullish trendlines means uptrend. One of the top green trendlines reads $70,400 when setting it to volume chart. When using Heiken Ashi reads different price.
Double top Heiken Ashi reads almost the same at $70,400 with smart money trendline when switching chart to volume.
Newest most updated trendline smart money created is at the bottom at $69,890.
We’ve seen in the past what’s happened. Smart money utilizes them as guidance for themselves.
We also see 3 double top as another possible scenario by completing its course before the next move. 3 double top reads to tao one of the bottom target prices.

BTC update in H4 chart Hello
There is nothing more to say about BTC and please check lest ideas. This is just an update for its new wave counting
Thanks


+4R Textbook trade breakdown☝️Do not act based on my analysis, do your own research!!
The main purpose of my resources is free, actionable education for anyone who wants to learn trading and improve mental and technical trading skills. Learn from hundreds of videos and the real story of a particular trader, with all the mistakes and pain on the way to consistency. I'm always glad to discuss and answer questions. 🙌
☝️ALL ideas and videos here are for sharing my experience purposes only, not financial advice, NOT A SIGNAL. YOUR TRADES ARE YOUR COMPLETE RESPONSIBILITY. Everything here should be treated as a simulated, educational environment. Important disclaimer - this idea is just a possibility and my extremely subjective opinion. Do not act based on my analysis, do your own research!!

Bitcoin Formed a Triple TopBitcoin today is forming a triple top after consolidating days on this price before NFP and UR.
UR comes higher than expected making the market crash in minutes.
My conclusion it is that market will keep moving to the downside after this shift on the Labour Market

BITCOINBITCOIN
Tendency the price is a long pressure in between 70,475 and 70,079
Turning level : The turning level between 70,475 and 70,079 , so as long as the price above this level, there will be a bullish trend
resistance level : trade above turning level between 70,475 and 70,079 , the price will rise to 71,364, as long as price stabilize this level, will be reach a new peak
support level : braking a turning level 70.079 the price will reach the support level of 68.375 and 67,445
corrective level : price will attempt between 70,475 and 70,079 , correct itself before long, after makes a new peaks


$70,000 continues to be an obstacle for BitcoinYesterday, Bitcoin again tested the resistance near $70,000 but failed. After soaring to $70,258, it quickly dropped below $69,000, where it currently trades. Overall, not much has changed from a technical perspective since our previous update; merely the sideways trend of a lesser degree became more apparent, with Bitcoin struggling at the $70,000 mark. As such, our focus continues to lie at this point, along with the two sloped channels shown below.
Illustration 1.01
The daily chart of Bitcoin (BTCUSD) above shows the descending channel, with its upper bound acting as an important resistance for the price. To support a bullish case in the short term, it would be ideal for Bitcoin to close above the resistance level for multiple consecutive days; the resistance’s importance grows with each retest.
Illustration 1.02
The image above shows the ascending channel within the larger descending channel; its lower bound acts as a resistance.
Illustration 1.03
The illustration above displays an alternative trendline on Bitcoin's (BTCUSD) daily graph, which acts as critical support for the price.
Technical conditions
Daily time frame = Neutral
Weekly time frame = Bullish (losing momentum)
Monthly time frame = Bullish
Bitcoin addresses
Initially, the number of Bitcoin addresses with balances exceeding 1,000 BTC increased slightly after the big slump we described on 29th May 2024. However, while this figure is still above its 28th May 2024 level, it resumed a decline in a new month, which is not a particularly positive sign. The same trend can be observed among the addresses with balances exceeding 100 BTC.
Please feel free to express your ideas and thoughts in the comment section.
DISCLAIMER: This analysis is not intended to encourage any buying or selling of any particular securities. Furthermore, it should not serve as a basis for taking any trade action by an individual investor or any other entity. Your own due diligence is highly advised before entering a trade.
