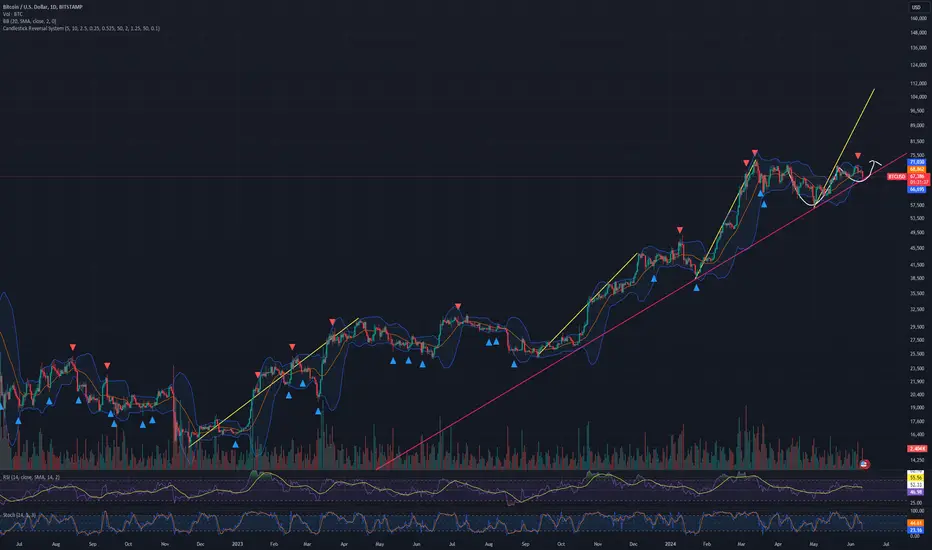
BITCOIN - BULLISH MOVE Hello Traders !
Previously, The BTC Price formed a descending triangle pattern.
Currently, The resistance line is broken !
So, I expect a bullish move📈
___________
TARGET: 71050🎯
XBTUSD.P trade ideas

BITCOIN Retesting the 1D MA50. Is it alarming?Bitcoin (BTCUSD) has been practically consolidating since the May 21 High and the recent pull-back of the past 5 days is starting to inflict a certain degree of fear in the market again. So far the effect is only on the short-term as yesterday, the 1D MA50 (blue trend-line) was tested (first time since May 17) and held.
This is something we have seen before on February 06 2024 and October 14 2023. All 1D MA50 re-testings have taken place after the price broke below the 1D MA50 (blue arc) and formed the bottom of the Bearish Leg. The pattern can be easily classified into phases, with BTC trading within the Mayer Multiple Bands (MMB) Mean and the MMB 2SD below. A Channel Up follows after each 1D MA50 test that approaches the MMB.
The only parameter that's left to confirm the start of this (blue) Channel Up that will test the MMB is the 1W RSI to break above its MA level (yellow trend-line). As you can see 100k following that, is a rather conservative technical Target within this pattern.
Do you think that critical psychological level will get hit following this pattern? Feel free to let us know in the comments section below!
-------------------------------------------------------------------------------
** Please LIKE 👍, FOLLOW ✅, SHARE 🙌 and COMMENT ✍ if you enjoy this idea! Also share your ideas and charts in the comments section below! This is best way to keep it relevant, support us, keep the content here free and allow the idea to reach as many people as possible. **
-------------------------------------------------------------------------------
💸💸💸💸💸💸
👇 👇 👇 👇 👇 👇

BITCOIN - BEARISH DOUBLE TOPHello Traders !
The Bitcoin Price formed a new double top pattern.
At the moment, Th neckline is broken !
The support line is also broken !
So, I predict a bearish move📉
_________
TARGET: 62050.00🎯

BITCOIN Underlying trend-line coming into play.Bitcoin (BTCUSD) has been holding so far the 1D MA50 (blue trend-line) as Support, which was the primary objective, closing all 1D candles since Friday above it, but now an underlying trend-line is coming to center stage as it got tested also on Friday successfully.
That is the Lower Highs trend-line that started on the March 13 High and rejected BTC on Lower Highs initially, before transitioning to a Lower Lows Support on May 23. If that holds, the chances of a rebound towards the Resistance Zone, are amplified greatly. Practically, as long as the 1D MA50 holds, a bullish signal will emerge when the price breaks above the 4H MA50 (red trend-line), in which case we have a target at 72000 (bottom of Resistance Zone).
If on the other hand BTC closes a 1D candle below the underlying trend-line, prepare for 61000 (top of Support Zone) and potentially a long-term bottom formation on the 1D MA200 (orange trend-line).
Notice that on the previous Bearish Leg (April 08 - May 01) of this 3-month consolidation structure, the price remained bearish as long as it stayed below the 1D MA50. The 4H MA50 never broke to the upside while the price was above the 1D MA50. That is why it will be a bullish signal if it breaks while BTC is above the 1D MA50.
But what do you think will happen next on the short-term? Will we see 72k or 61k first? Feel free to let us know in the comments section below!
-------------------------------------------------------------------------------
** Please LIKE 👍, FOLLOW ✅, SHARE 🙌 and COMMENT ✍ if you enjoy this idea! Also share your ideas and charts in the comments section below! This is best way to keep it relevant, support us, keep the content here free and allow the idea to reach as many people as possible. **
-------------------------------------------------------------------------------
💸💸💸💸💸💸
👇 👇 👇 👇 👇 👇

Strategic Bitcoin Long Positions Amid Market FluctuationsHi everyone, so we had the dip, Bitcoin is lower, it came close to the 64,800 which was big support after the 66,200 was lost. But this is an entry for me, and I've been trying every step of the way to find support to go long.
You see, once you pick a direction, it's better to keep your direction, and if you're long, stick to long positions. We've attempted many long positions, and while some went into the middle, they provided opportunities to secure some profit or at least move the stop loss at entry. This could be the big one, and the targets I see are 67,000 and 68,700, which is the top of the channel, and then 71,860, which will be the third attempt.
We got rejected twice at that level, first in May and then on the 7th of June. I expect the third and crucial attempt to happen sometime this month. If that level is breached on the third attempt, we could skyrocket to 79,000 and even 80,600.
Nobody said it's easy, guys. Unlike last year when we bought from 16,000-18,000 and everything went well, we now have to navigate through more complex conditions. Although the Feds haven't cut rates yet, we have eased inflation and the Ethereum ETFs coming up, providing good reasons to expect Bitcoin to go back up higher.
The Nasdaq is at a new all-time high, and Bitcoin should follow. So I'll stick to the main structure and keep buying. If Bitcoin starts an epic rebound today, we could be heading towards 95,000.
Again: There is support now (very close) at 65,300, which was lost and regained very quickly, making it a trade with the stop loss just below that. In the worst-case scenario, 64,800 is still support.
I'm long here, and once you pick a direction, stick to it. It might be tiring, but it's essential to stay alive and be able to trade again. Spot trading is different, but for leverage trading, have a daily limit or budget in bullets. When the market fails but you see support or a good entry, buy in again and fight. We never die; we never go down, and we stick to one direction. It does work, and the analysis says Bitcoin long. That's what we do.
One Love,
The FXPROFESSOR 💙

BITCOIN - IT'S OVER, WE'RE GOING TO ZERO, AS ALWAYS - CM101BITCOIN / USD TA
Just a quick post for the Bitcoin vs USD TA. We see that we are falling upside down head and shoulders here... question is... do we stop here or do we need completion at $60,000? This is a very real possibility. Holders, have little to nothing to be concerned about while if you're a trader, you're risking an additional 7%-10% of downside.
We know that his area is where ALTS usually perform at so July - September will be quite interesting to observe.

BITCOIN Keep this scenario at the back of your mind.Bitcoin (BTCUSD) requires at all times that we are openminded to all possibilities and not just one. This suggests that we need to be prepared for scenarios that often go against the trend, the majority of opinions and momentum (whether euphoric or panic).
Along those lines, we present you today a medium-term pattern that is possible and even though it doesn't contradict the long-term trend (which is bullish), it does go against the short-term general market euphoria of recent days.
As you can see, within the dominant Channel Up since December 2022, BTC had its first major 'correction' through a Rectangle, which has basically been an accumulation pattern. The price found Support, formed a bottom and start rising again after it broke below the MA50 (blue trend-line) and just before it tested the MA100 (green trend-line).
If we experience the same kind of accumulation again, then BTC is currently on a 'hammer' rejection level similar to July 12 2023. Even the RSI patterns among the two fractals are similar. This indicates that the Buy Zone will be within the MA50 and the bottom of the (green) Rectangle.
But what do you think? Will this 'unpopular opinion' be materialized? Feel free to let us know in the comments section below!
-------------------------------------------------------------------------------
** Please LIKE 👍, FOLLOW ✅, SHARE 🙌 and COMMENT ✍ if you enjoy this idea! Also share your ideas and charts in the comments section below! This is best way to keep it relevant, support us, keep the content here free and allow the idea to reach as many people as possible. **
-------------------------------------------------------------------------------
💸💸💸💸💸💸
👇 👇 👇 👇 👇 👇

Is Bitcoin Preparing for a Bull Run? Hello, dear friends!💙 Bitcoin has started to show a decline in price, even though other markets are experiencing growth.
Despite the current price decline, Bitcoin's behavior closely mirrors the patterns observed before previous bull runs. Analyzing historical data, we can see that Bitcoin often undergoes a phase of consolidation and accumulation before significant upward movements. This phase is characterized by narrowing price ranges and reduced volatility, often forming technical patterns like triangles or flags on the charts.
One of the key indicators suggesting a potential bull run is the breakout from these consolidation patterns. In the past, when Bitcoin has broken out of a well-defined triangle or flag pattern, it has often led to substantial price increases. Currently, we are observing similar behavior, where Bitcoin appears to be consolidating and forming a base of support. This base-building is crucial as it allows for the accumulation of buying pressure, which can propel prices higher when a breakout occurs.
It's important to acknowledge that Bitcoin's current decline could be part of the larger consolidation phase, potentially shaking out weak hands and setting the stage for a more robust recovery. Such pullbacks are not uncommon and can often precede stronger bullish momentum as the market stabilizes and regains confidence.
Moreover, market sentiment and external factors play a crucial role in the development of a bull run. Positive news, regulatory clarity, or institutional adoption can act as catalysts, driving investor confidence and increasing buying activity. With the macroeconomic environment showing signs of stability and other markets experiencing growth, Bitcoin's current consolidation phase might just be the calm before the storm.
Pay attention to the price formations I've circled in yellow and pink, and notice how the price reacted afterwards.
In conclusion, while Bitcoin is currently seeing a price decline, its behavior still exhibits patterns that have historically preceded bull runs. If this trend continues and we see a confirmed breakout from the current consolidation phase, it could signal the start of another significant upward movement. Investors should keep a close eye on key support and resistance levels, as well as external market factors, to position themselves advantageously for the potential bull run.
Thanks for Your attention and interest in my work.
Always sincerely Yours, Kateryna💙💛

🅱️ Expert Confirms: Bitcoin Set To Crash Below 30KSignals are available everywhere... And new data is coming in all of the timing.
The market is great.
Even though we get confirmation after confirmation, doubts still creeps in.
Even though we see the market moving just as we would expect it to move based on the cycle, sentiment and chart signals; confirmation after confirmation, for real.
Somehow, each time there is a small rise in price doubt creeps in.
➖ Will Bitcoin move to hit a new All-Time High next?
➖ Is the correction over?
➖ How can I be certain prices will not continue higher?
➖ How can I be certain prices will continue lower?
"Bitcoin is trading above $60,000 after all and that's pretty strong."
Well, actually, below 70K is ultra-bearish after a new ATH at 74K, but this is not the topic for this update.
In early 2022 we were discussing here on TradingView the bear-market that was developing for Crypto and how far down Bitcoin would go.
We were dead set on finding the target and as you know, we shared hundreds and hundreds of charts. All of us, the different players.
After a while, we decided that Bitcoin was going to settle around 20K because that was the 2017 ATH. We concluded that the bottom would happen in June or November 2021 and reach several others and varied conclusions.
We all agreed and everything was clear; it was early 2022, we still had a long way to go before reaching 20K; Bitcoin crashed below 20K and yes, even 15K was tested as support.
A certain public figure, I won't name any names, said in early 2022 that Bitcoin would move lower but stay above 30K. It doesn't matter what happens it would never go below 30K... Bitcoin was trading in the 40Ks at the time.
Sure enough, that was the signal...
Bitcoin crashed and did not move below 30K but went even lower and hit below 16K.
The same character is now saying that "Bitcoin will stay in $55K to $75K zone for now" ... This means that the crash is confirmed and it is going below 30K.
Namaste.

Potential Scenarios...So after going over many charts I'm of the belief alts have been front running BTC in fractal nature - this could mean BTC has a lot more downside in the shorter term (purple plot) or the other takeaway could be that BTC has done a really shallow retrace before getting ready to blast higher (white plot) - no matter how I slice it the end result looks to be prices going much higher and a big upcoming alt season looming - market will no doubt do it's best to shake out uncertain bulls right before blasting higher - many Bears are sold on the fact that they shorted a top at 70k~ levels and think it's all over...I think this view will be short lived and squashed later this year leaving many pessimistic market participants bitter and resentful more than they already are.

64-64.5K areaMorning folks,
Recent Fed meeting results have made impact on short-term BTC performance as well. Although our major bullish context based on daily reverse H&S pattern remains valid, BTC could try to move slightly lower. So, the right shoulder on daily chart will be more harmonic to the left one. In general, until BTC stands above 61K - H&S pattern will remain valid.
Meantime, on 4H chart we've got bearish engulfing pattern that has a target around 64-64.5K area. We will se how it works and then return back to idea of long entry with major daily bullish pattern. Today I market setup as "bearish" because it relates to intraday action.

BTC $ 255 000 this BULL RUN?Hello, everyone!💥
Today, let's talk about Bitcoin and its prospects for the coming years. What should we expect? Let's compare the two previous bull runs.
To start with, every four years, the reward for Bitcoin miners decreases, a phenomenon known as halving.
Why is everyone so waiting for halving? Well, when the next halving occurs, miners receive half the rewards, reducing the speed of new Bitcoin mining and consequently lowering its inflation rate (devaluation).
No one knows for sure what will happen next time, but it's worth making predictions based on the history of previous years. Especially since it's very transparent and repeats itself time and time again.
Let's take a look at the chart I've prepared for You.🧐
On the chart, I've marked two wedges, which I've colored white. The blue arrows indicate the regularity of three-year cycles. This is the time it takes for these channels to form and the regular way they break out.
After the breakout, the growth percentage is approximately the same ~550%.🚀
Assuming that the breakout occurred last year, from the $40,000 mark (the price has already corrected as it has done every time before - orange circles), and the growth will be like previous times, theoretically, the price in this bull run could reach the $255,000 mark.😱
🧐Do you believe in such growth? Are you concerned about the situation in the world? Share your thoughts in the comments.
💡I also wanted to share my previous chart with you. Perhaps you'll find it interesting.
Thanks for Your attention!
Always sincere with You,
Your Kateryna🫶

BTC drop this week?Anticipating a potential price decline this week, possibly targeting the 64,300 zone to capture sell-side liquidity.
With buy-side liquidity already captured on the weekly timeframe, the market may require some correction. Observing the 15-minute Fair Value Gap (FVG) for partial profit opportunities.
A break below the 66,300 mark might indicate a continuation of the bearish trend.

My Plan on BTC Plan on btc
btc going down for fill daily fvg, charts are speaking mentioned everything on charts.
lets see what going next

Bitcoin (BTC): Weekly Opening Is Red / Correction Incoming!The new week is here and Bitcoin is showing a good rejection from the local resistance zone, giving us more and more confirmations of the upcoming drop!
As we have been monitoring that upper resistance for a while, we finally managed to secure the middle line of Bollinger bands, which we like to use to determine the potential short-term momentum movements.
As the weekly opening looks promising, we will be looking for a full-scale breakdown/rejection to happen really soon!
Swallow Team

BULLISH TWEEZER BOTTOM with NVI The NVI developer was meant to know when smart money would get involved. The developer stated when at its lowest volume would indicate smart money is getting involved.
Indeed, it’s at a low volume. Here is an indicator you can use but might look in a different style but still the same when looking it up.
Higher timeframes like 2WK TF shows smart money is getting ready to plunge it sky high. Don’t use it alone, I combine it with my algorithm. This will be your great guidance. Will help you determine when to sell before the crash. When NVI reaches at a higher volume means downtrend time.
I would also use it with HISTORY VOLATILITY. It’s almost in agreement with each other.
I laid an example in this idea at price $60k where price moves up to $63k then dips but before selling keep close watch at NVI because later price kept moving up.
DONT FORGET TO DRAW A TRENDLINE UNDERNEATH to determine low volume

2024-06-11 - a daily price action after hour update - bitcoinGood Evening and I hope you are well.
bitcoin
comment: Closed my swing short for big profits, I hope you made some. Next I expect the triangle to play out and probably break to the downside. The breakout-retest at 70137 was as perfect as it gets. Bitcoin’s fate also lies with the CPI and Jpow releases tomorrow. If markets rally, so will btc. If we sell-off, btc permabulls will be delighted to be able to add to their positions at much lower prices soon.
current market cycle: trading range
key levels: small range 66600 - 72000 / big range 56000 - 74000
bull case: Bulls printed the first good looking 1h bars since Friday, today at 6.pm. CET. They are holding on for dear life here at 67000 because below is hell for them. I can see the triangle playing out and the market moving some sideways here. If bulls are strong again, they will get back above 69000 but I highly doubt that.
Invalidation is below 66000.
bear case: Bears are now below all bigger 20ema and got a second leg down inside this trading range. A third leg would bring us right to the bull trend line on the daily chart around 65000. Bears are in full control here and unless all other markets rally hard tomorrow, Bitcoin is done imo. Decent chance that we won’t see 70000 for a long long time if catalyst’s tomorrow are bearish.
Invalidation is above 70000.
short term: Neutral here inside the triangle with slightly higher odds for the bulls to trade back to around 68800 before down again.
medium-long term: down to 40000 (could take 3-6 months). Could also drop to 20000 again but let’s make 40000 first and see how many want to buy there. —unchanged
current swing trade: None. Short from 70443, sl 71950 - closed for 3300 points.
trade of the day: Small pull-back bear trend from Tuesdays Globex session. Bar 63 was the biggest bear bar and that late in a trend it’s a clear signal to exit your short position because the chance of this being the climactic end of the trend is high.

BTC Price prediction next 8 months We are entering a fear factor. All this with a daily M formation about to be completed. I see a crash coming for July or August. My general thought is That with the state of the world and US Elections, I am not being political here, Just facts that political events help move markets. I base this on my own political study of the behavior of different types of political parties and how they react to situations that cause markets to react. But as to stay in line with the TOS of TradingView I can't explain any more than what I have said. The point is, that we are finishing an M, and Political tension and world events always move markets. So I'm 90% sure we will go down 50k 40k range. As for the last move up for the bull run 2025, 26. IMHO If Biden is reelected we could see a very slow climb up or even a 2nd crash to 30k, On the other hand, If Trump wins I think we see a very fast race to the top 85k 120k. Again this is based on my own study of how people act and that makes people buy or sell. And because Wall Street and Politicians are heavily invested in BTC they fule the whale moves. RECAP, down to 50k by end of August 2024. Up to 85k by end of February 2025 Yes we can fall to 30k, yes it can go to 120k, NO it will not go higher this bull run. If it was to, we would already have a high of 85K .

2 Scenarios...Currently Seeing 2 scenarios for BTC - 1 is we correct down to 64k~ then blast to 100k/130k - 2 is we are working on a larger correction which will see us fall to 40k levels.

$BTC dip oppurtunity/shakeout before 100k #CupNHandleI think the MonStars ie; BTC, NVDA, TSLA, AAPL, all shaking weak hands before breaking shorts summer plans... Yellow lines showing "parabolic" / hyper growth... increasing angles/ of breakout... this will be last call under 70k for a while if right...
Haven't figured out exactly how to play this, maybe BITO options?
Stay tuned...
BTC Cycles & TA: 6/10/24It has been a long time, but not much has changed since my last video. Cycles continue to point down and charts continue to signal that something big and bad is coming. see the video and you decide. Make up your own mind.

HIDDEN BULLISH DIVERGENCE Hear are the FACTS from this BULL FLAG
RSI showing hence of weakness however what you see happening, when we pair the price action and when we pair the RSI together, we get divergence.
This is specifically HIDDEN DIVERGENCE. Hidden divergence is coming from a LOW to a LOWER LOW and price; a LOW to a HIGHER LOW in price.
This is HIDDEN DIVERGENCE. This is nothing to play with, this has power.
We see opposites happening in price with RSI explaining the hidden divergence.
Here’s our warning. Is this BULLISH or BEARISH?
Let’s unveil it. This is called HIDDEN BULLISH DIVERGENCE.
The only way we are going to have FWB:73K again is to see Stochastic RSI CROSS on the weekly chart and what do we have now; we have stochastic RSI already crossing on the weekly chart. We are also holding key structure on the RSI.
BITCOIN has to maintain the RALLY that’s happening before our eyes.
We are in the beginning of our RALLY. This RALLY has to continue and the price has to move above $73k.
We need to get RSI above 88. If we get all this to happen, we then have a healthy continuation BULLISH BULL RUN.
If we don’t reach FWB:73K , if STOCHASTIC CROSSES BACK to BEARISH, and if BTC does not reach RSI 88 then we have a FAILED RALLY.

BTC going to $95-$200After doing some observation and calculations, I'm confident within the next few days BTC will hit $100. You'll have to be positioned to catch the wick though
