big crooection is coming ending diagonalbig correction is coming ending diagonal tripple wave correction plus good market sentilment
SL 68000
TP1 60000
TP2 58000
TP3 48000
TPX 28000
XBTUSDT trade ideas

BTCUSD sellthis is what we are looking at . lets see as it plays out , risking 1 percent for 2 1:2 RRR

Quick Bitcoin Scalp TradeDear Friends,
Previous trade hit my First Target and I moved stop loss to the break even after hitting my first target. I always use this practice. Now I can See charts giving us long scalp opportunity again. Look at the charts.
Take care and Traded responsibly

ANALYSIS BITCOIN AS SPECIAL TRADES 20/06/2024Chart Overview
Volume Profile:
Visible range volume profile is displayed on the left side of the chart.
High trading volume zones are marked by longer horizontal bars.
VWAP (Volume Weighted Average Price):
Weekly VWAP levels are shown, currently at 66,061 and 64,843.
Trendlines and Channels:
An upward trendline seems to be in place from the lower left to the upper right.
A descending channel is indicated, with Bitcoin currently trading within this channel.
Support and Resistance Levels:
Key resistance levels are marked around 66,370 and 70,000.
Important support levels are around 60,129 and a potential lower target at 56,272 based on the Fibonacci extension (1.618 level).
Recent Price Movement:
Bitcoin is currently at 65,151, recently bouncing off the lower boundary of the descending channel.
Short-term resistance is at 66,370, with a potential break higher to 70,000 if momentum continues.
Analysis and Projections
Bearish Scenario:
If Bitcoin fails to break the descending channel and the resistance at 66,370, it could continue to decline.
The next major support levels to watch are 60,129 and 56,272.
A break below 60,129 could indicate a bearish continuation.
Bullish Scenario:
If Bitcoin breaks above 66,370 and sustains the momentum, it could aim for the 70,000 resistance level.
Sustained trading above 70,000 could indicate a trend reversal to the upside.
Volume and VWAP:
Pay attention to the volume. A breakout with high volume above resistance levels would be more significant.
VWAP levels (66,061 and 64,843) are key for understanding the average trading price and potential support/resistance.
Summary
Critical Levels: 66,370 (resistance), 60,129 (support), 56,272 (Fibonacci extension).
Trend: Currently in a descending channel; break above 66,370 needed for a bullish signal.
Strategy: Watch for volume and price action at the key levels mentioned for potential entry and exit points.

BTCUSD: Sell ideaOn BTCUSD as you can see on the chart we would have a high probability of seeing the market continue its decline after the pullback on the support line.

Bitcoin's Trend Changes after Reaching 0.5/0.6 Fibonacci LevelBTC Trendline Breakout, so market may retrace to Fibonacci levels 0.5(63919) or 0.6(62196)...
After reaching these levels, BTC may either Bounce or change from Downtrend to Uptrend.
I want to help people Make Profit all over the "World".

BTC UPDATEwave 3 should hit the 1.618 extension and we get bounce to the mid bigger downtrend channel (orange) in a wave 4. Should come down in a wave 5 to 56.8k area and then well see if we hold there.
If however we get a bounce here at wave 3 then this was just an abc corrective wave of the wxy and i will need to rechart some stuff

BTC Short Idea - Ascending Wedge RetestBTC had a nice flush below the ascending wedge after it broke earlier. It's having a recovery rally now, but I'd expect this to fail if it moves all the way up to retest the wedge. There's also some horizontal resistance around there as well for it to contend with. If it's able to get past all that, I think the short term trend may be switching back to up.

$BTC Bitcoin Update: Head and Shoulder Pattern!CRYPTOCAP:BTC Bitcoin price is forming an inverse head and shoulder pattern!
Current Price: $69800
Major neckline resistance around $71,500
More precisely between 71500 - 73000
If $Bitcoin is going to move to higher prices then price action needs to break neckline resistance to make for price discovery up to 84k. Up resistances: 76400, 79200, 82200, 84600. This will cause altcoins to rally for higher prices.
Else if #Btc continues to reject $71500, then expect retest of previous supports at 67000, & 64300. Consequently altcoins will further lose in value.

Bart Says HelloWith resistance locking in what seems to be Wave 4 of a potentially leading diagonal wave (see orange circle), unless bulls can push price back above $72K in the days ahead, its probably best to consider the idea that Bitcoin has printed its top already for 2024.
If so, we can expect Bitcoin to fall steeply for the next 2 years roughly.
Target?
$5.00

BTCThe price is moving within a descending channel with a 100-period SMA above it, indicating bearish sentiment. However, since June 24th, the price has encountered a barrier several times (Zone of Price = ZOP, between 64124.66 and 64731.46). A breakout above the ZOP could lead us to consider a decline towards 63182.59, and exceptionally towards 60530.54, before potentially initiating a bull run. This could be triggered by the US presidential elections, with strengthened sentiment favoring a Trump victory, as well as a possible RN victory in France and an imminent decrease in interest rates this year by the Fed. It is also possible for the price to exceed 66676.17 and reach 71926.34 without breaking the ZOP.

Still in a Bull Market..180k by March 2025?From my analysis, using Fib Time, Fib Extensions, Fractals, Market Structure, and the current price action forming a bull flag, I placed my rough fractal idea over the top of the BTC chart alongside timing..
Double/Triple top could play out to finish off this cycle.. or it could be a blow off top (less likely with more capitalized markets..
173-182k is my top target for this cycle.. though price could fall short of this.. if this plays out, then I'd expect the next market bottom to form around current prices (~57k in November 2026)

Could Support @ $65K be New Low? - BitcoinHere I have Bitcoin on the 4 Hr Chart!
In the Overall Daily Chart, price on Bitcoin looks to be Consolidated!
But scoping down to the 4 Hr, we see Price has been using this Support Zone @ $64,500 - $65,500
- Feeding the Bullish Bias is purely boiled down to Technical Analysis being the:
- Tweezer Bottom
&
- Bullish Engulfing Candlestick Pattern forming ..
@ an interesting level of SUPPORT!!

Long BTCUSDIdea based on Classical chart patterns (Daily Chart).
Abbreviations:
M/W/D/H = Month/Week/Day/Hour
TL: Trendline
DT: Double Top
DTr: Descending Triangle
FW: Falling Wedge
Rct: Rectangle
We are still close to the all time highs, and we have also seen a breakout from a 4W FW on the weekly chart indicating some buying interest left near the relative lows.
When you look at the daily chart, there is a 6W DT which seems to be complete, but the downside breakout bar is with a long wick. And the closing bar was up.
This leads me to suspect this might be a fake breakout. Support is seen close to where we saw the 4W FW pattern completed, with levels close to the last bar acting as key bar to watch. Also, we can see the current market as inside a 20W Rct pattern and we are right around the middle of the box.
if the 6W DT fails the first target will be @ 77363, if completed, the target will become the 4W FW target @ 81678.90, and ultimately 20W Rct target @ 84001.60
the problem with this trade is that we still don't have a confirmation of a failure, so i need to place the stop loss at lows level within the formation of this DT pattern which is May16th low @ 64548, being fully aware that this trade might be one that could cause me to enter multiple times.
Risk reward calculated against capital using the first target is
Entry : 66330 or below
SL : 64548 (-0.73%) / TP: 77363(+4.50%)
RR: Apprx. 6:1
(as always, not investment advise or prediction)

Bitcoin - Critical Trendline To WatchChart is self explanatory. This first (purple) trendline is a critical trendline to watch now. It has been tested frequently. If it breaks, then the support levels and fib levels testing may begin.
BTC has repeatedly failed to break (or sustain above) the 72k USD mark.
BTC price can go back up from here, but if this trendline breaks, the correction could be deeper. It will then open the door to 56k support zone testing or even 46k support zone testing.
No trading advice, neutral stance.

Btcusd butBreakout to the upside, liquidity sweep on the bottom signalling bullish direction, bullish market structure, confluence with 1hr and 4 hour, reaction at support line, it's failing to go down to 66000

all you need to knowSpeaks for itself. No need for boring talk about waves, fibs, wyckoff etc. This single signal works always.
Good luck.

Bitcoin Elliott waveHaving an open mind can help understanding the current price action and elliott wave aspects.
There is a blue impulsive wave that could indicate a connector wave in a sideways combination pattern or it could be a new impulse and now we could expect any simple corrective pattern to terminate the whole structure that started correcting on 13th of march.
Waiting for clarity

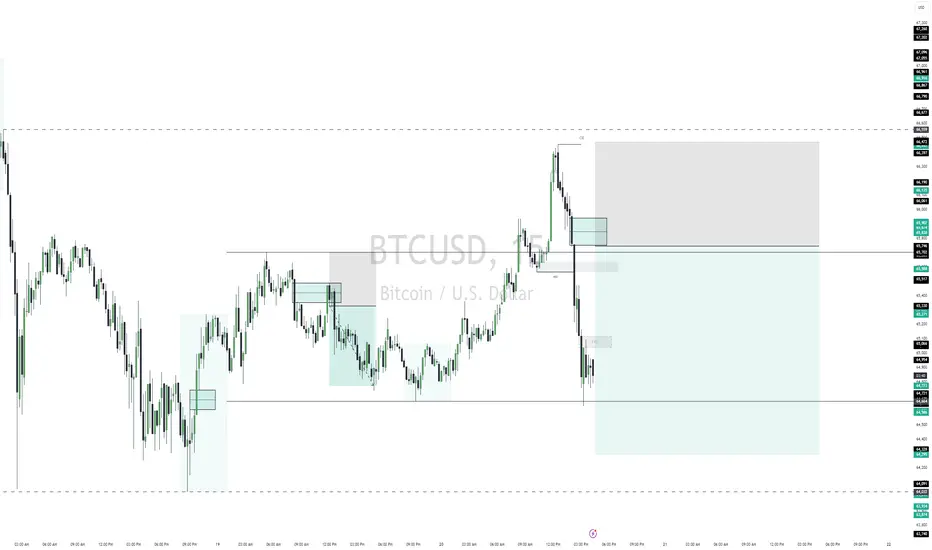
BTC SHORTINGBTC has been bearish for some time now and will continue to do so. This price moved in a way that was creating bearish momentum for BTC. We recently had a point of interest on the M15 chart , price pierced up through it sweeping off a previous high and creating a new one we will target in the coming days/weeks! A low that created the current high also gave am indication that the market was changing it's structure , making old lows our target. You can expect Bitcoin to drop to 63,360 after a little retest.

Short term short is possible on the if it breaks and retestIm bullish and expecting the sweep of the lows before the continuation up. So meanwhile Im monitoring for the short trade. A break of structure and retest is my sell signal.
Bullish Idea
Always follow these rules
- Accumulation / Manipulation / Distribution
- No liquidity raid = No trade
- Never buy high and never sell low
“Adapt what is useful, reject what is useless, and add what is specifically your own.”
Dave FX Hunter ⚔

BTCBitcoin is currently at 64700.
The inability to break through the downward trend suggests a continued correction, targeting the level of 62,500, from which a good rebound is expected.

BTCUSD tripple TOPMonthly chart.
Tripple TOP.
Possible correction to 44.000 usd.
Price below 44.000 usd means that we are going more down to 30.000 usd.
Everybody is now bullish (if you look at charts on tradeview). Every one on youtube is screaming that the price is goin to 100-150.000 usd.
