XLM ROADMAPThe asset has now arrived at a great load zone and has the potential for a massive Bullish swing to its BTC pair. The Resistance of the falling wedge is the main berrier that was helding the bulls away which has been violated with great volume.
previously...
XLMBTC trade ideas

Stellar Lumens (XLM) vs BTCYou could wait years to see a chart like this and honestly speaking it feels like it has been years in the waiting.
On this 4-day chart Stellar lumens has just confirmed support on the 21-week moving average after a 3rd attempt. All three oscillators I use (RSI, Stochastic RSI, & Money flow) are printing higher lows following a period of consolidation in price action. The 21-week support is not to be underestimated, once support is established there's no catching price action until the 21-week is retested, so don't FOMO if you miss out on the first wave.... let the retail money pick up the slack.

Potential of Stellar LumensBased on donchian channel, XLMBTC is now near generational bottom area.
And look at the chart using Tom Demark sequential countdown method, indicating 13 in the several main HTF.
Futhermore, using BNF's methods, we can see this chart is in the historical bottom, too.
Using XLM chart to ETH would also be good for analyzing.
And then... patience is the key.

STELLAR (XLM)A bullish cross of 1D 50MA with 200MA could bring XLM into 0.000006 BTC area. That's the spot where 3D 200 EMA is hanging.
Again, let's see at once how BTC is developing, I think if it rise in 35k area could bring a positive sentiment to the market, even for short time though.
I am stuck with it since Jan therefore I need a bounce. 👆🏻
Best regards everybody.


XLM bottom signal and potential breakout.....patience!This is a follow on XLM/BTC pair chart I posted earlier to elaborate on the idea that a breakout could be in order for XLM. As with many other severely beaten down alts, XLM is beginning to show strength on the BTC pairing.

XLM - beutiful wedge inside wedge !There is a beautiful broadening bullish wedge forming (blue line) that has recently broken to the upside.
Confirmation has been signaled and price is in backtesting mode.
This broadening descending wedge is developing inside a larger pattern: a broadening bullish wedge (not descending but broadening to down- and upside).
All this happens on the BTC pair.
My take is that once Altseason gets going XLM will be one of the most explosive coins in the market.

Stellar 100% Potential Mid-Term (Weekly Timeframe)We have strong signals coming out of this chart in favor of the bulls, let's look at those.
This is XLMBTC (Stellar) on the weekly timeframe; aka. Long-term.
First, notice the broken downtrend-line.
This trendline marked a bearish trend that lasted more than a year.
This bearish trend has been broken.
Second, we have a long-term higher low, since December 2020.
1.5 Years and the old support wasn't even tested, this is a strong signal in favor of the bulls.
Trading volume continues to increase week after week.
Above 9-May's low (0.00000391), we are strongly bullish and expect additional growth.
Below this level, we stop any trading at a loss.
Namaste.

XLM - starting to outperform BTCAs many altcoins, XLM has started to massively outperform Bitcoin !!
Will be interesting to see how this further develops ....

XLMBTC C&H SetupI'll make this brief. XLMBTC is one of the more bullish pairs in the current crab market. The setup looks very similar to ICP which pumped pretty hard today. I don't know what path it's going to take to get to the final target, but eventually it will get there. I would absolutely not be surprised to see a hard pullback at some point to retest the lows, but it doesn't need to go back if it can break through resistance and hold with a sign of strength.

Stellar Goes Bullish Long-Term (100% to 190% Potential Targets) Notice the blue down-trendline on this pair, XLMBTC.
We can see prices moving above this trendline this week, breaking a major downtrend.
We have a long-term higher low (since December 2020).
A very strong RSI (55-Weekly).
The MACD going bullish.
We can also appreciate prices moving above EMA10 and EMA50.
The blue square at the bottom is our support.
This is where we set our stop-loss.
More details on the chart (targets).
Namaste.

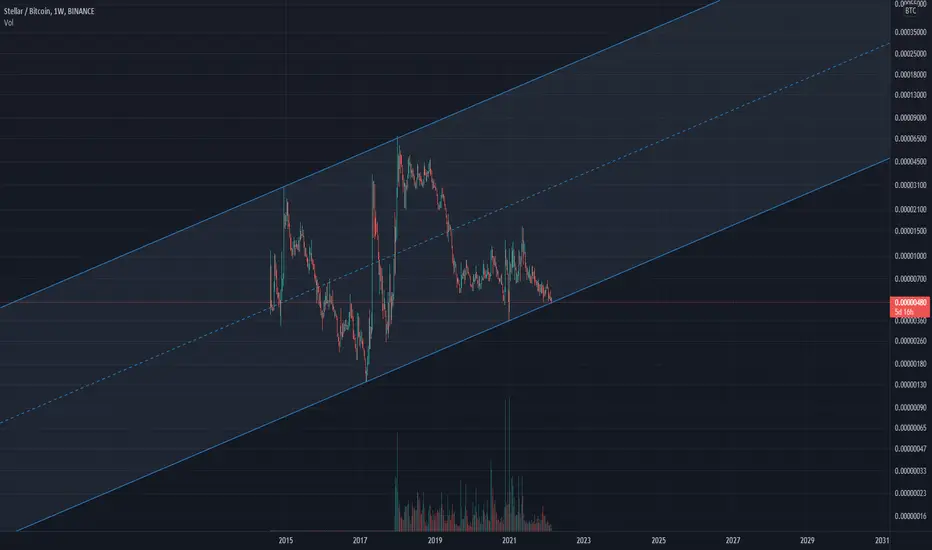
XLM / BTC Main trend. Channel. Accumulation 2.5 years.Coin with the longest accumulation of 2.5 years. I work in this accumulation from the moment of its formation. The step of this channel is 100% (previously 55%) At the moment the price is at its lower zone.
Coin in coenmarket: XLM
XLM/BTC The channel of the position set 2.5 years.

ideapossible and risky short term bounce, set tight stop loss as btc seems to be finding temporary bottom which could leave all alts bleeding.


XLMBTC light at the end of the tunnel ??XLMBTC has been in downtrend on daily for almost a year, this is the most volitile the chart has been in quite a while could see a channel breakout upwards here? i sure think so with xlm nearing .10 a coin i think we could see xlmbtc approach the area of .00....600. XLMBTC and around .22 XLMUSD.

XLM/BTC The channel of the position set 2.5 years. Coin with the longest accumulation of 2.5 years. I work in this accumulation from the moment of its formation. The step of this channel is 100% (previously 55%) At the moment the price is at its lower zone.
Coin in coenmarket: XLM
XLM/BTC Main trend. Channel. Accumulation 2.5 years.

This is XLM!XLMBTC is near two major supports. Also, the volume has been decreasing in the bearish trend.

Assymetrical investment opportunity: Stellar (XLM)XLM has very beautifully bounced off the biggest support trend line since existence. Buy now and rejoice later... or regret-
Anyways buying here is way better than buying those big green candles on the top.

Average Directional Indicator Weak Trend Cross.ADX Indicator weak cross indicating possible upside if past performance is anything to go by. Movement anticipated.
Not advice

XLM is basing for around 900 days !!XLM Stellar looks very attracting to me !!
On the BTC pair Stellar has been basing for around 900 days and is now touching the significant 520 sat level where the price has been trading with a historically high volume.
On balance volume has never given back the big surge that it has made during the last bull market.
Stellar has been very quiet and working behind the scenes.
It has recently acquired Moneygram and will soon open up cash corridors in 12 significant countries.
I usually use Moneygram service to send cash to my relatives in Mexico - it is a cheap and fast solution.
Actually they are integrating the Stellar blockchain.
They have a 150 million plus customers.
As y said price is flirting with the high supply price of 520 sats. It could go lower of course but the entry point is great.
During the last bull run it had a first run up (May2017) and the moving avarages crossed back down (yellow circle).
However the second surge was for real.
This 2022 is THE year.

XLMBTC Bounce Incoming ?With our downtrend and a local uptrend that we have there could be coming a relieve rally against BTC.
Also the TD Seq hit a 9 a few days ago which could also indicate our rally to the upside.
Not financial advice do your own research.

XLMBTCXLM shows a very good chart and I think we can trust XLM and publicly we see a positive movement in the coming days
