XRPUSDT is in rangeXRP is currently moving in range on a 15 min time frame, it would soon give a breakout either to the upside or downside. Targets are mentioned on the chart.
XRPUSDT trade ideas

XRPUSDT - The underrated coinDon't miss out on XRPUSDT. Massive push incoming, and definitely a coin to hold for long.
XRP's use cases are in the works across 12 major banks in 12 super power countries.
As the backbone infra for digital payments, the natural disruption are the likes of WISE and Revolut.
Its a long term hold for me for XRP. Before it hits $1 and all hell breaks lose (and if you believe my optimism), get it while its cheap!
]

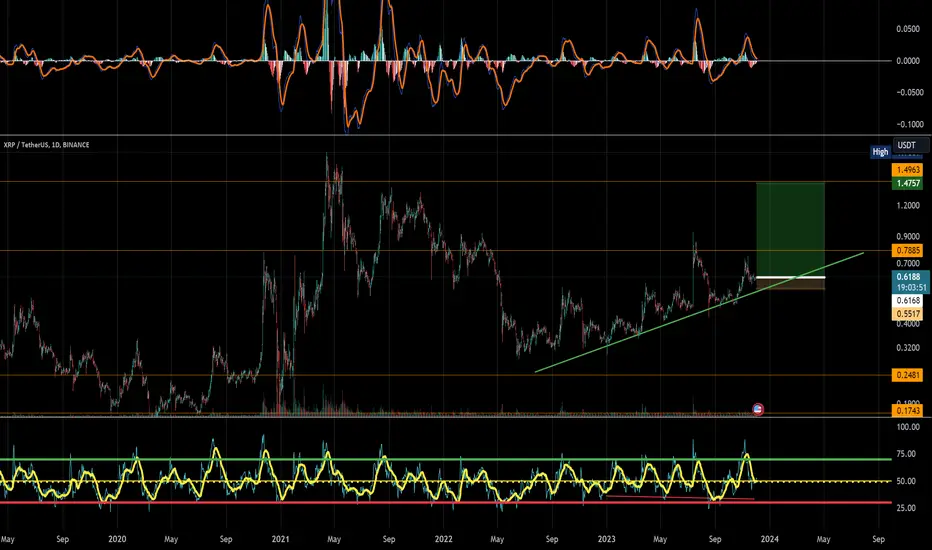
The key is whether it can rise above 0.6810-0.7046Hello traders!
If you "Follow" us, you can always get new information quickly.
Please also click “Boost”.
Have a good day.
-------------------------------------
(XRPUSDT chart)
(1M charts)
If the price maintains by rising above 0.6810, it is expected to lead to a move to rise above 0.9413.
(1W chart)
Accordingly, if it rises above 0.7046, it is expected to show a rapid upward trend.
The key is whether this upward trend can rise to the 0.9470-1.2455 range.
(1D chart)
The price appears to be maintaining in the box range of 0.5967-0.7500.
Accordingly, the key is whether it can rise above 0.6500-0.6810.
If the price rises above 0.6383 and holds, I think there is a high possibility that an uptrend will begin.
The next period of volatility is around December 22nd.
--------------------------------------------------
- The big picture
The full-fledged upward trend is expected to begin when the price rises above 29K.
This is the section expected to be touched in the next bull market, 81K-95K.
-------------------------------------------------- -------------------------------------------
** All explanations are for reference only and do not guarantee profit or loss in investment.
** Trading volume is displayed as a candle body based on 10EMA.
How to display (in order from darkest to darkest)
More than 3 times the trading volume of 10EMA > 2.5 times > 2.0 times > 1.25 times > Trading volume below 10EMA
** Even if you know other people’s know-how, it takes a considerable amount of time to make it your own.
** This chart was created using my know-how.
---------------------------------

Possible 20%+ gain is less than 5 daysIm seeing a possibility of 20%+ gain here in a few days or less. Trading in symmetrical triangle and about to get squeezed.

XRP (UPDATED!) → Ripple Higher Highs! Long the Moon Candle!?Ripple has formed another pattern for us to take advantage of! My previous analysis showed a bear channel followed by what looked to be a forming double bottom. Now we have an ascending channel that appears to be putting in a second higher high.
How do we trade this?
We have most of the pieces we need to long with one crucial exception; the bull confirmation candle. The ascending pattern, higher highs, price above 30EMA and 200EMA, and RSI above the Moving Average, are all requirements for the long entry and we have them on this chart.
Things to watch out for . Bitcoin as a leading indicator is at its Weekly Resistance, we need to be aware that if Bitcoin reverses here, it could stall market sentiment to the upside. Be ready to respond to a bear signal and follow through with any such long position.
Trade Idea
Long Entry : $0.62
Stop Loss: $0.60
Take Profit: $0.66
Risk/Reward Ratio: 1:2
Key Takeaways
1. Three Legs Down, Trend Reversed.
2. Two Higher Lows, confirming the second.
3. Price above 30EMA and 200EMA. Wait for a Confirmation Candle.
4. RSI at 55.00 and above Moving Average, Bias to Long.
5. Target 1:2 Risk/Reward.
You are solely responsible for your trades, trade at your own risk!
If you found this analysis helpful, click the Boost button and let us know what you think in the comment section below!

HelenP. I Ripple can make small movement up and then bounce downHi folks today I'm prepared for you Ripple analytics. Some time ago price declined to the 0.6700 resistance level, which coincided with the resistance zone, and in a short time broke it. After this, the price some time traded near this level and then continued to decline to the 0.6000 support level, which coincided with the support zone. As well, Ripple entered to consolidation, where it first tried to rise, but failed and declined until to support zone. Later XRP rose higher than the 0.6000 level, but soon price fell back to the support zone and even lower. After this movement, Ripple rebounded back to consolidation, made a correction to the support zone, and continued to trades in this range. A few time later price rebounded from this zone and rose to 0.6400 points, but recently it a little fell. For this reason, I expect that Ripple can make a small movement up and then rebound down to the support zone. That's why I set my target at the 0.5900 level, which is located in this zone. If you like my analytics you may support me with your like/comment ❤️

XRP is ready for lift upXRP was never my favorite Token but we have to keep attention as its potential is extremely high. I do expect to reach out 23$ between january and april 2025

XRP is BullishXRP is making higher highs and higher lows on 1H time frame, the rally is expected to continue as BTC is also above 40k. Targets are mentioned on the chart.

XRP Could Rally to $0.68 as It Breaks Above Key ResistanceAn ascending triangle pattern has materialized on the daily chart of BINANCE:XRPUSDT . Over the past 24 hours, the cryptocurrency managed to breach the lower boundary of this pattern, situated at $0.6235. What's more, it sustained trading above this level as of the current moment.
If XRP can maintain a closing price above this crucial threshold by the end of today's trading session, it could pave the way for further upward movement in the coming days. This potential rally might propel the cryptocurrency to reach the next significant resistance level at $0.68.
Currently, both the Moving Average Convergence Divergence (MACD) and the Relative Strength Index (RSI) lend support to this optimistic outlook. In the previous 48 hours, the RSI line managed to surpass the RSI Simple Moving Average (SMA) line, indicating that the bulls have gained an advantage over the sellers in XRP's daily chart.
Furthermore, the MACD line is in the process of crossing above the MACD Signal line. The convergence of these two technical indicators could signify a continuation of XRP's bullish trend.

Xrp , ready for big pumpHello traders
In usdt chart , it's trend line has broken and the character has changed into bullish phase.
In XRPBTC chart it received to buying zone which pumped in past
So BTC holders will change their BTC to XRP and it will pump well soon.

XRP PUMB !!! WHY DO I KNOW!!!XRP has been accumulating for a long time. It just needs one positive news catalyst to break out of its current trading range and start to rise in price.
Here are some specific examples of positive news events that could trigger a breakout for XRP:
A favorable ruling in the Ripple vs. SEC lawsuit
The adoption of XRP by a major financial institution
The launch of a new major XRP-based product or service
Of course, there is no guarantee that any of these events will actually happen. However, the fact that XRP has been accumulating for a long time suggests that there is a lot of pent-up demand for the coin. If one of these positive events were to occur, it could lead to a significant price increase for XRP.

dont miss your time on this bullsh#tXRP is just a game for distract your mind ....
the market is bigger than to spend your gold on it...
this shit is game over

XRP longterm Analysis As one of the follower asked for it.
Xrpusdt is currently in Huge Bull flag if we see in high timeframe weekly and monthly.
The main pivot is claimed as you can see and is also retested.
I think it can push from here towards the top of the channel(bull flag) and then come towards the marked area(yellow) consolidating.
My thoughts about it in longterm is that it is not going to break the channel sooner.
It will probably take much time as i have drawn the ideal scenario for breakout.
This is just an analysis from my side.
Note: Not a Financial Advice.

QUCIK ANALYSIS OF XRPUSDT: POTENTIAL PULLBACKRecent long candle potentially created an imbalance in the buy and sell orders, which provided the opportunity to identify the fair value gap areas as well as the demand zone. These structures/values confluenced with the key levels identfied for XRP. Levels to watch out for are as follows:
0.62270 - XRP to pullback once it gathers momentum from this level. This level coincides with the demand zone.
0.62570 - a breakdown of this level could confirm that price may retest the demand zone. This level also coincides with the fair value gap zone.
0.61460 - possible retest level if the price did not gather enough momentum from the demand zone. This is also the area where to expect the formation of divergences.
0.62930 - a breakout of this level could confirm new higher highs.
I would place a LIMIT BUY order at the 0.62570 and 0.62275 levels.
/please DYOR/trade at your own risk

XRP Ripple: A Rollercoaster Ride Ahead! CRYPTOCAP:XRP
BINANCE:XRPUSDT.P
XRP Ripple: A Rollercoaster Ride Ahead! 🎢🚀📉
Attention, crypto enthusiasts and traders! As we dissect the charts of XRP Ripple, a fascinating pattern emerges, hinting at a significant market movement. After its impending retracement, XRP is poised for a notable surge, potentially offering lucrative opportunities for the astute trader.
However, it's not all clear skies and smooth sailing. The rise we anticipate could well be the precursor to a more extensive, cycle-degree bear market. This shift in market dynamics calls for a strategic approach to trading XRP Ripple.
For those invested in or considering a position in XRP, now is the time to stay extra vigilant. The expected upswing could be your chance to capitalize, but it's crucial to remain aware of the potential downturn that might follow.
In the crypto market, volatility is a constant companion, and XRP Ripple is no exception. The projected bear cycle, while challenging, is a natural ebb in the ever-fluctuating world of cryptocurrencies.
To navigate these turbulent waters, keep an eye on key technical indicators and market news. Consider leveraging this upcoming rise, but also prepare for the longer-term bearish phase. As always, risk management and a well-thought-out exit strategy will be key to your success.
Stay ahead of the curve, and let's make the most of these dynamic market phases!

Xrp tradeXrp still waiting to reclaim previous val if break out 0.63 it would reach 0.65 which current poc.

XRPUSDT TRENDINGLINE IN A BULLISH TREND XRP is goes upward and it continues to go in a bullish trend as per chart stop loss and tp is set.

XRP MOon BoYs are back. i wanted to post this as it retested after the fake scam news. back pushing up against that high and looks like a great move up on the weekly.

XRP PumpCurrently just sitting at about that 0.60 area the last 2 weeks. been holding that level, im thinking we see XRP pump to that 80 cent level. which we havent broken since April of 2022.

XRPUSDTWith the continued rise of Bitcoin, the price of this currency, XRP, has also taken an upward trend and will probably continue up to the area of 1.54.

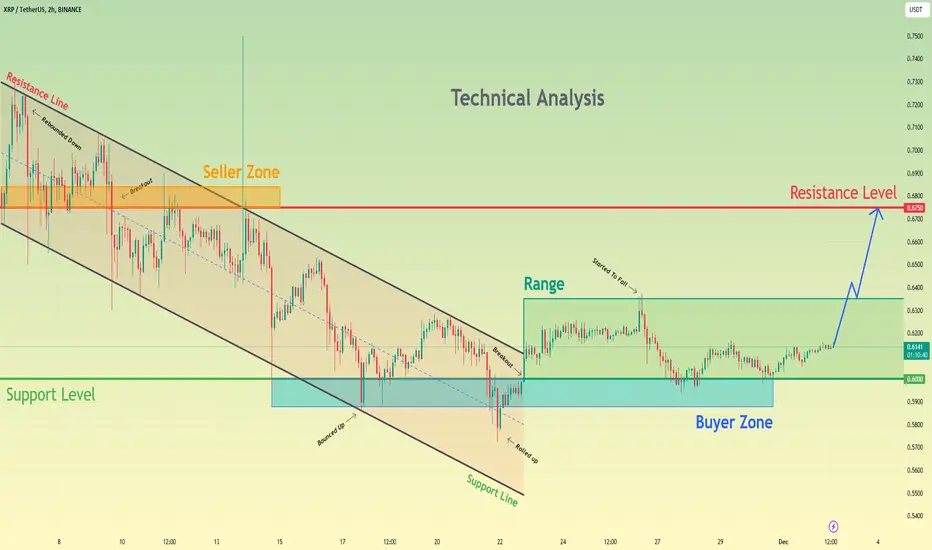
Ripple can exit of range and then continue to grow to 0.6750Hello traders, I want share with you my opinion about Ripple. Observing the chart, we can see that the price started to decline in a downward channel, where it first reached the resistance line and then in a short time declined to the 0.6750 resistance level, which coincided with the seller zone. then price broke this level, made a retest, and declined until to buyer zone, breaking the 0.6000 support level. But soon, Ripple rose back and even exited from the channel. Also then, Ripple started to trades in a range, in which it tried to rise higher, but failed and declined back to the support level, which coincided with the buyer zone. Then XRP some time traded near this level and bounced up. Now, I think that Ripple can continue to move up to the top part of the range and try to exit from it. After the price exit from the range, it makes a retest and continues to move up to the 0.6750 resistance level, where is located my target. Please share this idea with your friends and click Boost 🚀
I'LL BET XRP GOING UP TO 0.94 TO 1.34 $!I personally am more than 50% confident that these two TP (take profit) levels will occur, and the reason for my confidence is the use of this method in Forex and the analysis of other cryptocurrencies. However, it depends on your own preference whether you want to place a bet at $0.94 and profit or at $1.34, and I don't know about the time, so don't ask. Just know that whatever happens, I constantly review this chart and see my own analytical correctness or mistakes.
But my analysis method might be interesting for you, as I base it on the cloud leftovers in Ichimoku. There are two clouds, one in the daily timeframe and one in the weekly timeframe, indicating trading opportunities that I have managed to discover.
Best of luck!
