XTZUSDT.P trade ideas

TEZOS Signal for HODL : 02.03.22 $XTZAll the important levels of support and resistance are marked on the chart. In this analysis, we will identify good entry points for you so that you can buy in these ranges when the market falls further .
📊 First Entry Point : $ 2.6
📊 Second Entry Point : $ 2.1
Follow our other analysis & Feel free to ask any questions you have, we are here to help.
⚠️ This Analysis will be updated ...
👤 Arman Shaban : @ArmanShabanTrading
📅 03.Feb.22
⚠️(DYOR)
❤️ If you apperciate my work , Please like and comment , It Keeps me motivated to do better ❤️


XTZ Better to short XTZ high RSI and want to hit trndline resistance. Maybe u have a look to short it

XTZ short setupTezos had a nice run over the past week but is still in a general downtrend and currently reaching a tough resistance area, which coincides with:
- 0.5 FIB level
- 50 EMA
- Low volume compared to the last big run in sep/21. This makes me confident in that we are more likely to see a move down.
Waiting for confirmation on the lower timeframes before entering

AYEEErewhjdfhfehreriiuhfuhishdfhsiduhfushdfuhsdhfsdhhusdfiuhsdiuhfishduhsdfiuhsdiufhisudhfiuhsdifhsidhfishdihsdfiuhsdhfisduhfiuhsdiufhisduhfiusdhifuhsdihfiusdhfiuhsdifuhsidhfuihsdfiuhsdifhuishfiuhsdiuhfiusdhfiushdfiuhsdiuhfiushdfihsidhfshdfihsdiufhisduhfishdfiuhsdiufhsuhdfihsdfiuhsdifhisduhfishdfiuhsdifhsdifhuisudhfiuhsdfuhsiduhfiusdhfiudhsfuhsdiufhushdfiuhsdifhsdiuhfiusdhfushdfuhsdifuhsidfhisdufiushdfusdfuhdshufsdiuffhhiihfuifudfhudhihiuhiuhuhuhiuhucxvcxvxcvxcvxcvxcxcxcxcxcxcxcxcxcxcxcxcxcxcxcxcxcxcxcxcxcxcxcxcxcxcxcxcxcxcxcxcxcxcxcxcxcxcxcxcxcxcxcxcxcxcxcxcxcxcxcxcxcxcxcxcxcxcxcxcxcxcxcxcxcxcxcxcxcxcxcxcxcxcxcxcxcxcxcxcxcxcxcxcxcxcxcxcxcxcxcxcxcxcxcxcxcxcxcxcxcxcxcxcxcxcxcxcxcxcxcxcxcxcxcxcxcxcxcxcxcxcxcxcxcxcxcxcxcxcxcxcxcxcxcxcxcxcxcxcxcxcxcxcxcxcxcxcxcxcxcxcxcxcxcxcxcxcxcxcxcxcxcxcxcxcxcxcxcxcxcxcxcxcxcxcxcxcxcxcxcxcxcxcxcxcxcxcxcxcxcxcxcxcxcxcxcxcxcxcxcxcxcxcxcxcxcxcxcxcxcxcxcxc

RR=2 sell ideabearish crab pattern + rising wedge + RSI divergence + Bearish engulfing
PS : never risk more than 2 % of your capital per trade

XTZ_USDTtezos in log scale in bullish channel , after touch bearish trendline , correction is possible , after correction we buy some tezos .
trade safe with stop loss and money management.

Xtz top of channel with bearish rsi indicationhi everyone
as u can see in chart xtz in a bullish channel n rsi indicating bearish divergence. short it tp1 middle of channel n tp2 bottom.
not a financial advice
like,comment and follow for updates
check my previous analysis all touched targets
chao


Analysis XTZUSDTHello friends,
Welcome to these analyses about XTZUSDT , we take look at the 1W time frame.
Support points ( 2.5 . 2 )
And
Resistance points ( 5 . 6.5 8.9 )
Has been specified
The information is provided only for educational purposes, and should not be used to take action in the markets.
Thank you for watching the analysis
Please follow us

XTZUSDTwe must attention suplly and demand area and trend in triger time frame with trade line or classic patern
base timeframe : 4h
triger time : 15m

🔥 XTZ Bullish Channel BounceIf you've followed my XTZ trades over the past couple of months, you've seen this huge bullish channel before.
Well, it seems we've got another bullish channel bounce at our hands. With BTC showing slight bullishness, and stocks reversing strongly, I'm anticipating more bullish price action for XTZ.
Targets placed at recent tops.
Happy trading!

XTZ 1hXTZ will form a double top if it fails to break the resistance level. Support and resistance levels are indicated.
XTZ Long TerM DumpXTZ Short Entry For Leverage Traders.Read The Image Carefully Before Entering.Trade Safe.


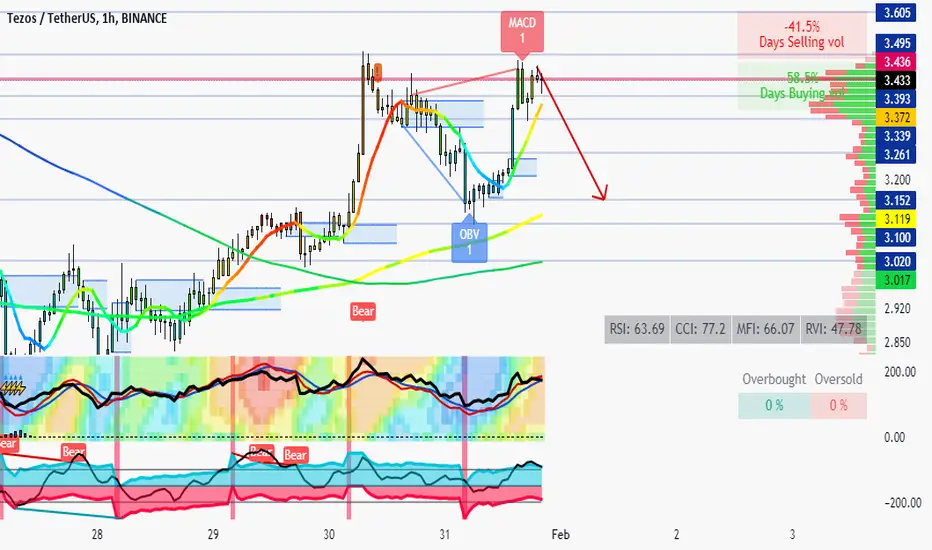
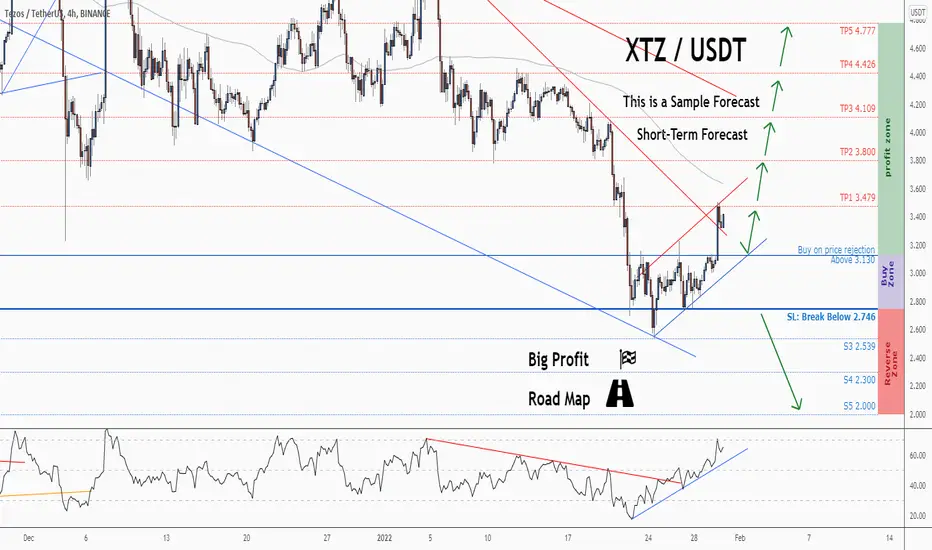
💡Don't miss the great buy opportunity in XTZUSD @tezosTrading suggestion:
". There is a possibility of temporary retracement to the suggested support line (3.130).
. if so, traders can set orders based on Price Action and expect to reach short-term targets."
Technical analysis:
. XTZUSD is in a range bound, and the beginning of an uptrend is expected.
. The price is below the 21-Day WEMA, which acts as a dynamic resistance.
. The RSI is at 64.
Take Profits:
TP1= @ 3.479
TP2= @ 3.800
TP3= @ 4.109
TP4= @ 4.426
TP5= @ 4.777
SL= Break below S2
❤️ If you find this helpful and want more FREE forecasts in TradingView
. . . . . Please show your support back,
. . . . . . . . Hit the 👍 LIKE button,
. . . . . . . . . . Drop some feedback below in the comment!
❤️ Your support is very much 🙏 appreciated!❤️
💎 Want us to help you become a better Forex / Crypto trader?
Now, It's your turn!
Be sure to leave a comment; let us know how you see this opportunity and forecast.
Trade well, ❤️
ForecastCity English Support Team ❤️
💡Don't miss the great buy opportunity in XTZUSD @tezosTrading suggestion:
". There is a possibility of temporary retracement to the suggested support line (3.130).
. if so, traders can set orders based on Price Action and expect to reach short-term targets."
Technical analysis:
. XTZUSD is in a range bound, and the beginning of an uptrend is expected.
. The price is below the 21-Day WEMA, which acts as a dynamic resistance.
. The RSI is at 64.
Take Profits:
TP1= @ 3.479
TP2= @ 3.800
TP3= @ 4.109
TP4= @ 4.426
TP5= @ 4.777
SL= Break below S2
❤️ If you find this helpful and want more FREE forecasts in TradingView
. . . . . Please show your support back,
. . . . . . . . Hit the 👍 LIKE button,
. . . . . . . . . . Drop some feedback below in the comment!
❤️ Your support is very much 🙏 appreciated! ❤️
💎 Want us to help you become a better Forex / Crypto trader ?
Now, It's your turn !
Be sure to leave a comment; let us know how you see this opportunity and forecast.
Trade well, ❤️
ForecastCity English Support Team ❤️

XTZ Bullish ChannelHello Traders, Bag holder's and Mewn Boys,
After a long downtrend since October it seems as if we are finally coming to a draw at the downside. As you can see Tezos Has been in a bullish Channel since back in October of 2019 topping at its most recent high above $8 in October of 2021. Starting the year off in 2022 the crypto space has not gotten off on the right foot yet, I see a beautiful ending to 2022 regardless of what happens in between. Don't let the rocky road take your eyes off the prize that crypto and Bitcoin were made for just such an occasion that we are currently in and surely Crypto did not just show up and pass out early at its own party.
As XTZ reaches the bottom of this channel we can see that the relative strength index has entered an area in which 4 times in the past has called the bottom right before a large rally to the top of this channel.
I hope you enjoyed todays Technical Analysis and would really like to discuss your opinions in the comments below. Let me know what you think about the political news in America with Biden pushing regulation on the crypto space and what you believe the impact of this will be.
Clear your head of the noise and read the story the chart is telling you.
Savvy

Tezos AAMITezos as a market indicator. Blood . FEAR. I even finding myself second guessing my decisions. That is usually around the time its best to be accumulating and buying in more. Not selling hard or shorting at these levels. Too much risk. I do expect another test of the 30k level and even possible to see a full capitulation to 25k on BTC. Overall i'm sitting comfy in $LUNA with 95 percent of my holdings, have been since it crashed to 4 dollars in May and averaged about 5-6 dollars. Pays everyday to hold one of the most powerful cryptos in history. Also still holding alot of Mars Colony plots and they are printing money everyday. I make more off my Mars Colony land tn I did working a 9-5 grind. Buying $JEWEL dip at 7 bucks and still have firepower and daily cash flow to buy whatever. Stay frosty . any of these lows i stated will take time to reach . Not short term. NEVER BEEN A SHORT TERM TRADER AND ALL IDEAS ARE MID?LONG TERM. let me specify so the clowns dont start yapping again. My outlooks are 2weeks-and looking out 5=10 years. Gamefi/metaverse?LUNA?HARMONY ONE. Buy dips , sell resistance if you are scared. Have dry powder and daily cash flow. Stay on your toes for any new Metaverse like Ragnarok coming soon. Sorry Tezos moonboys i do not use Tezos for anything but helping form an idea. could i be wrong of course. But historically this is a buy signal here.

Trading Signal For XTZUSDT Tezos Trading Signal:
There is a Trading Signal to Buy in XTZUSDT Tezos .
Traders can open their Buy Trades NOW
Rank : ⭐️⭐️
⬆️Buy now or Buy on 2.80
⭕️SL: Close below 2.45
🔵TP1 @ 3.50
🔵TP2 @ 4.15
🔵TP3 @ 5.35
If you liked our ideas, please support us with your likes 👍 and comments

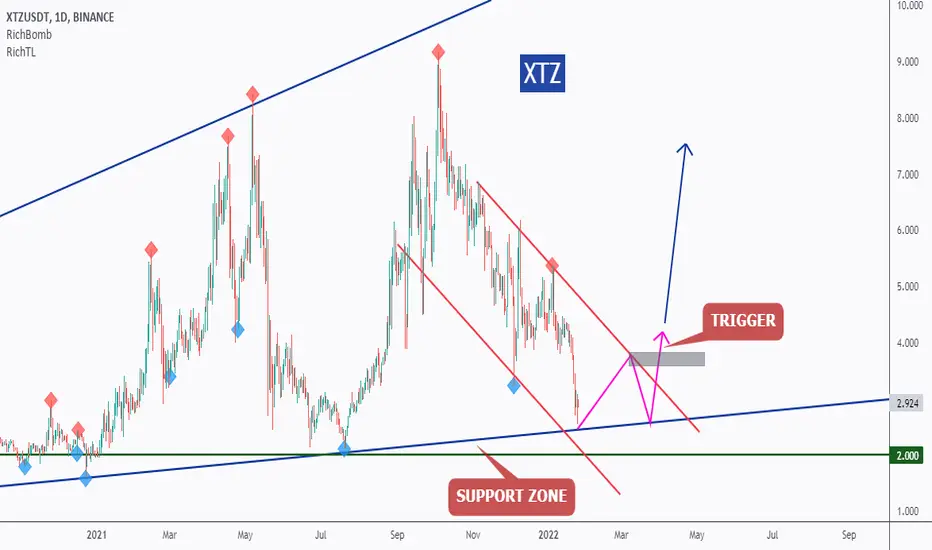
XTZ - Long-Term Bullish Reversal!Hello everyone, if you like the idea, do not forget to support with a like and follow.
XTZ is approaching a strong support so we will be looking for buy setups.
on DAILY: XTZ is forming a channel but the upper trendline is not valid yet, so we are waiting for a new swing high to form around it to consider it our trigger swing. (projection in purple)
Trigger => Waiting for that swing to form and then buy after a momentum candle close above it (gray zone)
Meanwhile, until the buy is activated, XTZ would be overall bearish can still trade lower inside the green.
Good luck!
All Strategies Are Good; If Managed Properly!
~Rich
High Risk XTZUSDT Long ScalpHigh Risk XTZUSDT Long Scalp. Targets on the chart. 10x leverage, sl is liquidation. This is a pullback entry. Limit order pull back in green.
