YFIUSDT.P trade ideas


YFIUSDT SHORT TERM BEARISH LONG TERM BULLISH 1D TFHello!
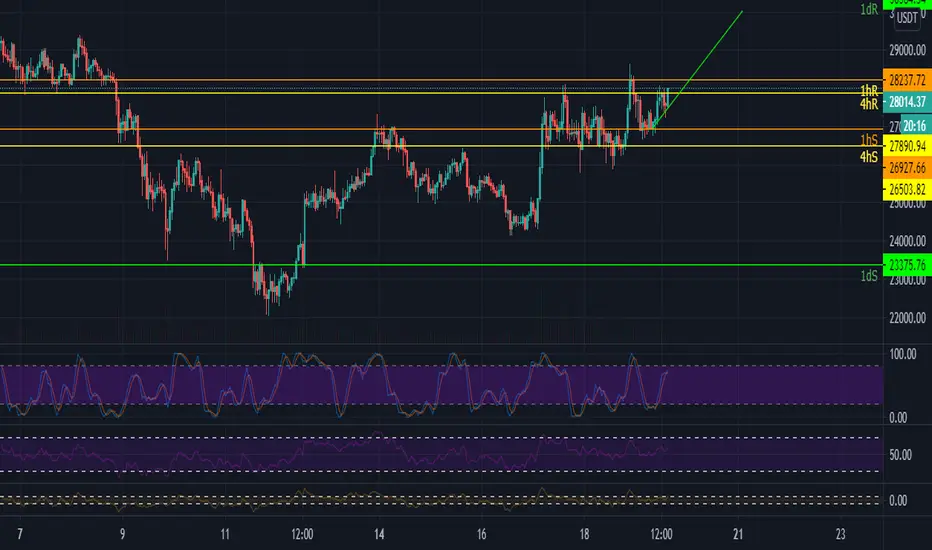
CUP & HANDLE did not work out for YFIUSDT that I mentioned in my previous chart. If you zoom out a little bit to see wider picture, then something this might be forming for YFI.
SUPPORT/RESISTANCE marked with blue. These are level to watch for scalp trading.
Good luck.


YFI Coin - Potential Inverse Head & Shoulder's Bottom PatternNeckline coming in around $31,300. It's still a bit away, but based on the hourly chart, we should rally to at least the neckline. If we break $31,300, it's off to the races. $56,470 would be price objective for the H&S pattern, but we would at least get to the previous ATH of $43,937.

YFI-4h. The next target - $31000.Our previous YFI idea from December 10 worked out .
The sellers managed to break the $23,300 mark and test the lower trend line of the falling channel.
However, there was clearly not enough strength to test the $21,000 mark. As a result, buyers quickly returned the price to the critical point of $26,700-27300.
Buyers manage to establish themselves in this price range.
Therefore, the medium-term dynamics of price movements indicates a test mark of $31,000 in the near future.
The global target is $44,000, but more on this in our next medium-term idea.
_____________________________
We create both short-term ideas (for a local understanding of the market situation) and medium-term forecasts of price movements.
Subscribe to us and get daily concise analytics!


YFIUSDT $34000 Long TargetLooking at the 12-hour of YFI, its at a crucial decision point on the verge of a breakout. If this breaks out of this downtrend to the upside, YFI is going to hit $30,000 and beyond to the moon 🌙
The downtrend is formed from the ATH at $43,562 down to the most recent swing high at $30,000. YFI has been creating higher highs and higher lows, both common signs of bullish momentum. There is a very good chance with the recent price of Bitcoin that YFI will follow suit and break out of this downtrend. Here are my TP levels going up:
TP1 🎯 $30000
TP2 🎯 $32299
TP3 🎯 $34835
Eventually after YFI finds support at $34825, its going to come up and retest its previous-ATH at $43,562.
Cheers traders let me know your thoughts

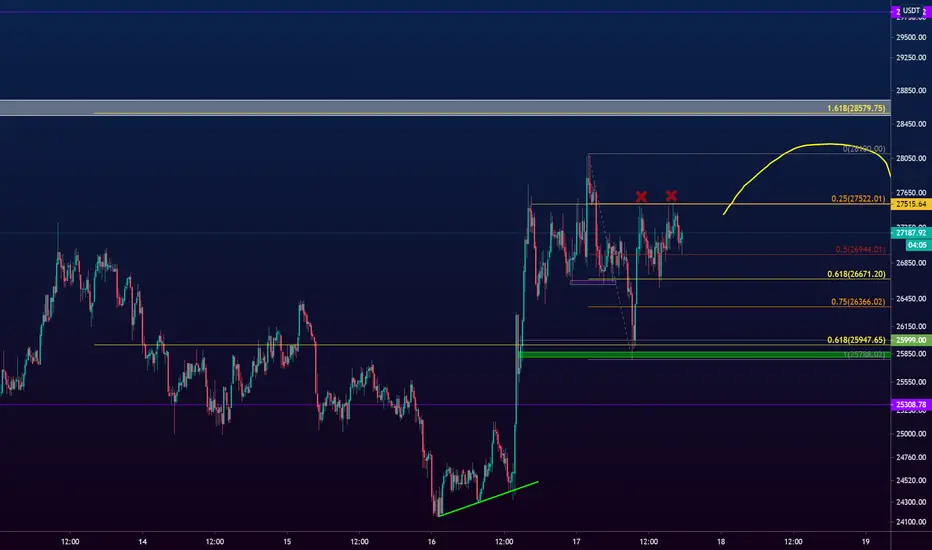
YFI/USDTPERP - LONG - Potential 17.65%***NEW TRADE SET UP"**
YFI/USDTPERP - LONG - Potential 17.65%
Optional Leverage: 3X
Entry- 27014
TP1(75%) - 29410
TP2- (25%) - 31782
SL- 24109
- BTC at strong point of resistance rejection possible - High Risk Trade with Small Targets/Risk
- RR - 1.64
- Trailing Buy - 0.5%
- Trailing Profit - 1%
- Trailing Stop-Loss - No


YFI 12/17/2020: The BTC's competitor in price and in gains only.Note: NOT A FINANCIAL ADVICE TO BUY/LONG OR SELL/SHORT
_____
Since, Bitcoin is aiming higher. Well, this coin will follow too.
Previous TA is in the related ideas below.
Check it.
_____
Technical Analysis
1D
In order to confirmed it a larger Wave 3. YFI must break the 0.618 - 0.650 Fibonacci & $ 32,856.40. But Right now, it has indications of realizing this larger wave 3. As you see on RSI, Stoch RSI and MACD, it favors the bulls due bullish divergence.
4HR
The same as 1D
1HR
Bearish Convergence. Just a pullback to support.
Others
There is a higher probability that the price has bottomed as it bounced to 0.382 Fibonacci Level but it needs to break the 0.618 - 0.65 Fibonacci & $ $ 32,856.40. So, a price range of $ 30,000.00 to $ 33,000.00 need to be broken.
_____
Note: NOT A FINANCIAL ADVICE TO BUY/LONG OR SELL/SHORT

YFI Breaks out H&S completes and YFi breaks out of falling wedge.
Currently it is stuck between a resistance cluster. We can expect to see a breakout soon.
Bullish Indication:
Break out of falling wedge
Potential Bullish EMA Crossing
MACD bullish crossing
Never over leverage any trade you enter!
Full trade setup & Trading Bot
👇👇

✳️Yearn.Finance/USDT Analysis (14/12) #YFI $YFIYFI is still fluctuating in a wide range of 20000-30000$ and has yet to determine its next trend.
It is still too early for YFI to initiate a downtrend because the November's rally is so strong that it will easily continue this December. Just surpassing the 28000-29000$ zone, YFI can completely increase to 40000$.
However, one thing we need to keep in mind is that the volume of YFI when oscillating at this top zone is decreasing and could form a Diamond pattern if YFI loses the 24000-25000$ zone, and it will fall to 18000$ zone.
📈BUY- LONG
-Buy: 24000-25000$. SL B
📉SELL-SHORT
-Sell: 28000-29000$. SL A
-Sell: 38000-40000$. SL A
♻️BACK-UP
-Sell: 24000-25000$ if B. SL A
-Buy: 18000-19000$. SL B
❓Details
Condition A : "If 1D candle closes ABOVE this zone"
Condition B : "If 1D candle closes BELOW this zone"
