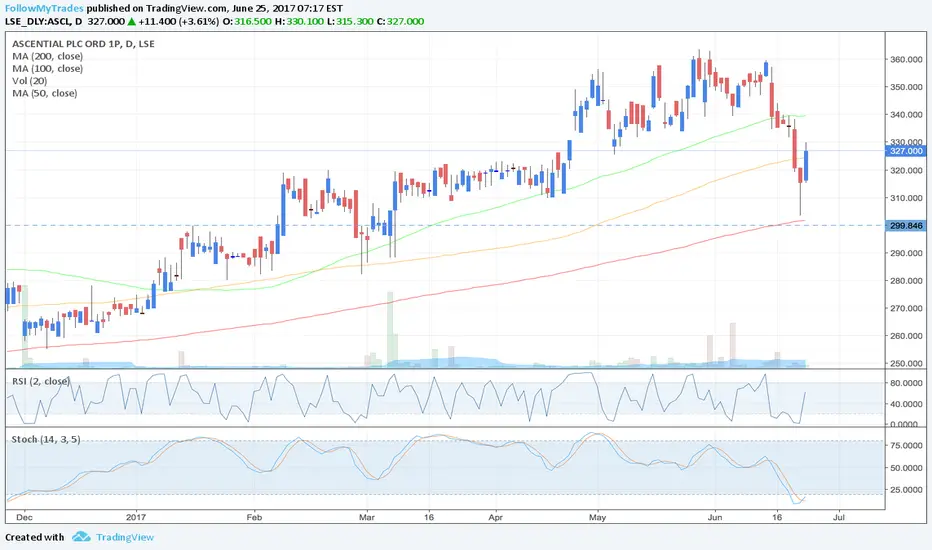
ASCL - Possible longLooking at a possible long on ASCL. We saw strong rejection from just above the 300 area which coincides with the 200ma. Financials look good. The only concern I have is the move up was on weak volume, could be a bull trap so ideally I want to see a further move up on high volume.
The perfect scena
Next report date
—
Report period
—
EPS estimate
—
Revenue estimate
—
−243.78 MUSD
262.75 MUSD
200.01 M
About ASCENTIAL PLC ORD GBP0.017
Sector
CEO
Philip Owain Thomas
Website
Headquarters
London
Employees (FY)
700
Founded
2016
ISIN
GB00BQFH6320
FIGI
BBG00MV523Y9
Ascential Plc engages in the provision of specialist information, analytics and e-commerce optimisation platforms. It operates through the following geographical segments: Digital Commerce, Product Design, Marketing, Retail and Financial Services, and Corporate. The Digital Commerce segment involves in measurement, optimization, and execution for digital commerce growth. The Product Design segment consists of consumer product trend forecasting, data, and insight to create products and experiences. The Marketing segment offers services and tools to measure and optimise marketing creativity, media, and platform effectiveness and efficiency. The Retail and Financial Services segment refers to events, data, and tools to improve performance and drive innovation in retail and financial services. Its products are offered through the Flywheel, EDGE, Yimian, WGSN, Use Fashion, Coloro, LIONS, WARC, and MediaLink brands. The company was founded in1947 and is headquartered in London, the United Kingdom.
Trade directly on the supercharts through our supported, fully-verified and user-reviewed brokers.


Frequently Asked Questions
The current price of AIAPF is 4.29 USD — it has decreased by 36.91% in the past 24 hours. Watch Ascential Group Ltd. stock price performance more closely on the chart.
Depending on the exchange, the stock ticker may vary. For instance, on OTC exchange Ascential Group Ltd. stocks are traded under the ticker AIAPF.
AIAPF stock has fallen by 36.91% compared to the previous week, the month change is a 36.91% fall, over the last year Ascential Group Ltd. has showed a 24.67% decrease.
We've gathered analysts' opinions on Ascential Group Ltd. future price: according to them, AIAPF price has a max estimate of 5.49 USD and a min estimate of 3.30 USD. Watch AIAPF chart and read a more detailed Ascential Group Ltd. stock forecast: see what analysts think of Ascential Group Ltd. and suggest that you do with its stocks.
AIAPF reached its all-time high on Jul 22, 2021 with the price of 10.34 USD, and its all-time low was 4.11 USD and was reached on Sep 8, 2022. View more price dynamics on AIAPF chart.
See other stocks reaching their highest and lowest prices.
See other stocks reaching their highest and lowest prices.
AIAPF stock is 58.51% volatile and has beta coefficient of 1.00. Track Ascential Group Ltd. stock price on the chart and check out the list of the most volatile stocks — is Ascential Group Ltd. there?
Today Ascential Group Ltd. has the market capitalization of 876.49 M, it has increased by 1.37% over the last week.
Yes, you can track Ascential Group Ltd. financials in yearly and quarterly reports right on TradingView.
Ascential Group Ltd. is going to release the next earnings report on Jul 22, 2024. Keep track of upcoming events with our Earnings Calendar.
As of Jun 19, 2024, the company has 700.00 employees. See our rating of the largest employees — is Ascential Group Ltd. on this list?
Like other stocks, AIAPF shares are traded on stock exchanges, e.g. Nasdaq, Nyse, Euronext, and the easiest way to buy them is through an online stock broker. To do this, you need to open an account and follow a broker's procedures, then start trading. You can trade Ascential Group Ltd. stock right from TradingView charts — choose your broker and connect to your account.
Investing in stocks requires a comprehensive research: you should carefully study all the available data, e.g. company's financials, related news, and its technical analysis. So Ascential Group Ltd. technincal analysis shows the sell today, and its 1 week rating is strong sell. Since market conditions are prone to changes, it's worth looking a bit further into the future — according to the 1 month rating Ascential Group Ltd. stock shows the strong sell signal. See more of Ascential Group Ltd. technicals for a more comprehensive analysis.
If you're still not sure, try looking for inspiration in our curated watchlists.
If you're still not sure, try looking for inspiration in our curated watchlists.