Hi All,
I have been looking at what is likely to happen next with BTC price action and I thought this time, I start it off with the BTC CME chart (FUTURES chart) this time.
OBSERVATIONS and THOUGHTS:
======================================
NOTE: many of the things outlined here were mentioned or shared in my previous posts and now I believe its confirmation to it.
There is also other developments that need to be considered or factored into the equation, eg US dollar index.
> As I stated in the past, I had a major pullback happening around to this level, and I was somewhat near it, but what ever it was we would then acknowledge it as wave 5 complete and the ABC correction is taking place.
> The ABC correction will take us below 10K for the last time for a long time, this will happen on this current wave, as per my chart and post below.
The below post is still valid as to what I see happening at the macro level (and its charts extracted from it).
> Now we have a bounce target here which is ranging from 10850 to 11200, but this is conditioned based along with the USD and SP500\and Gold.
> I see impulse C near the apex of the ascending triangle we had a month ago (rangeing from 9k to 10.5k) were we spent months in it. Hence why its a strong support area one would think.
Using the volume tool, I have this range as per the chart. Anything below this, will make the MACRO chart bearish and then its likely we can visit 7k to 8k. At this point, I see this less likely but who knows. I would need to see the daily and weekly indicators to make a judge then.
> For now the CME gap was not filled and its likely it will with B to C impulse.
> Many of the DEFI alts will likely drop to the same level as now if this happens, making it a double bottom and for those that bounced well, a fib higher.
======================================
Now some factors that can influence the stock market and BTC.
> USD pricing, hence the chart below. To summarise, if the USD rallies up, its likely that the stock market and crypto will drop more than expected. If its long term rally.
If it drops more, its good news for the stock market and crypto.
> I'm a follower of Alessio and he says the following: hence I agree with him and a few others who share the same thoughts. As per the chart, its my idea although people could have similar or alike.
Alessio tweets
#Bitcoin has been following our script exactly! Back in June I called for a move higher from 9K to 12K (in the Summer), then a DROP back BELOW 10K by September-October, and then finally a move significantly higher as we start the new year (2021). OHH YEAAH! CHICKA CHIKA!
The stock market has been the BEST predictor of #USElections . Right now, it's likely bad news for our current President, as the market is down over 5% in Sept. Remember that a >5% drop in the months of Sept-Oct in a RECESSION is statistically a negative sign for the incumbent.
Two weeks ago I told you that IF the stock markets drop by 5% or more in the 2 months before the #USElections , specially during a RECESSION, then it is usually BAD news for the incumbent President. Examples are: 2008, 2000, 1992, 1980 etc. Therefore... (Part 1/2)
Please give me a like or tick for this post;
Cheers,
S.Sari
 My key levels
===============================================================================================
PREVIOUS POSTS
Within this post I had this chart, and I'm still of this mind
Then this as the overall picture
===============================================================================================
USD PRICE INDEX
YESTERDAYs on the SP500
I have been looking at what is likely to happen next with BTC price action and I thought this time, I start it off with the BTC CME chart (FUTURES chart) this time.
OBSERVATIONS and THOUGHTS:
======================================
NOTE: many of the things outlined here were mentioned or shared in my previous posts and now I believe its confirmation to it.
There is also other developments that need to be considered or factored into the equation, eg US dollar index.
> As I stated in the past, I had a major pullback happening around to this level, and I was somewhat near it, but what ever it was we would then acknowledge it as wave 5 complete and the ABC correction is taking place.
> The ABC correction will take us below 10K for the last time for a long time, this will happen on this current wave, as per my chart and post below.
The below post is still valid as to what I see happening at the macro level (and its charts extracted from it).
> Now we have a bounce target here which is ranging from 10850 to 11200, but this is conditioned based along with the USD and SP500\and Gold.
> I see impulse C near the apex of the ascending triangle we had a month ago (rangeing from 9k to 10.5k) were we spent months in it. Hence why its a strong support area one would think.
Using the volume tool, I have this range as per the chart. Anything below this, will make the MACRO chart bearish and then its likely we can visit 7k to 8k. At this point, I see this less likely but who knows. I would need to see the daily and weekly indicators to make a judge then.
> For now the CME gap was not filled and its likely it will with B to C impulse.
> Many of the DEFI alts will likely drop to the same level as now if this happens, making it a double bottom and for those that bounced well, a fib higher.
======================================
Now some factors that can influence the stock market and BTC.
> USD pricing, hence the chart below. To summarise, if the USD rallies up, its likely that the stock market and crypto will drop more than expected. If its long term rally.
If it drops more, its good news for the stock market and crypto.
> I'm a follower of Alessio and he says the following: hence I agree with him and a few others who share the same thoughts. As per the chart, its my idea although people could have similar or alike.
Alessio tweets
#Bitcoin has been following our script exactly! Back in June I called for a move higher from 9K to 12K (in the Summer), then a DROP back BELOW 10K by September-October, and then finally a move significantly higher as we start the new year (2021). OHH YEAAH! CHICKA CHIKA!
The stock market has been the BEST predictor of #USElections . Right now, it's likely bad news for our current President, as the market is down over 5% in Sept. Remember that a >5% drop in the months of Sept-Oct in a RECESSION is statistically a negative sign for the incumbent.
Two weeks ago I told you that IF the stock markets drop by 5% or more in the 2 months before the #USElections , specially during a RECESSION, then it is usually BAD news for the incumbent President. Examples are: 2008, 2000, 1992, 1980 etc. Therefore... (Part 1/2)
Please give me a like or tick for this post;
Cheers,
S.Sari
PREVIOUS POSTS

Within this post I had this chart, and I'm still of this mind
===============================================================================================
USD PRICE INDEX
YESTERDAYs on the SP500
Comment:
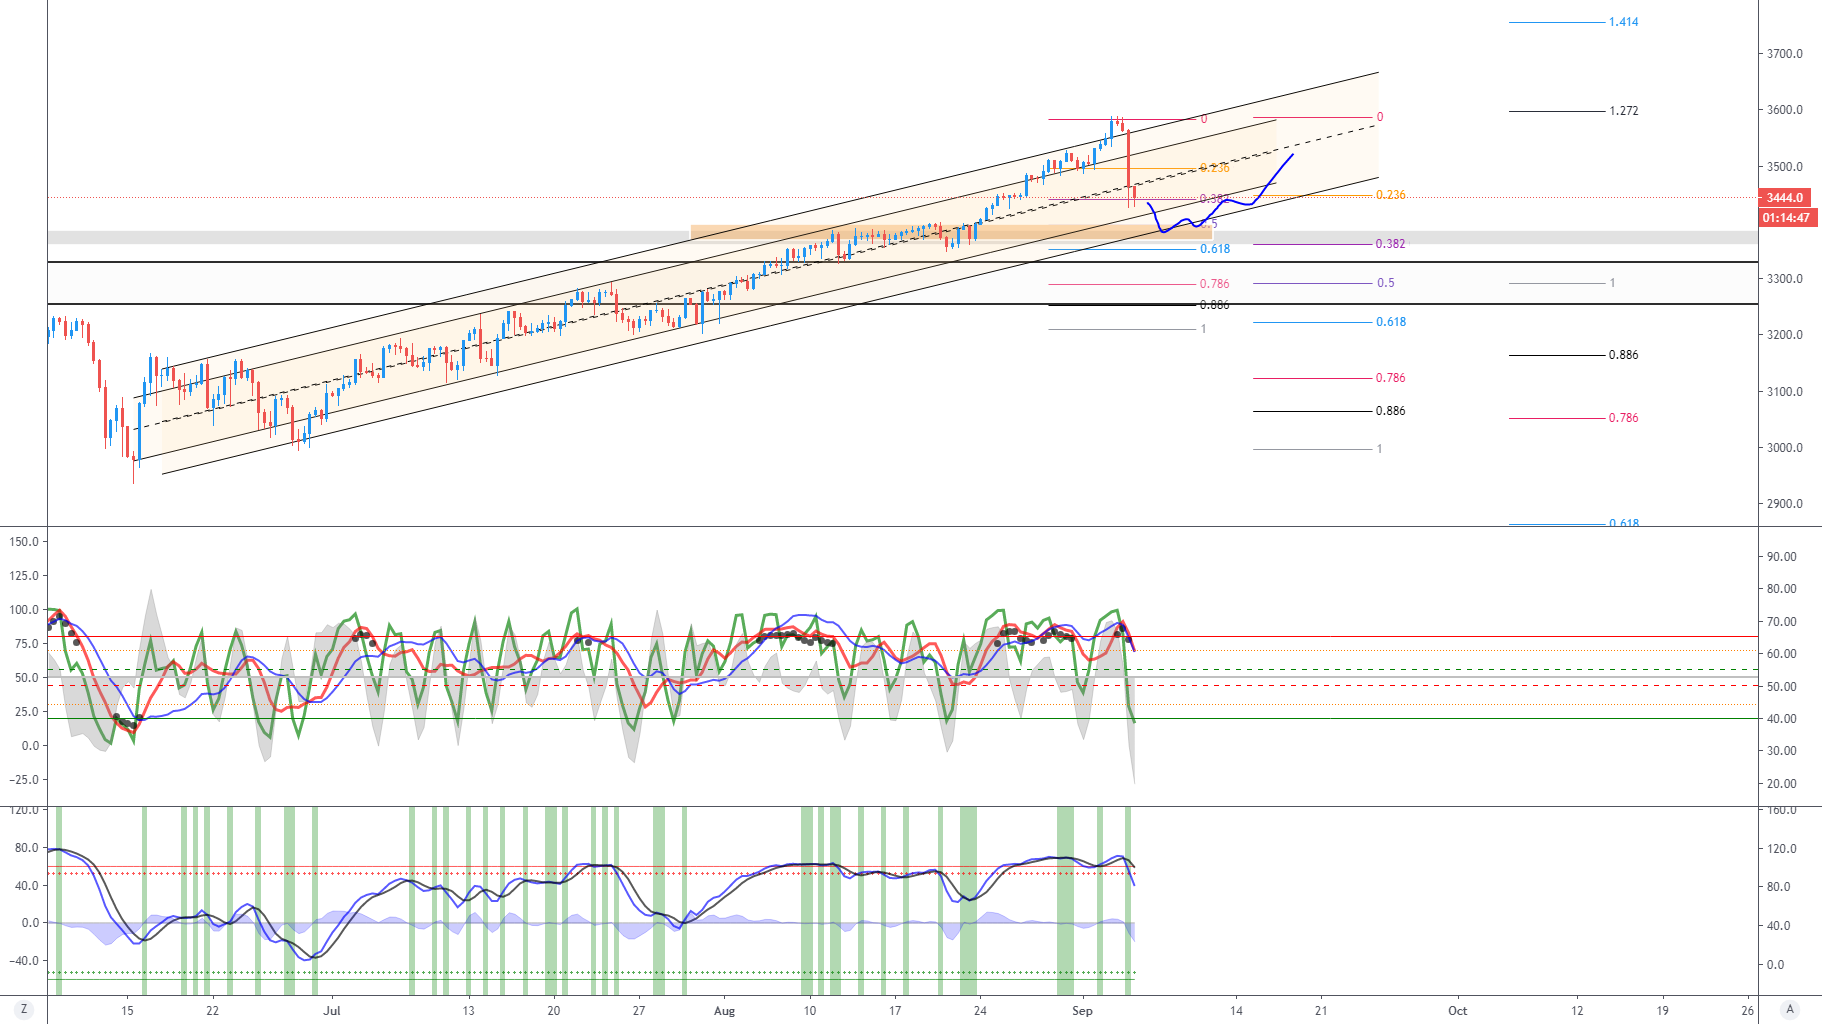
A bullish scenario with a broadening wedge in play. But we must note that it is highly likely that the SP500 will have a deeper correction in the coming days, weeks, months.
Comment:
RSI supports the case for more downward pressure; Question is where will it find the important support for the next rally? Personally the SP500 makes this difficult.
Comment:
A bit of re-lief coming our way.
Comment:
SP500 is not stopping so my guess will be similar for BTC and the ALTS.
Comment:
Comment:
Another observation: If BTC holds this particular line, it will be a hidden bullish divergence. I still am waiting at the green zone for that wick to clear the CME gap and possibly lower, which is bearish, but it could also be a method to shake the weak hands. Patience.
Comment:
Going to simplicity, we have the CME chart, we have here the levels and the CME gap.
It is likely that we will continue seeing anything below 10k bought up and potentially see this CME gap closed and eventually in this 9K range, we see the bottom, and it looks like a potential long time here. No quick movements.
It is likely that we will continue seeing anything below 10k bought up and potentially see this CME gap closed and eventually in this 9K range, we see the bottom, and it looks like a potential long time here. No quick movements.
Comment:
Looking hopefully bullish, SP500 as well.
Comment:
Discord: TradeToProspa
Telegram: t.me/TprospaTradersbot
This community has signals now but with no risk management comms.
Telegram: t.me/TprospaTradersbot
This community has signals now but with no risk management comms.