BITCOIN WEEKLY FORECAST [Soon We Will See a Big Movement]
Hello!
Welcome to my weekly forecast, if You find it is helpful then do not hesitate to hit the LIKE button!
Go...
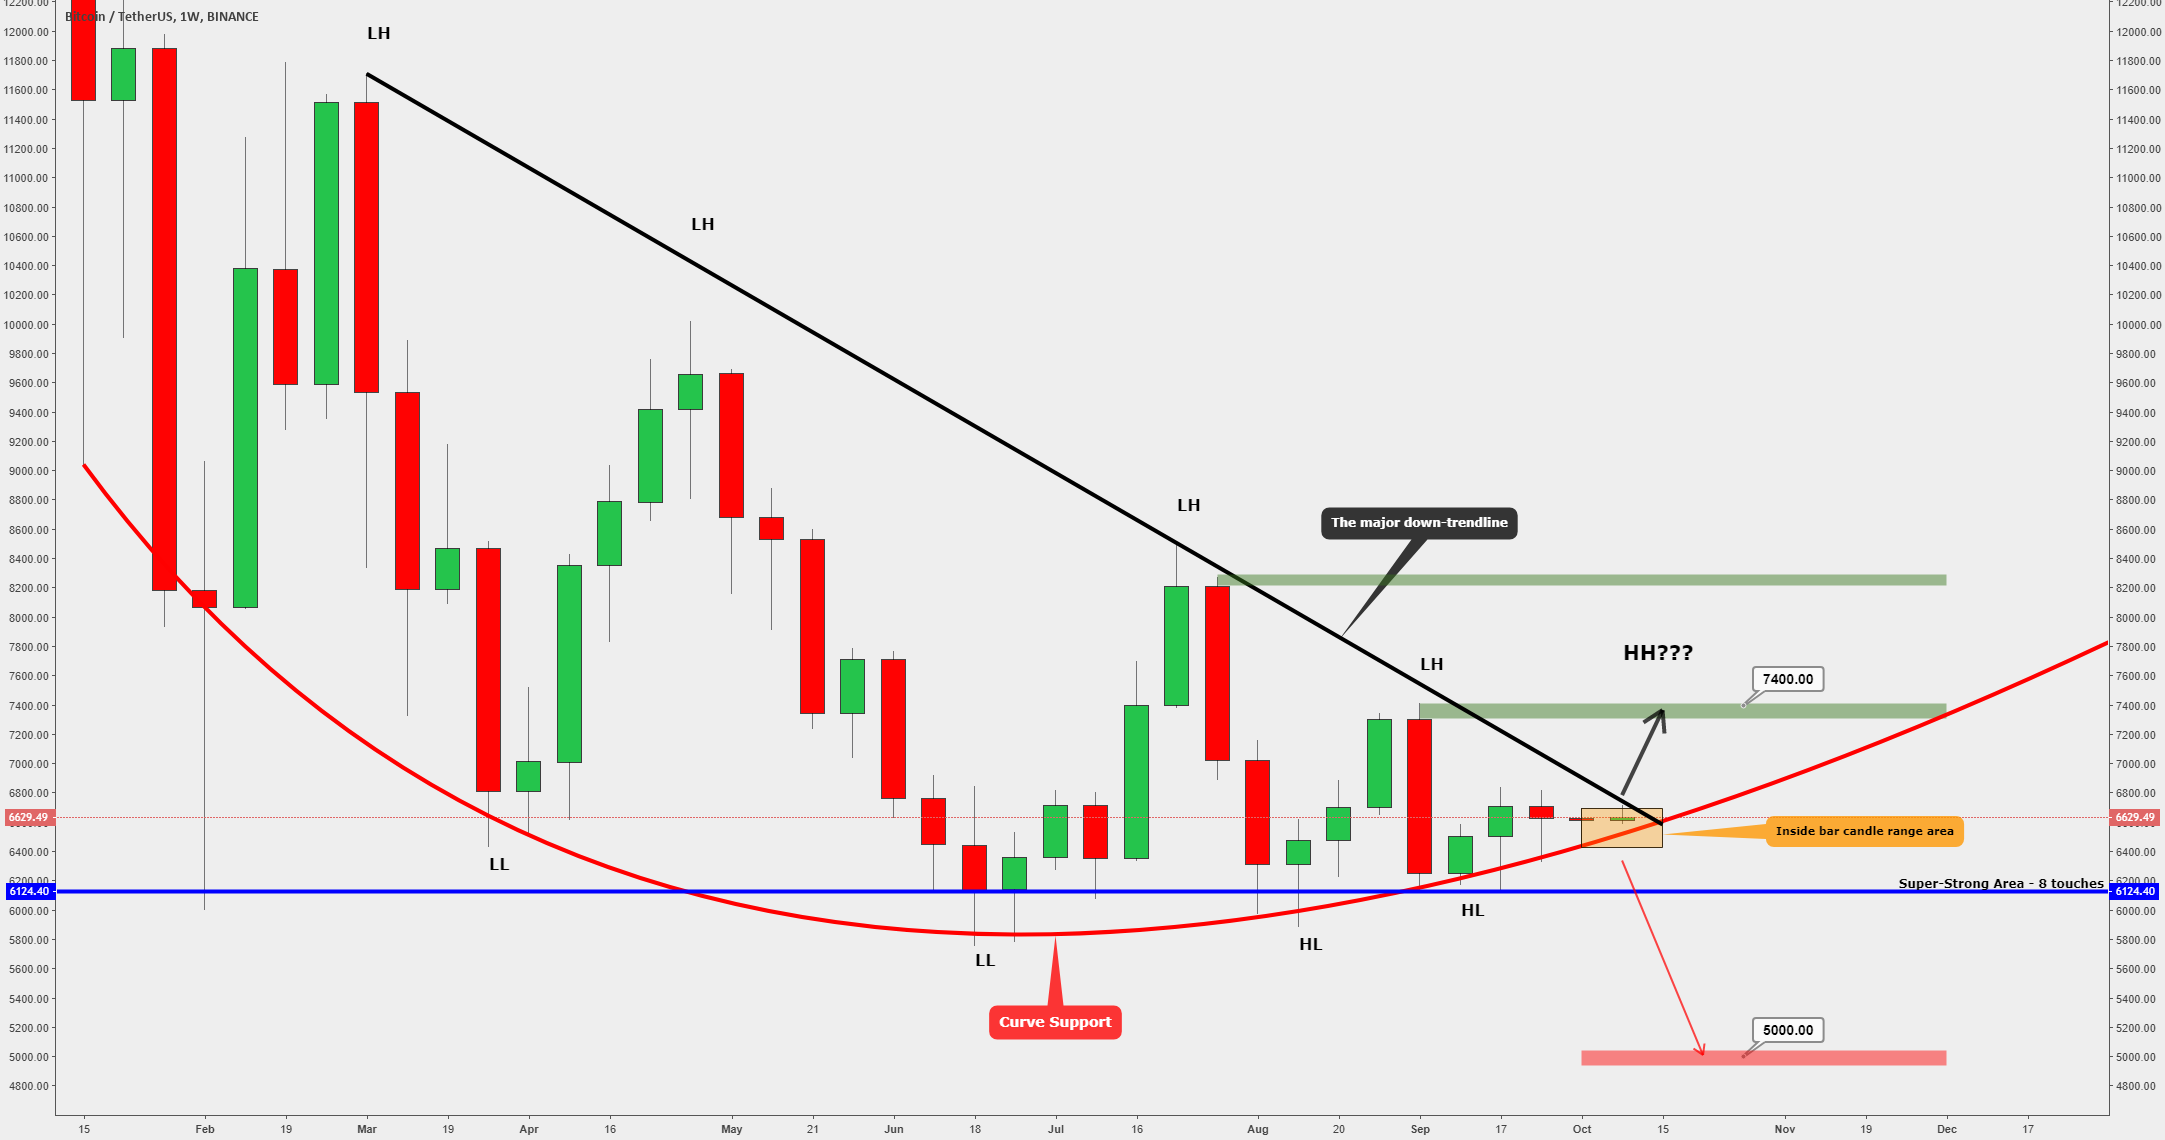
 Let's start from the weekly time frame. In the picture above we have a nice curve support line which has held the price through the time. It starts from this year February and now we have touched this multiple times over the last weeks. Previously when the price has approached the trendline it has rejected pretty quickly and sharply downwards and after that, when the price has touched the curve support line we have bounced upwards pretty quickly, but currently, we wait for something and this something is the momentum with the volume. I would like to say that this week we definitely see the bigger movement because of the price approaching the crossing area and it is ready to make a breakout to either direction but which direction is more favorable, to find out we need to watch also the shorter time frames but firstly if you look at the weekly time frame then you can see that the last three weeks the price has bounced upwards from the round number at $6,500 which works very strongly as a support and as I've mentioned before in my last week ideas, then I'm slightly more bullish because there are more bullish signs on the shorter time frames.
The four-hour chart (the main 'image')
As you’ve already noticed then we managed to push through the trendline which was the last week major goal. Over the weekend, as usual, the price moved sideways because lately (also historically) the weekends are with just a super-low volume, but luckily this sideways movement brought an important price action movement. In Friday, Bitcoin breaks above the trendline and currently, over the weekend, we made a retest and got a bounce exactly from the trendline which was previously a resistance and now it becomes a support.
To get a move upwards we have to break above the orange line just above the current price. This level has worked multiple times as a resistance and I can assume if this level breaks then this is a first sign to the bullishness but this is just a small step because just above the orange line Bitcoin' has a super-strong resistance and currently the major down-trendline crossing area. As You already know that those crossing areas are very hard to crack and we need a massive volume. As I already mentioned, then this week Bitcoin' makes a move and if the move comes to the upwards then we get that power what guide us through the $6,767 and through the major down-trendline. The first major targets would be around $7,000 and around the $7,300!
In the four-hour chart, the Bitcoin' price trades above the all-important EMA's which is a good sign if we want to see a movement upwards but in the daily chart the price is currently below the 50 EMA which work as a resistance and it matches with the orange line on the four-hour chart so, the orange line is the first short-term level what we have to take down if we want to see bullish BTC'.
Remember, I said that the breakout could be either direction, above the major down-trendline and below the curve support. If we get a daily candle close below the curve support and the round number at $6,500 then those are the major downwards confirmations.
The close gives us several "break below's":
* Break below the curve support
* Break below the round number
* Break below the EMA's
* Break below the minor up-trendlines.
I make everyday updates to hold You informed what could happen next and what the price action shows to us. To be on the market or not to be on the market.
Summary:
If we watch those weekly time frame drops around the major down-trendline then we could say that currently, the price starts to 'think' differently, because we don't have seen stops like this (three weeks around the major trendline without any dump). The four-hour chart shows us some bullish signs as a trendline breakout and the retest, strong support levels at $6,460 and $6,500 has held the price nicely. We could see a correction to the $6,460-$6,500 but we don't want to see any candle close below those levels especially a daily candle close because then the bullish momentum has gone and the possibility that the bears start to control the market is high!
Hopefully, this breakdown helps You out a little bit to confirm Your own analysis!
If You want to see the altcoins reviews, then visit "CryptoComes" profile in the TradingView and do not hesitate to follow it!
Please, don't forget to LIKE!
Thank You for your support!
Have a nice week!
Welcome to my weekly forecast, if You find it is helpful then do not hesitate to hit the LIKE button!
Go...
The four-hour chart (the main 'image')
As you’ve already noticed then we managed to push through the trendline which was the last week major goal. Over the weekend, as usual, the price moved sideways because lately (also historically) the weekends are with just a super-low volume, but luckily this sideways movement brought an important price action movement. In Friday, Bitcoin breaks above the trendline and currently, over the weekend, we made a retest and got a bounce exactly from the trendline which was previously a resistance and now it becomes a support.
To get a move upwards we have to break above the orange line just above the current price. This level has worked multiple times as a resistance and I can assume if this level breaks then this is a first sign to the bullishness but this is just a small step because just above the orange line Bitcoin' has a super-strong resistance and currently the major down-trendline crossing area. As You already know that those crossing areas are very hard to crack and we need a massive volume. As I already mentioned, then this week Bitcoin' makes a move and if the move comes to the upwards then we get that power what guide us through the $6,767 and through the major down-trendline. The first major targets would be around $7,000 and around the $7,300!
In the four-hour chart, the Bitcoin' price trades above the all-important EMA's which is a good sign if we want to see a movement upwards but in the daily chart the price is currently below the 50 EMA which work as a resistance and it matches with the orange line on the four-hour chart so, the orange line is the first short-term level what we have to take down if we want to see bullish BTC'.
Remember, I said that the breakout could be either direction, above the major down-trendline and below the curve support. If we get a daily candle close below the curve support and the round number at $6,500 then those are the major downwards confirmations.
The close gives us several "break below's":
* Break below the curve support
* Break below the round number
* Break below the EMA's
* Break below the minor up-trendlines.
I make everyday updates to hold You informed what could happen next and what the price action shows to us. To be on the market or not to be on the market.
Summary:
If we watch those weekly time frame drops around the major down-trendline then we could say that currently, the price starts to 'think' differently, because we don't have seen stops like this (three weeks around the major trendline without any dump). The four-hour chart shows us some bullish signs as a trendline breakout and the retest, strong support levels at $6,460 and $6,500 has held the price nicely. We could see a correction to the $6,460-$6,500 but we don't want to see any candle close below those levels especially a daily candle close because then the bullish momentum has gone and the possibility that the bears start to control the market is high!
Hopefully, this breakdown helps You out a little bit to confirm Your own analysis!
If You want to see the altcoins reviews, then visit "CryptoComes" profile in the TradingView and do not hesitate to follow it!
Please, don't forget to LIKE!
Thank You for your support!
Have a nice week!
Comment:
Currently, we have a brake above the orange area and the retest! At the moment the price makes an another attempt to the $6767! Let's see, so far the bullish scenario has played nicely! Altcoins are also supporting this move upwards so, currently it is not a fake out!
Please don't forget to hit the LIKE ;)
Thank You for you support and have a nice evening!
Please don't forget to hit the LIKE ;)
Thank You for you support and have a nice evening!
Comment:
Yesterday we got a nice daily candle close. Above my mentioned orange line and above the 50 EMA. Those criteria were our first obstacles what we had to take down if we can climb to the higher levels.
The Hammer candlestick pattern, which we got after the price bounced up from the trendline since 24. July, worked nicely and the momentum guides us through the first obstacles.
Highest October candle closing at $6,672 and it confirms that the current momentum is bullish.
Currently, altcoins show us mixed signs, some of them are on the green some of them are on the red side but this move what we got yesterday through the orange area it doesn't look like a fake out because of yesterday, the altcoins were also on the plus side and altcoins follow up confirms that bullish momentum what is currently on the market!
Comment:
BITCOIN MEDIUM-TERM ANALYSIS:
Hopefully, You enjoy it!
Currently, on the mentioned orange area and the correct breakout has not happened but still we have a buying pressure (highest candle closes).
Altcoins are following this move (most of them are in the green side) and looks like the breakout can succeed!
I keep You posted!