BITCOIN DEJA VU ? Corrective fractals Feb18-Feb19/Jul-Oct19 v.3
Corrective fractals visualized with colours & shapes for easier recognize.
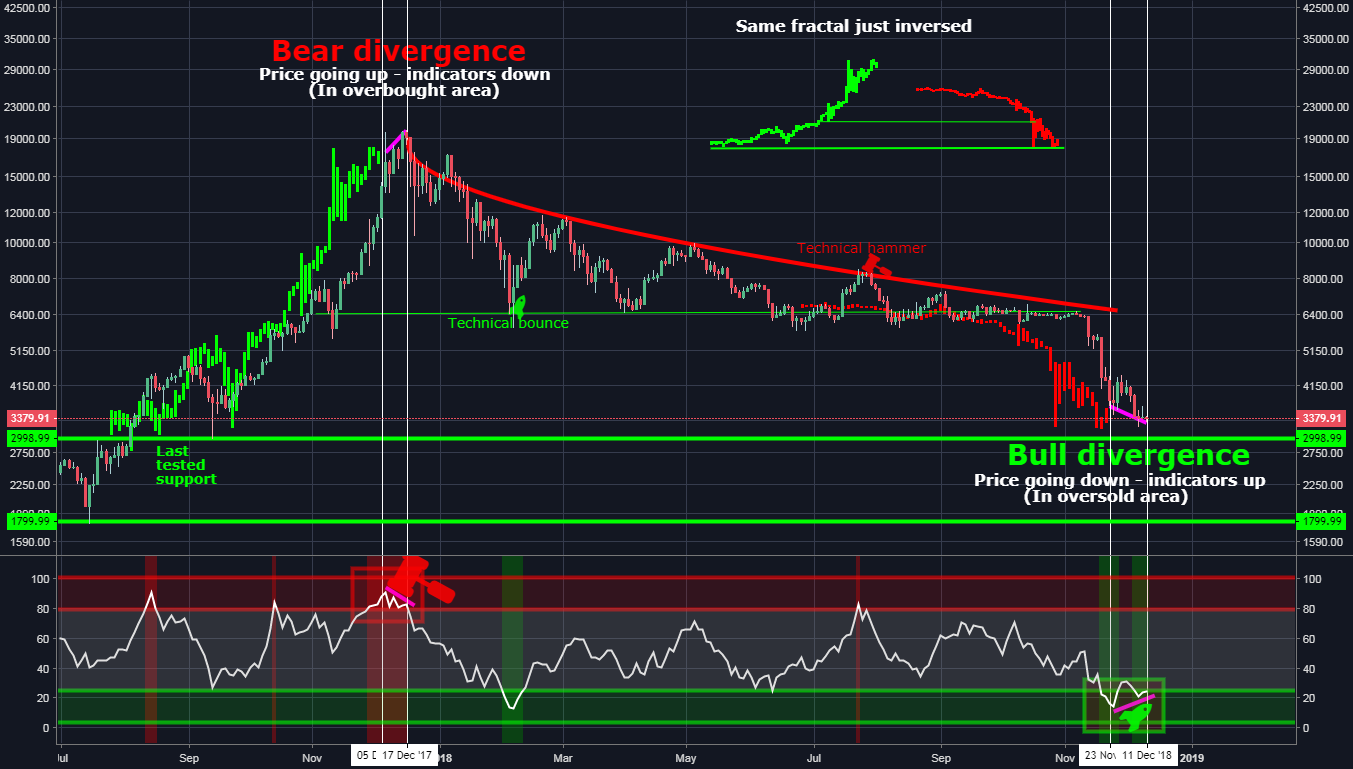
Lets make it simple here. I think that fractal which played on left side of the screen (2D timeframe chart) from Feb 2018 to Feb 2019 (365 days) is very similar to current one on the right side of the screen (12H timeframe) from Sep 2019 to Oct 2019 (60days)
If history repeats itself here. Bitcoin is heading up towards 10-13K EOY
So far the fractal fits perfectly. Lets see and track how it will play out.
TRADE & ENTRY idea provided here:

If you have any questions to dont hesitate to leave a comment below the chart
&
If you LIKE this work please take your time to give one to this chart so I know its worth sharing this kind of IDEA with you in PUBLIC for FREE
****
This is closer study of long term fractals
*****
MOOVING AVERAGE ANALYSIS
TECHNICAL ANALYSIS
FRACTALS ANALYSIS
TREND ANALYSIS
WAVE ANALYSIS
+
INDICATORS
** Not a financial advice or trading signal, trade this study on your own risk. Your capital is in risk **
Lets make it simple here. I think that fractal which played on left side of the screen (2D timeframe chart) from Feb 2018 to Feb 2019 (365 days) is very similar to current one on the right side of the screen (12H timeframe) from Sep 2019 to Oct 2019 (60days)
If history repeats itself here. Bitcoin is heading up towards 10-13K EOY
So far the fractal fits perfectly. Lets see and track how it will play out.
TRADE & ENTRY idea provided here:

If you have any questions to dont hesitate to leave a comment below the chart
&
If you LIKE this work please take your time to give one to this chart so I know its worth sharing this kind of IDEA with you in PUBLIC for FREE
****
This is closer study of long term fractals

*****
MOOVING AVERAGE ANALYSIS
TECHNICAL ANALYSIS
FRACTALS ANALYSIS
TREND ANALYSIS
WAVE ANALYSIS
+
INDICATORS
** Not a financial advice or trading signal, trade this study on your own risk. Your capital is in risk **
Comment:
Comment:
If you want to deep diver into divergence trading I would recommend you to take a look at this chart
Anonymous investor teaches how to master the game towards PERSONAL GRADUAL GROWTH4FREE
IF YOU LIKE MY WORK, THEN PLEASE CONSIDER GIVING A THUMB UP TO SUPPORT ME & hit follow so you dont miss any of my new ideas.
Thanks
IF YOU LIKE MY WORK, THEN PLEASE CONSIDER GIVING A THUMB UP TO SUPPORT ME & hit follow so you dont miss any of my new ideas.
Thanks