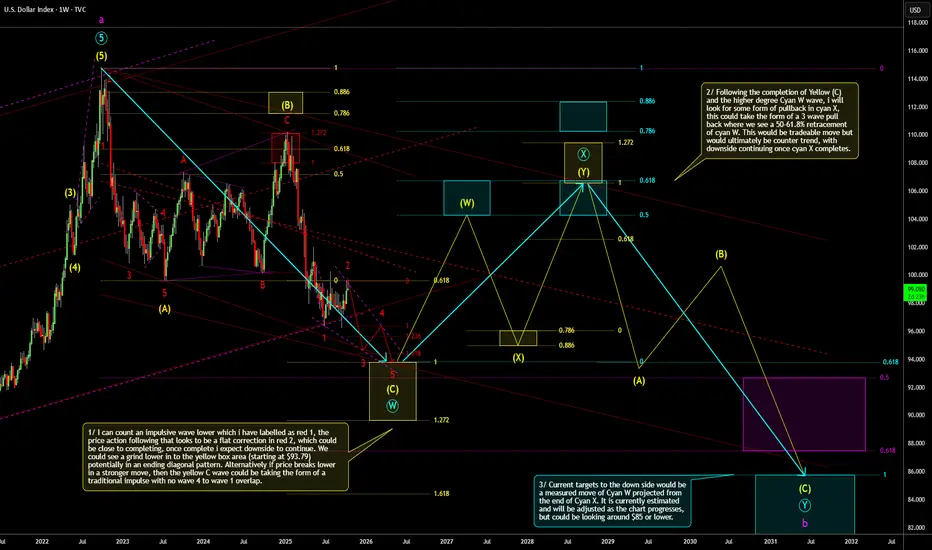
This is a weekly timeframe outlook of the  DXY . This is in alignment with my previously posted outlook which so far is playing out close to how I expected. This shows the wider view of what I think could be playing out. Still targeting the same yellow zone for a potential termination of the yellow (C) wave, after which we could see a counter trend consolidation. Current price action on the lower timeframe looks like it is forming a bearish flat correction which could be wave 2 in red. I'll look get a lower time frame update together, when time allows. More comments on the chart.
Note
This is the daily timeframe update on the above weekly outlook.I'm looking for the ending diagonal pattern to continue lower towards the red and yellow target zones at around 93.8. As mentioned on the chart, if we see price decline in a traditional impulse with no overlap between wave 4 and 1 then the measured move target will be surpassed.
I have a short trade shown on the DXY chart but this is only indicative of the move I expect, I am instead long EURUSD which moves inversely to the DXY. More comments on the chart.

Note
12/11/2025 Update1 hour consolidation on DXY is potentially a running flat or could push higher in to an expanded flat towards the 161.8% extension before selling off. The daily indicators aren't yet confirming the bearish case, however the weekly 4hr and 1hr indicators do look setup for a bearish move.
I have added another long trade on EURUSD, time of entry is shown on the DXY chart with the indicative trade.
Related publications
Disclaimer
The information and publications are not meant to be, and do not constitute, financial, investment, trading, or other types of advice or recommendations supplied or endorsed by TradingView. Read more in the Terms of Use.
Related publications
Disclaimer
The information and publications are not meant to be, and do not constitute, financial, investment, trading, or other types of advice or recommendations supplied or endorsed by TradingView. Read more in the Terms of Use.