Invalidation H&S ETH confirmed, what's next? Part 2
ETH has been quite strong the past week, showing some real conviction here from the bulls. When looking at the Bitmex chart, we can see volume has increased a lot as well, confirming the bullish movement. Seems this market is changing a bit, at least where the pro's are trading. I talked about this in Dec a several times, now it looks to be more obvious even. While Bitcoin is going towards the 2018/19 volume lows, ETH' is going towards the highs. As far as i know, there is nothing fundamental known (at least not us/me) that justifies this, so the only conclusion i can give this is, ETH' is a new toy for the pro's to play with. So just a confirmation of my suspicions of the past month or 2.
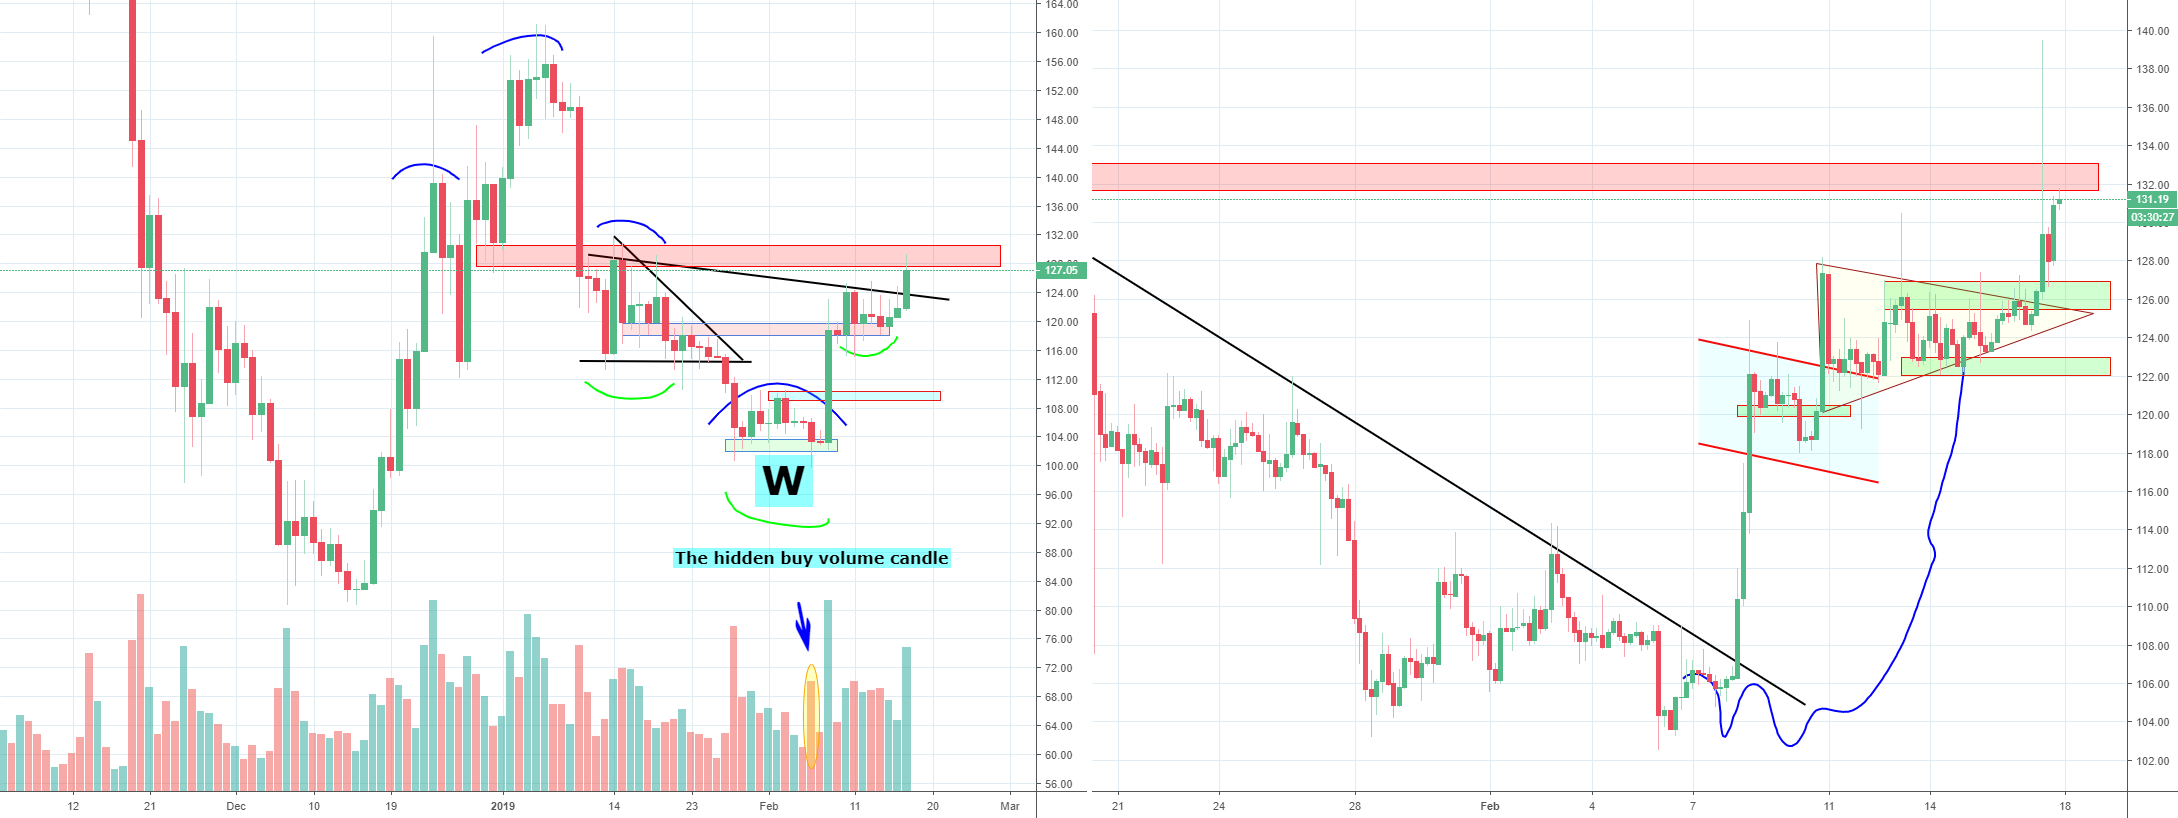
Anyway, on the left we can see how it stayed above that bull flag i drew a week ago. It only made a big wick inside of it because of that ugly Bart move Bitcoin' did earlier this week. Since that was clearly noise when looking at this chart, we can see a lot of strength now in ETH. The past week, inside of that triangle on the right, it started to show some bearish signs on the lower time frame, but the bulls stepped up and held their ground. The bears are clearly giving up here and based on the volume, i think the pro's are looking up as well here.
If you remember my ETHBTC' educational posts, about the obvious manipulation on ETH'. If we look at that chart here below, we can see the green starting point and the yellow ending point. Probably telling us that their manipulation game here is over. If they are doing a bullish version now, i don't know. I did not have the time to do real research on this.

One of the educational post i mentioned above:
You probably remember why i changed from slightly bearish to bullish for ETH 2 days before the rally started, with the assumption that the H&S (blue lines) would fail, simply because the bears were not taking control and it was taking too long. Now it seems the bulls have turned it into an inverse H&S (green lines). It seems the neckline broke already, but that red zone is a very clear resistance area. So it's safer to assume that this zone is the real neckline. For the bullish version, the green zone above 126 has to hold. A break of 122ish would be a very bad sign.
When looking at ETH alone, it would be very easy to be bullish here. But we all know, without Bitcoin', this market isn't going anywhere. That one is still above the safe zone, can still turn up, but there is no conviction or volume at all from that side. So i find it difficult to say at this moment which direction the market will follow. Max drop for Bitcoin' is around 3480/50, but it looks like the 3530/50 is the low already. So a break of that level, might make the whole market drop. So whatever you do, keep your eyes open for ETH', LTC' and BTC'.
Please don't forget to like if you appreciate this :)
Previous analysis:
Anyway, on the left we can see how it stayed above that bull flag i drew a week ago. It only made a big wick inside of it because of that ugly Bart move Bitcoin' did earlier this week. Since that was clearly noise when looking at this chart, we can see a lot of strength now in ETH. The past week, inside of that triangle on the right, it started to show some bearish signs on the lower time frame, but the bulls stepped up and held their ground. The bears are clearly giving up here and based on the volume, i think the pro's are looking up as well here.
If you remember my ETHBTC' educational posts, about the obvious manipulation on ETH'. If we look at that chart here below, we can see the green starting point and the yellow ending point. Probably telling us that their manipulation game here is over. If they are doing a bullish version now, i don't know. I did not have the time to do real research on this.
One of the educational post i mentioned above:

You probably remember why i changed from slightly bearish to bullish for ETH 2 days before the rally started, with the assumption that the H&S (blue lines) would fail, simply because the bears were not taking control and it was taking too long. Now it seems the bulls have turned it into an inverse H&S (green lines). It seems the neckline broke already, but that red zone is a very clear resistance area. So it's safer to assume that this zone is the real neckline. For the bullish version, the green zone above 126 has to hold. A break of 122ish would be a very bad sign.
When looking at ETH alone, it would be very easy to be bullish here. But we all know, without Bitcoin', this market isn't going anywhere. That one is still above the safe zone, can still turn up, but there is no conviction or volume at all from that side. So i find it difficult to say at this moment which direction the market will follow. Max drop for Bitcoin' is around 3480/50, but it looks like the 3530/50 is the low already. So a break of that level, might make the whole market drop. So whatever you do, keep your eyes open for ETH', LTC' and BTC'.
Please don't forget to like if you appreciate this :)
Previous analysis:

Comment:
New ETH analysis:
Want to support me? My affiliates:
partner.bybit.com/b/botje12
onelink.to/quantfury
Add invite code AFTER signing up, bonus up to $250: 4JU345F3
1 trade, 30 day wait, to claim bonus
www.kucoin.com/r/af/rMQN2A5
partner.bybit.com/b/botje12
onelink.to/quantfury
Add invite code AFTER signing up, bonus up to $250: 4JU345F3
1 trade, 30 day wait, to claim bonus
www.kucoin.com/r/af/rMQN2A5