Eli Lilly (LLY): Uptrend Intact as GLP-1 Leadership Fuels GrowthEli Lilly continues to hold firmly above its 20- and 50-day EMAs after a healthy retracement, with clear buying interest emerging at the 20 EMA. This price behavior suggests the strong uptrend remains intact and is likely to continue driven by flagship diabetes treatment Mounjaro, obesity drug Zepbo
Key facts today
Next report date
—
Report period
—
EPS estimate
—
Revenue estimate
—
20.25 USD
10.59 B USD
45.04 B USD
851.26 M
About Eli Lilly and Company
Sector
Industry
CEO
David A. Ricks
Website
Headquarters
Indianapolis
Founded
1876
Identifiers
3
ISIN US5324571083
Eli Lilly & Co. engages in the discovery, development, manufacture, and sale of pharmaceutical products. The firm's products consist of diabetes, oncology, immunology, neuroscience, and other products and therapies. The company was founded by Eli Lilly in May 1876 and is headquartered in Indianapolis, IN.
Related stocks

LLY | This Healthcare Co. Is a Great Pick | LONGEli Lilly & Co. engages in the discovery, development, manufacture, and sale of pharmaceutical products. The firm's products consist of diabetes, oncology, immunology, neuroscience, and other products and therapies. The company was founded by Eli Lilly in May 1876 and is headquartered in Indianapoli


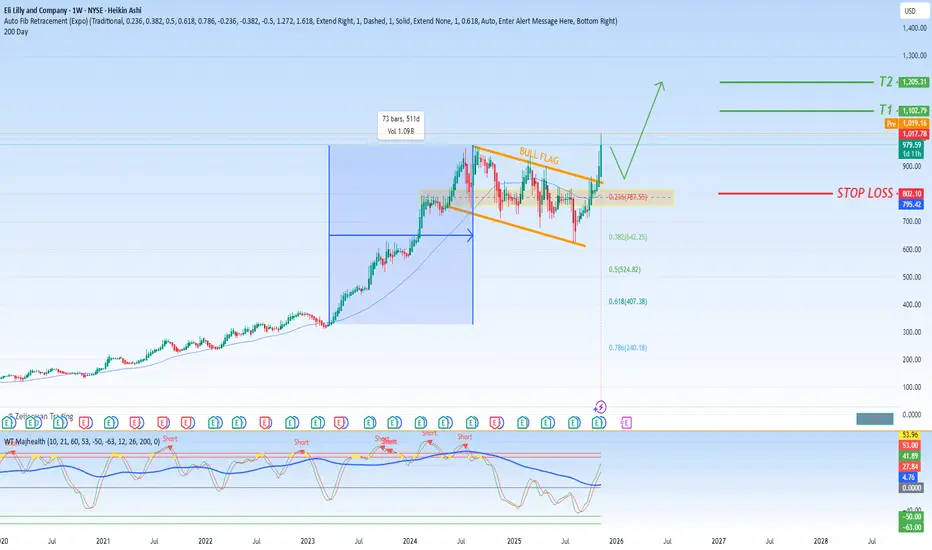
LLY is a Bullish Flag for 2026NYSE:LLY is A Bullish Flag for 2026 🚀
Hello traders,
As part of my long-term series focused on the 2026 horizon, today I’m bringing you my condensed vision for NYSE:LLY .
LLY has recently broken out of a bull flag and looks like a prime candidate for a very bullish 2026. This is a stock that

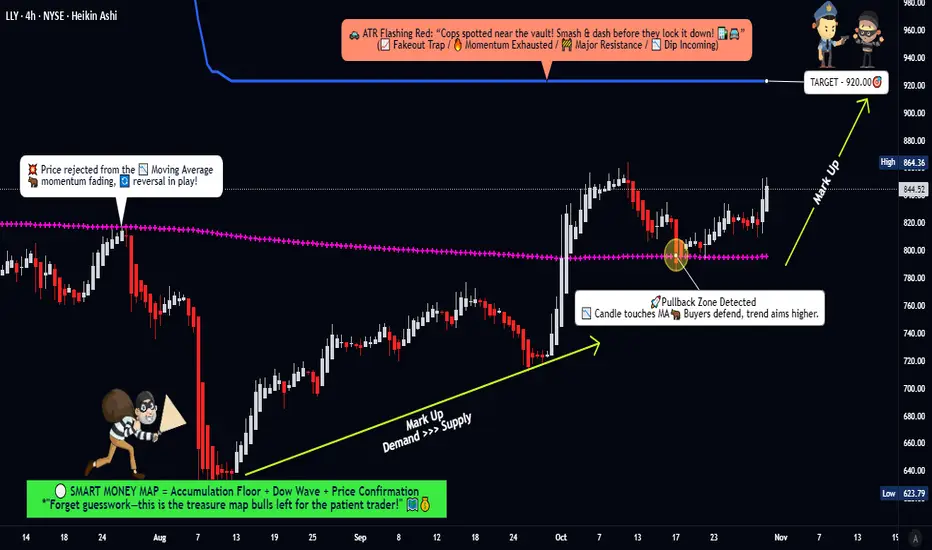
LLY Market Blueprint – From Pullback Base to Profit Zone🎯 LLY Stock Market Heist Plan 🏦💰 | Swing Trade Setup
📊 Asset Overview
Eli Lilly and Company (LLY) - NYSE
Pharmaceutical Giant | Market Cap Leader
🔍 The Setup: What We're Seeing
The chart is screaming opportunity! 🚨 LLY is showing classic bullish pullback behavior with strong accumulation zone acti
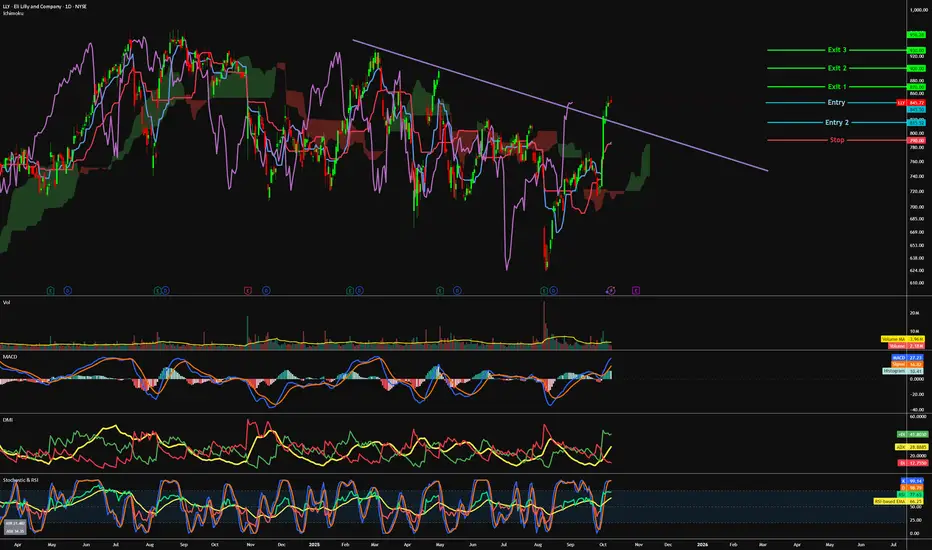
Eli Lilly May Be OversoldEli Lilly surged last month, and now it’s pulled back.
The first pattern on today’s chart is the 50 percent retracement of the advance. That may suggest its direction is pointing higher. Prices have also stabilized at the psychologically important $1,000 level.
Second, the 50-day simple moving ave

LLY - looking to reach the previous high ?=======
Volume
=======
-slight decreasing volume
==========
Price Action
==========
- Latest downtrend broken
- Change of trend observed
=========
Oscillators
=========
- Ichimoku, price above cloud, green kumo expanding, base + conv + lagging above sign of piercing clouds
- MACD still bullish
05-2025-12-08-LLY-Downtrend-Short-7LLY:
Short Position with Downtrend
Scorecard: 7
S: 1,023.87
E: 1,005.33
T: 993.21
Shares: 5.39

$LLYThe technical structure for NYSE:SMR presents a compelling case of a strong, sustained uptrend, characterized by a rhythmic pattern of sharp advances followed by periods of consolidation. This behavior is the hallmark of a healthy, momentum-driven bull move.
1. Pattern Analysis: Sequential Bull F
Lilly (NYSE: $LLY) Jumps as FDA Expands Jaypirca UseEli Lilly and Company (NYSE: NYSE:LLY ) received a major regulatory boost after the U.S. Food and Drug Administration approved an expanded indication for its non-covalent BTK inhibitor, Jaypirca (pirtobrutinib). The drug is now approved for adults with relapsed or refractory chronic lymphocytic leu

See all ideas
Summarizing what the indicators are suggesting.
Neutral
SellBuy
Strong sellStrong buy
Strong sellSellNeutralBuyStrong buy
Neutral
SellBuy
Strong sellStrong buy
Strong sellSellNeutralBuyStrong buy
Neutral
SellBuy
Strong sellStrong buy
Strong sellSellNeutralBuyStrong buy
An aggregate view of professional's ratings.
Neutral
SellBuy
Strong sellStrong buy
Strong sellSellNeutralBuyStrong buy
Neutral
SellBuy
Strong sellStrong buy
Strong sellSellNeutralBuyStrong buy
Neutral
SellBuy
Strong sellStrong buy
Strong sellSellNeutralBuyStrong buy
Displays a symbol's price movements over previous years to identify recurring trends.
LLY4099975
Eli Lilly and Company 4.65% 15-JUN-2044Yield to maturity
5.65%
Maturity date
Jun 15, 2044
LLY6153503
Eli Lilly and Company 5.65% 15-OCT-2065Yield to maturity
5.61%
Maturity date
Oct 15, 2065
LLY6003397
Eli Lilly and Company 5.6% 12-FEB-2065Yield to maturity
5.59%
Maturity date
Feb 12, 2065
LLY5871804
Eli Lilly and Company 5.2% 14-AUG-2064Yield to maturity
5.59%
Maturity date
Aug 14, 2064
LLY5547405
Eli Lilly and Company 4.95% 27-FEB-2063Yield to maturity
5.58%
Maturity date
Feb 27, 2063
LLY5750032
Eli Lilly and Company 5.1% 09-FEB-2064Yield to maturity
5.57%
Maturity date
Feb 9, 2064
US532457BU1
Eli Lilly and Company 4.15% 15-MAR-2059Yield to maturity
5.52%
Maturity date
Mar 15, 2059
LLY6153502
Eli Lilly and Company 5.55% 15-OCT-2055Yield to maturity
5.51%
Maturity date
Oct 15, 2055
LLY6003396
Eli Lilly and Company 5.5% 12-FEB-2055Yield to maturity
5.49%
Maturity date
Feb 12, 2055
LLY5547404
Eli Lilly and Company 4.875% 27-FEB-2053Yield to maturity
5.49%
Maturity date
Feb 27, 2053
XS238628644
Eli Lilly and Company 1.625% 14-SEP-2043Yield to maturity
5.49%
Maturity date
Sep 14, 2043
See all LLY bonds
Curated watchlists where LLY is featured.


Frequently Asked Questions
The current price of LLY is 1,081.73 USD — it has decreased by −2.07% in the past 24 hours. Watch Eli Lilly and Company stock price performance more closely on the chart.
Depending on the exchange, the stock ticker may vary. For instance, on NYSE exchange Eli Lilly and Company stocks are traded under the ticker LLY.
LLY stock has risen by 0.50% compared to the previous week, the month change is a 8.21% rise, over the last year Eli Lilly and Company has showed a 39.79% increase.
We've gathered analysts' opinions on Eli Lilly and Company future price: according to them, LLY price has a max estimate of 1,600.00 USD and a min estimate of 950.00 USD. Watch LLY chart and read a more detailed Eli Lilly and Company stock forecast: see what analysts think of Eli Lilly and Company and suggest that you do with its stocks.
LLY stock is 2.64% volatile and has beta coefficient of 0.38. Track Eli Lilly and Company stock price on the chart and check out the list of the most volatile stocks — is Eli Lilly and Company there?
Today Eli Lilly and Company has the market capitalization of 1.03 T, it has increased by 3.21% over the last week.
Yes, you can track Eli Lilly and Company financials in yearly and quarterly reports right on TradingView.
Eli Lilly and Company is going to release the next earnings report on Feb 11, 2026. Keep track of upcoming events with our Earnings Calendar.
LLY earnings for the last quarter are 7.02 USD per share, whereas the estimation was 5.69 USD resulting in a 23.33% surprise. The estimated earnings for the next quarter are 7.22 USD per share. See more details about Eli Lilly and Company earnings.
Eli Lilly and Company revenue for the last quarter amounts to 17.60 B USD, despite the estimated figure of 16.05 B USD. In the next quarter, revenue is expected to reach 17.87 B USD.
LLY net income for the last quarter is 5.58 B USD, while the quarter before that showed 5.66 B USD of net income which accounts for −1.38% change. Track more Eli Lilly and Company financial stats to get the full picture.
Yes, LLY dividends are paid quarterly. The last dividend per share was 1.50 USD. As of today, Dividend Yield (TTM)% is 0.55%. Tracking Eli Lilly and Company dividends might help you take more informed decisions.
Eli Lilly and Company dividend yield was 0.67% in 2024, and payout ratio reached 44.39%. The year before the numbers were 0.78% and 77.91% correspondingly. See high-dividend stocks and find more opportunities for your portfolio.
As of Jan 9, 2026, the company has 47 K employees. See our rating of the largest employees — is Eli Lilly and Company on this list?
EBITDA measures a company's operating performance, its growth signifies an improvement in the efficiency of a company. Eli Lilly and Company EBITDA is 28.29 B USD, and current EBITDA margin is 41.75%. See more stats in Eli Lilly and Company financial statements.
Like other stocks, LLY shares are traded on stock exchanges, e.g. Nasdaq, Nyse, Euronext, and the easiest way to buy them is through an online stock broker. To do this, you need to open an account and follow a broker's procedures, then start trading. You can trade Eli Lilly and Company stock right from TradingView charts — choose your broker and connect to your account.
Investing in stocks requires a comprehensive research: you should carefully study all the available data, e.g. company's financials, related news, and its technical analysis. So Eli Lilly and Company technincal analysis shows the buy rating today, and its 1 week rating is buy. Since market conditions are prone to changes, it's worth looking a bit further into the future — according to the 1 month rating Eli Lilly and Company stock shows the buy signal. See more of Eli Lilly and Company technicals for a more comprehensive analysis.
If you're still not sure, try looking for inspiration in our curated watchlists.
If you're still not sure, try looking for inspiration in our curated watchlists.