Fair Value Gap (FVG) in Crypto: The Complete Guide🔸Introduction:
In financial markets in general—and the crypto market in particular—understanding market liquidity and imbalance zones is essential for building successful trading strategies. One of the most prominent modern price analysis concepts, especially within the Smart Money Concepts (SMC) framework, is the Fair Value Gap (FVG). This refers to a price imbalance between buyers and sellers.
🔸What is the Fair Value Gap (FVG)?
A Fair Value Gap is an area on the price chart that shows an imbalance between supply and demand. It occurs when the price moves rapidly in one direction without being fairly traded within a balanced price range. This usually happens due to the entry of large players or “smart money,” creating a gap between three consecutive candlesticks on the chart.
Classic Bullish FVG Setup:
Candle 1: A bearish or neutral candle.
Candle 2: A strong bullish candle (usually large).
Candle 3: A bullish or neutral candle.
🔸Where is the Gap?
The gap lies between the high of candle 1 and the low of candle 3.
If candle 3 does not touch the high of candle 1, an unfilled price gap (FVG) is present.
🔸How is FVG Used in Market Analysis?
Traders use Fair Value Gaps as potential areas for:
Entering trades when the price returns to retest the gap.
Identifying zones of institutional interest.
Setting potential targets for price movement.
🔸Common Scenario:
If a strong bullish candle creates a Fair Value Gap, the price often returns later to retest that gap before continuing its upward movement.
The gap can be considered "delayed demand" or "delayed supply".
🔸🔸Types of FVG:🔸🔸
🔸Bullish FVG:
Indicates strong buying pressure.
The price is expected to return to the gap, then bounce upwards.
🔸Bearish FVG:
Indicates strong selling pressure.
The price is expected to return to the gap, then continue downward.
🔸Relationship Between FVG and Liquidity:
Fair Value Gaps are often linked to untapped liquidity zones, where buy or sell orders have not yet been fulfilled. When the price returns to these areas:
Institutional orders are activated.
The price is pushed again in the primary direction.
🔸How to Trade Using FVG (Simple Entry Plan):
Steps:
Identify the overall trend (bullish or bearish).
Observe the formation of an FVG in the same direction.
Wait for the price to return and test the gap.
Look for entry confirmation (like a reversal candle or a supporting indicator).
Set your stop loss below or above the gap.
Take profit at a previous structure level or the next FVG.
🔸🔸Real-World Examples (Simplified):🔸🔸
🔸Bullish Example:
A strong bullish candle appears on BTC/USD.
A gap forms between $74K and $80K.
The price rises to $108K, then returns to 74K$ (inside the gap).
From there, it begins to rise again.
🔸Important Tips When Using FVG:
Don’t rely on FVGs alone—combine them with:
-Market Structure.
-Support and resistance zones.
-Confirmation indicators like RSI or Volume Profile.
-Best used on higher timeframes (15m, 1H, 4H, Daily).
-The gap can be filled the same day or after days/weeks.
🔸Conclusion
The Fair Value Gap is a powerful analytical tool used to identify zones of institutional interest. It plays a key role in the toolset of professional traders who follow smart money principles. By mastering this concept, traders can improve entry and exit timing, reduce risk, and increase their chances of success.
Best regards Ceciliones🎯
Community ideas

What is Bitcoin Dominance, and When Can We Expect Altseason?What is Bitcoin Dominance, and When Can We Expect Altseason?
✅ In the fast-paced and ever-changing world of digital currencies, traders and investors are continually seeking signs and tools to aid them in making informed decisions. One key sign is Bitcoin Dominance (BTC.D).
Understanding this and examining its chart can provide us with important clues about what the market might do next, especially regarding when Altseason (the period of growth for altcoins) might begin.
CRYPTOCAP:BTC.D
What is Bitcoin Dominance (BTC.D)?
Simply put, Bitcoin Dominance indicates the percentage of the total value of all digital currencies that is held by Bitcoin. For example, if the total value of all digital currencies is $1 trillion and Bitcoin's value is $600 billion, then Bitcoin's Dominance is 60%.
This number is very important because:
It shows market feeling: When Bitcoin Dominance goes up, it usually means money is moving to Bitcoin as a safer option, and people are less willing to take risks. When Bitcoin Dominance goes down, it can mean people are more confident in altcoins and are ready to take more risks for bigger profits.
It shows money flow: Changes in BTC.D show how money is moving between Bitcoin and altcoins.
❓ What is Altseason?
Altseason is a time in the digital currency market when altcoins (digital currencies other than Bitcoin) do much better than Bitcoin, and their prices go up a lot.
During Altseason, money often flows from Bitcoin to altcoins, and many altcoins can see their prices increase many times over.
Looking at the Current Bitcoin Dominance Chart and forecasting Altseason
If we look at the provided chart for Bitcoin Dominance (BTC.D), we can see a few key things:
Long-term upward channel: The chart shows that Bitcoin Dominance has been in a long-term upward path. The bottom of this path is marked by a blue support line , and the top is marked by a red resistance line . This means that, in the bigger picture, Bitcoin's control over the market has been growing.
Broken short-term upward trend: There was a shorter-term upward trend line (shown in black on the image) that the price broke below on May 9th . This break could be an early warning sign that Bitcoin's dominance might be weakening in the short term, and its dominance might start to fall.
⚠️ But here is a very important point:
We cannot be sure that Altseason has definitely started until the price clearly breaks below the main support line of the channel (the blue line) and stays below it.
The break of the short-term upward trend line (black line) is an early signal. However, to confirm a change in the trend and the possible start of a significant Altseason, we need to see stronger support levels, like the blue support line on the chart, get broken.
⏳ So, When Should We Expect Altseason?
Based on the chart analysis and the points mentioned:
Early Sign: The break of the short-term upward trend line (black) on May 9th might make people pay more attention to altcoins, but it's not enough on its own.
Key Condition for Altseason: The most important signal for the start of a real Altseason would be if the Bitcoin Dominance price breaks below the blue support line of the long-term upward channel. As long as Bitcoin Dominance stays above this support line, Bitcoin will likely keep its relative strength in the market, and altcoins might only see limited growth or could even face selling pressure.
Conclusion:
Analyzing Bitcoin Dominance is a useful tool for understanding how the digital currency market works and for predicting possible trends. Right now, because the short-term trend line has been broken, the market is at a sensitive point. However, traders and investors should watch the BTC.D price movements very carefully and wait for stronger confirmations, especially a possible break of the blue support line, before announcing the start of Altseason.

Is It Time to Enter, or time to escape?One green candle is all it takes to trigger thousands of minds into thinking
Should I jump in now?
But is this truly a good entry point, or are you just afraid of missing the move?
Let’s break down how psychology tricks us into bad trades—and how to fight back with real chart data.
Hello✌
Spend 3 minutes ⏰ reading this educational material.
🎯 Analytical Insight on Bitcoin:
📈 Bitcoin is currently respecting a well-structured ascending channel, with price action aligning closely with a key Fibonacci retracement level and a major daily support zone—both acting as strong technical confluence. Given the strength of this setup, a potential short-term move of at least +6% seems likely, while the broader structure remains supportive of an extended bullish scenario toward the $116K target. 🚀
Now, let's dive into the educational section ,
📉 Why Do We Buy More When Markets Are High?
It’s a simple question—but the answer runs deep into our psychology. When a crypto pumps, and we’re not in it, our brain doesn’t analyze—it rationalizes:
"If I don’t buy now, I’ll miss out."
But most people who think like this enter at the top—and exit with regret .
🧠 The Psychology of FOMO and Poor Timing
In every rally, a large chunk of entries are triggered by FOMO (Fear of Missing Out).
But buying high means you're buying from those who bought lower.
And here's the trick: your brain loves the green candles—but ignores volume drops, RSI spikes, or exhaustion signals.
🛠 TradingView Tools to Spot Smart Entry Points
When it comes to entering a position, emotions are your worst advisor. Fortunately, TradingView offers powerful tools to help you act based on evidence, not instinct. Here’s how to use them:
🔹 Trend-Based Fib Extension: One of the best tools to estimate how much room a move still has. Plot it on the previous wave to identify realistic targets.
🔹 RSI (Relative Strength Index): When RSI is over 70 or under 30, you’re in emotional territory. Be careful—buying during peak RSI often means you're entering late.
🔹 MACD: Look for crossovers between lines and histogram patterns. Use it as confirmation—not a solo trigger—for entries.
🔹 Volume Profile: This hidden gem on TradingView shows you where most trading volume has occurred. Buying at volume-supported levels is way safer.
🔹 Alerts & Watchlists: Don’t glue yourself to the chart. Set alerts for your conditions and build smart watchlists to stay updated.
🔹 Replay Mode: Want to master entries without risking real capital? Use Replay Mode to test strategies and train your eyes.
If you want to replace "guessing" with "planning," these tools should be your daily companions.
🔍 5-Point Checklist Before You Hit "Buy"
Ask yourself these five questions before entering a trade:
Is the broader trend actually bullish—or is this just a short-lived bounce?
What does RSI or other indicators say about overbuying?
Are there major support/resistance zones nearby?
Is the volume confirming the move—or fading out?
Do you have a target and stop in place—or just a “need to be in”?
📊 No Plan Entry = Planned Loss
If you jump in without a clear plan, your only focus becomes: “Am I in profit yet?”
Not “Is my strategy playing out?”
And that’s the trap.
A solid entry means you have a signal, a plan, and controlled risk.
🧲 How to Avoid Getting Pulled Into Fake Rallies
Always check higher timeframes for confirmation
Don’t enter without volume agreement
Plan entries after pullbacks, not mid-hype
Think in probabilities, not dreams
🧭 Final Takeaway & Recommendation
Opportunities never end in the market.
Opportunities never end in the market.
Opportunities never end in the market.
Opportunities never end in the market.
Opportunities never end in the market.
Opportunities never end in the market.
Opportunities never end in the market.
i should write this thousand of time ☝️
But rushing in only guarantees missed ones.
Use your tools and stay calm.
The trader who plans always beats the one who panics.
always conduct your own research before making investment decisions. That being said, please take note of the disclaimer section at the bottom of each post for further details 📜✅.
Give me some energy !!
✨We invest countless hours researching opportunities and crafting valuable ideas. Your support means the world to us! If you have any questions, feel free to drop them in the comment box.
Cheers, Mad Whale. 🐋

Positive Psychology in TradingTrading isn’t just about numbers, charts, or quick decisions. It’s an intense emotional experience, a constant mental challenge, and often a major source of stress.
That’s why more traders are turning to positive psychology—a modern psychological approach that explores what makes people thrive, even under pressure and uncertainty.
What is Positive Psychology?
Founded by Martin Seligman, positive psychology focuses on positive emotions, strengths, and the conditions that lead to a fulfilling life. Unlike traditional approaches that look at “what’s wrong,” it asks: What’s going right? and How can we build on it?
The PERMA model (Positive Emotion, Engagement, Relationships, Meaning, Achievement) serves as a powerful framework—even in the world of trading.
________________________________________
How Does It Apply to Trading?
1. Positive Emotions – Calm Before the Click
Trading isn’t about euphoria or panic—it’s about equilibrium. Cultivating positive emotions like gratitude or realistic optimism helps you:
• Reduce impulsivity
• Build emotional resilience
• Make clearer decisions under pressure
Try this: At the end of each trading day, write down 3 things that went well and why. This trains your brain to see progress, not just mistakes.
________________________________________
2. Engagement (Flow) – Get in the Zone
Flow is that state of complete absorption in what you're doing. In trading, it means:
• Deep focus without mental fatigue
• Quick yet thoughtful decisions
• A fulfilling experience, win or lose
How to reach it? Schedule short, focused trading sessions with no distractions and a clear plan.
________________________________________
3. Positive Relationships – You’re Not Alone
Trading can be solitary—and at times, frustrating. A positive community of fellow traders can:
• Reduce isolation
• Offer constructive feedback
• Boost your motivation
Pro tip: Join a trading group that values learning and support, not just fast wins.
________________________________________
4. Meaning – Why Do You Trade?
Without a deeper why, trading becomes a stressful gamble. When you have a clear sense of purpose (financial freedom, personal growth, discipline), it’s easier to:
• Stay consistent during drawdowns
• Stick to your plan
• Avoid burnout
________________________________________
5. Achievement – Celebrate the Process, Not Just the Profits
Positive psychology emphasizes progress over perfection. In trading, this might mean:
• A full week of disciplined trades = success
• Following your strategy = a win
• Avoiding overtrading = growth
________________________________________
Final Thoughts
Positive psychology isn’t about “happy thoughts” or ignoring risk. It’s about building a resilient, balanced, and healthy mindset—a crucial asset for any long-term trader.
If you want to become a high-performing trader, don’t focus only on strategies and charts. Learn to master your emotions, develop your inner strengths, and trade with purpose.

Understanding How Dark Pool Buy Side Institutions AccumulateThe SPY is the most widely traded ETF in the world. Its price or value movement reflects the S&P 500 index value. It doesn't reflect the buying or selling of the SPY.
You must use volume indicators and accumulation/distribution indicators that indicate whether the Buy Side Institutions are in accumulation mode, rotation to lower inventory to buy a different ETF or other instrument, OR distribution due to mutual fund and pension fund redemption demands.
ETFs are one of the fastest growing industries in the US and around the world. There are more than 4000 Exchange Traded Derivatives. There are ETDs for just about anything you might wish to invest in long term or trade short term.
If you trade the SPY, it is important to study the S&P 500 index, its top 10 components, how their values are changing, and resistance and support levels. SPY will mirror the S&P 500 closely but not precisely.
ETFs are built with a variety of types of investments and always have a TRUST FUND, in which the components of that ETF inventory are held. The ETF Inventory is updated and adjusted monthly or sooner as needed to maintain the integrity of the ETF price value to the value of the S&P 500 index. Rules and regulations require that the ETF SPY be closely aligned to the S&P 500. So inventory adjustments are going on regularly.
When trading the SPY, you must remember that it is not buyers and sellers of the ETF that change its price. Rather, it is the S&P 500 top components' price fluctuations that change the SPY price value.
This is a tough concept to accept and understand. When you do understand it and apply that knowledge to your trading of the SPY, you will be far more profitable. This takes time. You also need to develop Spatial Pattern Recognition Skills so that when a pattern appears, you can recognize it instantly and act accordingly in your trading.
Today we cover the resistance levels above the current price value. That resistance is likely to slow down the rapid gains in price value over the past few weeks. The ideal would be a sideways trend to allow corporations time to adjust to the new normal of whatever tarrifs are impacting their imports and exports.
Then, the S&P500 move out of that sideways trend would result in a stronger Moderately Uptrending Market Condition.
Trade Wisely,
Martha Stokes CMT

What Is Stock Tape Reading, and How Do Traders Use It?What Is Stock Tape Reading, and How Do Traders Use It?
Tape reading is a real-time market analysis method used to track buying and selling pressure. Unlike technical indicators, which rely on historical data, tape reading focuses on executed trades, order flow, and liquidity shifts. Traders use it to assess momentum, identify institutional activity, and refine trade timing. This article explores how tape reading works, its role in modern markets, and how traders apply it to short-term decision-making.
The Origins and Evolution of Tape Reading
Tape reading began in the late 19th century when stock prices were transmitted via ticker tape machines, printing a continuous stream of price updates on paper strips. Traders would gather around these machines, scanning for large trades and unusual activity to anticipate market moves. One of the earliest and most well-known tape readers, Jesse Livermore, built his fortune by studying these price changes and spotting institutional buying and selling patterns.
By the mid-20th century, as markets became faster and more complex, ticker tape machines were replaced by electronic order books. Instead of scanning printed numbers, traders began using Level 2 market data and time & sales windows to track order flow in real time. This transition allowed for more precise liquidity analysis, making it easier to see how large orders impacted price movement.
The rise of algorithmic and high-frequency trading (HFT) in the 2000s further changed the landscape. Today, market depth tools, order flow software, and footprint charts have replaced traditional tape reading, but the core principle remains the same: analysing how buyers and sellers interact in real time. While charts and indicators offer historical insight, tape reading provides a direct window into current market behaviour, giving traders an edge in fast-moving conditions.
How to Read the Tape
Nowadays, tape reading is all about real-time market data—watching when and how orders are placed and filled to gauge momentum and liquidity. Unlike technical indicators, reflecting past price action, tape reading focuses on what’s happening right now. Stock, forex, and commodity traders use it to assess buying and selling pressure, spot large orders, and understand market sentiment as it unfolds. Here is the key information provided by tape reading:
Time & Sales
The time & sales window (the tape) displays every completed trade. Each entry shows time, price, trade size, and whether it hit the bid or ask.
- Trades at the ask suggest aggressive buying, as buyers are willing to pay the market price.
- Trades at the bid indicate selling pressure, as sellers accept lower prices.
- Large block trades often signal institutional activity—tracking these can reveal where big players are positioning.
Bid-Ask Activity
Nowadays, an order book is a part of tape reading. The order book (Level 2 or DOM) shows the number of buy and sell orders at different price levels. While not all orders get filled, traders watch for:
- Stacked bids (a high concentration of buy orders) near a price level, which may indicate strong buying interest.
- Stacked offers (large sell orders) acting as resistance.
- Orders rapidly appearing or disappearing, suggesting hidden liquidity or fake orders meant to mislead traders.
Volume and Trade Size
Changes in trade size and volume help traders judge the conviction behind a move:
- Consistent large trades in one direction can suggest institutions accumulating or distributing a position.
- A surge in small trades may indicate retail participation rather than institutional moves.
- A sudden drop in trade activity after a sharp move may hint at exhaustion or a potential reversal.
Trade Speed
The pace of executions matters.
- Fast, continuous transactions suggest urgency—buyers or sellers are aggressively taking liquidity.
- A slowdown in transactions near a key level can indicate hesitation or a shift in sentiment.
Tape Reading vs Technical & Fundamental Analysis
Tape reading differs from technical and fundamental analysis in both approach and timeframe. While technical traders study historical price patterns and fundamental analysts focus on company performance and economic data, tape readers focus on real-time order flow to assess market direction as it develops.
Technical Analysis
Technical traders rely on chart patterns, moving averages, and oscillators to identify trends and potential turning points. These tools are built on past price data, meaning they lag behind actual market activity. For example, a trader using a moving average crossover strategy waits for confirmation before acting, whereas a tape reader sees momentum shifting as it happens by watching the flow of orders.
Fundamental Analysis
Fundamental analysis is longer-term, based on financial statements, earnings reports, and macroeconomic indicators. Investors using this approach focus on factors like revenue growth, interest rates, and industry trends to decide whether a stock is undervalued or overvalued. Tape reading, by contrast, ignores these metrics entirely—it’s used by short-term traders reacting to immediate buying and selling pressure.
Where Tape Reading Fits In
Many traders combine approaches. A day trader might use technical analysis to find key price levels and then apply tape reading to fine-tune entries and exits. Similarly, a swing trader tracking earnings reports may use tape reading to see how large players are reacting. Each method provides different insights, but tape reading offers a unique advantage: it reveals market sentiment in real time, helping traders assess momentum before price movements become obvious.
Advantages and Disadvantages of Tape Reading
Tape reading gives traders an inside look at real-time market activity, but it also comes with challenges, especially in modern electronic markets.
Advantages
- Immediate Market Insight: Unlike lagging indicators, tape reading reflects live buying and selling pressure, helping traders react before price changes become obvious.
- Identifying Large Buyers & Sellers: Institutions often execute orders in patterns, leaving clues in the stock market tape. Recognising these can help traders gauge potential price direction.
- Fine-Tuning Entries & Exits: By tracking order flow near key price levels, traders can time their trades more precisely rather than relying on static chart signals.
- Useful in Fast-Moving Markets: Tape reading can be particularly valuable in scalping and day trading, where short-term momentum plays a key role.
Disadvantages
- Algorithmic Trading Distortion: High-frequency trading firms place and cancel orders rapidly, making it harder to interpret true supply and demand.
- Steep Learning Curve: Unlike technical analysis, which provides visual patterns, tape reading requires experience in spotting meaningful order flow changes.
- Mentally Demanding: Constantly watching the tape can be exhausting, requiring a high level of focus and quick decision-making.
- Less Effective in Low-Volume Markets: When liquidity is thin, tape reading becomes unreliable, as fewer trades mean less actionable data.
Modern Footprint Charts and Order Flow Software
While some stock tape readers rely on raw order flow data, many use footprint charts and order flow software to visualise buying and selling pressure more effectively.
Footprint charts display executed trades within each price bar, showing volume distribution, bid-ask imbalances, and point of control (POC)—the price level with the highest traded volume. This helps traders see where liquidity is concentrated and whether buyers or sellers are in control.
Order flow software offers heatmaps, cumulative delta, and volume profile tools. Heatmaps highlight resting liquidity in the order book, revealing where large players may be positioned. Cumulative delta tracks the difference between market buys and sells, helping traders assess momentum shifts.
These tools provide a more structured approach to tape reading, filtering out noise and making it easier to spot large orders, absorption, and potential reversals. While experience is still essential, modern software gives traders a clearer view of market behaviour beyond just raw time & sales data.
The Bottom Line
Reading the tape remains a valuable tool for traders looking to analyse real-time order flow and market liquidity. While there are numerous algorithms that place trades, understanding executed trades and bid-ask dynamics can provide an edge in fast-moving conditions.
FAQ
Is Tape Reading Still Useful in Trading?
Yes, but the application of tape reading in trading has changed. While traditional tape reading focuses on printed ticker tape, modern traders use time & sales data, Level 2 order books, and footprint charts to analyse order flow. High-frequency trading and algorithmic activity have made tape reading more complex, but it remains valuable for scalpers, day traders, and those tracking institutional activity.
What Are the Principles of Tape Reading?
Tape trading is based on real-time order flow analysis. Traders focus on executed trades (time & sales), bid-ask activity (order book), volume shifts, and trade speed to gauge buying and selling pressure. The goal is to understand how liquidity moves in the market and spot signs of institutional accumulation or distribution.
What Is the Difference Between Order Book and Tape?
The order book (Level 2 or DOM) shows pending orders at different price levels, representing liquidity that may or may not get filled. The tape (time & sales) displays completed transactions, showing actual buying and selling activity in real time.
What Is the Difference Between Technical Analysis and Tape Reading?
Technical analysis relies on historical price patterns and indicators, while tape reading focuses on real-time executed trades and market depth. Technical traders look at charts, whereas tape readers analyse live order flow to assess momentum and liquidity shifts.
How to Read Ticker Tape?
Modern ticker tape is displayed in time & sales windows on trading platforms. Traders monitor price, trade size, and whether transactions occur at the bid or ask. Rapid buying at the ask suggests demand, while consistent selling at the bid indicates selling pressure.
This article represents the opinion of the Companies operating under the FXOpen brand only. It is not to be construed as an offer, solicitation, or recommendation with respect to products and services provided by the Companies operating under the FXOpen brand, nor is it to be considered financial advice.

Trading Gold? Know the Difference Between XAU/USD and Futures🔎 Let’s address a question I get very often:
“Should I trade spot gold (XAU/USD) or Gold futures?”
It might sound like a technical decision, but it’s actually about how you approach the market, your risk profile, and your experience level.
So let’s break it down 👇
________________________________________
🟡 Two ways to trade the same asset
Both spot and futures allow you to speculate on the price of Gold. But they’re two very different beasts when it comes to execution, capital, and strategy.
________________________________________
1️⃣ Spot gold (XAU/USD)
• Traded mostly via Forex brokers or CFD platforms
• No expiration — you can hold the position as long as you want
• Often used by retail traders for day trading or swing setups
• You can open small trades (even 0.01 lots)
• Costs include spread, swap fees if you hold overnight
• Leverage is usually high — up to 1:100 or more
• Margin is required, but typically lower than in futures
💡 Spot is flexible and accessible, but you pay the price through overnight holding costs, wider spreads during volatility, and slippage. On some brokers, especially during high-impact news, your platform might even freeze or delay execution — and that’s a serious risk if you’re not prepared.
________________________________________
2️⃣ Gold futures (GC)
• Traded on major futures exchanges like CME
• Contracts have a fixed size (usually 100 oz)
• They expire monthly, so you need to manage rollovers
• Common among hedge funds and experienced traders
• You pay commissions and exchange fees, but no swaps
• Margin is required here too — but it's much higher
💡 Futures are structured and professional — but they demand more capital, stricter execution discipline, and higher margin requirements. Just like in spot trading, margin is a collateral deposit, not a cost — but with futures, the bar is set higher.
________________________________________
⚖️ So, which one is for you?
If you're using MetaTrader or any platform offered by a Forex/CFD broker, and you're a scalper, intraday, or swing trader working with flexible position sizes...
→ You're probably better off with spot gold (XAU/USD).
If you're trading big volume, managing diversified portfolios, or involved in hedging large exposure...
→ You should consider futures — but expect to level up your game, capital requirements, and discipline.
________________________________________
🧠 Mindset:
Don’t confuse accessibility with simplicity.
Just because spot Gold is easier to open doesn’t mean it’s always the best choice.
Just because futures look “pro-level” doesn’t mean they’re always worth it for a retail trader.
Understand your tools. Pick the one that aligns with your structure. That’s how you stay in the game. 🎯
________________________________________
📚 Hope this cleared it up. If you want me to cover execution setups for each one, let me know in the comments.

How to Use Stop Losses in TradingViewThis video covers stop loss orders, explaining what they are, why traders use them, and how to set them up in TradingView.
Disclaimer:
There is a substantial risk of loss in futures trading. Past performance is not indicative of future results. Please trade only with risk capital. We are not responsible for any third-party links, comments, or content shared on TradingView. Any opinions, links, or messages posted by users on TradingView do not represent our views or recommendations. Please exercise your own judgment and due diligence when engaging with any external content or user commentary.
The placement of contingent orders by you or broker, or trading advisor, such as a "stop-loss" or "stop-limit" order, will not necessarily limit your losses to the intended amounts, since market conditions may make it impossible to execute such orders.

OPEC Countdown: Inverted H&S Signals Potential Oil Price Rise🧭 Market Context – OPEC in Focus
As Crude Oil Futures (CL) grind in tight consolidation, the calendar reminds traders that the next OPEC meeting takes place on May 28, 2025. This is no ordinary headline event — OPEC decisions directly influence global oil supply. From quota adjustments to production cuts, their moves can rapidly shift price dynamics across energy markets. Every tick in crude oil reflects not just current flows but also positioning ahead of such announcements.
OPEC — the Organization of the Petroleum Exporting Countries — coordinates oil policy among major producers. Its impact reverberates through futures markets like CL and MCL (Micro Crude), where both institutional and retail traders align positions weeks in advance. This time, technicals are speaking loud and clear.
A compelling bottoming structure is taking shape. The Daily timeframe reveals an Inverted Head and Shoulders pattern coinciding with a bullish flag, compressing into a potential breakout zone. If momentum confirms, CL could burst into a trend move — just as OPEC makes its call.
📊 Technical Focus – Inverted H&S + Flag Pattern
Price action on the CL daily chart outlines a classic Inverted Head and Shoulders — a reversal structure that traders often monitor for high-conviction setups. The neckline sits at 64.19, and price is currently coiled just below it, forming a bullish flag that overlaps with the pattern’s right shoulder.
What makes this setup powerful is its precision. Not only does the flag compress volatility, but the symmetry of the shoulders, the clean neckline, and the breakout potential align with high-quality chart pattern criteria.
The confirmation of the breakout typically requires trading activity above 64.19, which would trigger the measured move projection. That target? Around 70.59, which is near a relevant UFO-based resistance level — a region where sellers historically stepped in with force (UnFilled Orders to Sell).
Importantly, this bullish thesis will fail if price drops below 60.02, the base of the flag. That invalidation would potentially flip sentiment and set up a bearish scenario with a target near the next UFO support at 53.58.
To properly visualize the dual scenario forming in Crude Oil, a multi-timeframe approach is often very useful as each timeframe adds clarity to structure, breakout logic, and entry/exit positioning:
Weekly Chart: Reveals two consecutive indecision candles, reflecting hesitation as the market awaits the OPEC outcome.
Daily chart: Presents a MACD bullish divergence, potentially adding strength to the reversal case.
Zoomed-in 4H chart: Further clarifies the boundaries of the bullish flag.
🎯 Trade Plan – CL and MCL Long/Short Scenarios
⏫ Bullish Trade Plan:
o Product: CL or MCL
o Entry: Break above 64.19
o Target: 70.59 (UFO resistance)
o Stop Options:
Option A: 60.02 (tight, under flag)
Option B: ATR-based trailing stop
o Ideal for momentum traders taking advantage of chart pattern combined with fundamental data coming out of an OPEC meeting
⏬ Bearish Trade Plan:
o Trigger: Break below 60.02
o Target: 53.58 (UFO support)
o Stop Options:
Option A: 64.19 (tight, above flag)
Option B: ATR-based trailing stop
o Ideal for momentum traders fading pattern failures
⚙️ Contract Specs – CL vs MCL
Crude Oil can be traded through two futures contracts on CME Group: the standard CL (WTI Crude Oil Futures) and the smaller-sized MCL (Micro WTI Crude Oil Futures). Both offer identical tick structures, making MCL a powerful instrument for traders needing more flexibility in position sizing.
CL represents 1,000 barrels of crude per contract. Each tick (0.01 move) is worth $10, and one full point of movement equals $1,000. The current estimated initial margin required to trade one CL contract is approximately $6,000 per contract, although this may vary based on market volatility and brokerage terms.
MCL, the micro version, represents 100 barrels per contract — exactly 1/10th the size of CL. Each 0.01 tick move is worth $1, with one point equaling $100. The estimated initial margin for MCL is around $600, offering traders access to the same technical setups at significantly reduced capital exposure.
These two contracts mirror each other tick-for-tick. MCL is ideal for:
Testing breakout trades with lower risk
Scaling in/out around events like OPEC
Implementing precise risk management strategies
Meanwhile, CL provides larger exposure and higher dollar returns but requires tighter control of risk and account drawdowns. Traders can choose either—or both—based on their strategy and account size.
🛡️ Risk Management – The Foundation of Survival
Technical setups don’t make traders profitable — risk management does.
Before the OPEC meeting, traders must be aware that volatility can spike, spreads may widen, and whipsaws can invalidate even the cleanest chart pattern.
That’s why stop losses aren’t optional — they’re mandatory. Whether you choose a near level, a deeper stop below the head, or an ATR-based trailing method, the key is clear: define risk before entry.
MCL helps mitigate capital exposure for those testing breakout confirmation. CL demands higher margin and greater drawdown flexibility — but offers bigger tick rewards.
Precision also applies to exits. Targets must be defined before entry to maintain reward-to-risk discipline. Avoid adding to losers or chasing breakouts post-event.
And most importantly — never hold a losing position into an event like OPEC, hoping for recovery. Risk is not a gamble. It’s a calculated variable. Treat it with respect.
When charting futures, the data provided could be delayed. Traders working with the ticker symbols discussed in this idea may prefer to use CME Group real-time data plan on TradingView: www.tradingview.com - This consideration is particularly important for shorter-term traders, whereas it may be less critical for those focused on longer-term trading strategies.
General Disclaimer:
The trade ideas presented herein are solely for illustrative purposes forming a part of a case study intended to demonstrate key principles in risk management within the context of the specific market scenarios discussed. These ideas are not to be interpreted as investment recommendations or financial advice. They do not endorse or promote any specific trading strategies, financial products, or services. The information provided is based on data believed to be reliable; however, its accuracy or completeness cannot be guaranteed. Trading in financial markets involves risks, including the potential loss of principal. Each individual should conduct their own research and consult with professional financial advisors before making any investment decisions. The author or publisher of this content bears no responsibility for any actions taken based on the information provided or for any resultant financial or other losses.

Best Practice: Prepare, Assess, Plan Then TradeTraders are often eager to jump straight into the next trading session but this may not always be the best option to chose. It can be more beneficial to follow a regular pre-trading routine to note down important scheduled events, establish current trends, as well as meaningful support and resistance price levels, and importantly this doesn’t have to be time consuming.
This is not meant to be that trading ‘holy grail’ but more of an addition to your existing trading process or plan. Having a regular routine to establish important levels, indicator set-ups and price trends to be aware of during your trading day may help you make trading decisions in a more effective way.
This pre trading routine can also be helpful for traders that take longer term positions, as it’s still important to consider the longer-term weekly perspectives as well.
This routine can be carried out at the weekend and then monitored and, where necessary, modified during the week as price action develops for the particular CFD(s) you are trading.
1. Keep Informed of Important Data Releases
If there are several CFD’s you regularly trade and tend to stick with, make sure you have as much information about those assets as possible before you start trading.
Consider utilising the Pepperstone trading calendar to help keep you informed of any economic releases/company earnings data that might impact the CFD you are trading before the week/session starts.
Once you know the scheduled events ahead, you can ask yourself,
Could these impact my trading?
Could the market reaction to this new information increase the volatility of the CFD I am about to trade or already have a position in?
How may this impact my risk?
Knowing what it is expected by the market before a particular important economic data release, such as US Non-farm Payrolls, can help you assess positioning going into the release, gauge market reaction to the data, and then be prepared for any potential price sentiment change and/or increased volatility.
2. Be Aware of Potential Support and Resistance Levels
Ahead of your trading day, consider running through the Pepperstone charts of the CFD’s you are considering trading and make a note of 3 support and resistance levels, that you identify as being meaningful. To help you we have set out an example Trading Template below.
Daily: Level: Reason: Current Trend: Current Thoughts:
Support
1st:
2nd:
3rd
Resistance
1st
2nd
3rd
Keep this next to your trading screen, so you are aware of particular levels that may act as support and resistance, if prices move in that direction. This can help you to improve trade entry or assist you with the placement of a stop loss or take profit order.
If these levels are broken at any time, you can update the template with any new support/resistance levels during the trading period.
3. Be Aware of the Daily Trends – Focus on Bollinger Bands
Using the direction of the daily Bollinger mid-average can be helpful to gauge the direction of the daily trend.
If the,
Mid-average is moving up = price uptrend
Mid-average is moving down = price downtrend
Mid-average is flat = possible price sideways range
The daily and weekly perspectives are the most important to be aware of, so it can be beneficial to analyse the charts from the longest timeframe into the shortest as this allows you to build a better understanding of the dominant trends.
You can also note these trends on the Trading Template, so it’s available to you when you are trading.
4. Follow the Same Process for All Other Timeframes - 4 Hour, 1 Hour, Even Shorter if it Suits Your Trading.
You can carry out the routine outlined in point 3, for any timeframes you are trading.
Things to note,
Are there any new trends suggested within a shorter term perspective by the Bollinger mid-average?
If the direction of a shorter term mid-average has changed, it may be an indication of either a change or resumption of a longer term price trend.
If this trend change also looks to be resuming within the longer term perspectives, this could be a more important signal, as the resumption of an existing longer term trend may mean a more extended move in that direction.
Be aware, confirmation of a price trend change within a longer term perspective might mean it could take longer and offer less trading opportunities, as initially price moves may be less aggressive in nature.
5. Where, Within the Various Timeframes is Price in Relation to the Bollinger Bands?
As we have highlighted in a previous commentary (please take a look our past posts), Bollinger Bands can highlight increasing price volatility within a trend.
Things to note regarding Bollinger Bands,
Are the upper or lower bands being touched by prices within any of the timeframes?
Within a sideways range (flat mid-average) this might suggest price has reached either a support or resistance level, with potential for a reversal.
While being touched, are the upper and lower bands starting to widen which indicates increasing price volatility, or contract, which indicates decreasing price volatility?
Remember - widening bands within a confirmed trend highlight increasing volatility, suggesting the current price move might continue for longer than you may anticipate, while contracting bands, point to decreasing volatility, which may lead to a reduction in a particular CFDs price movement.
Do the timeframes align?
If they do it may suggest a stronger trading opportunity is evident. CFDs within trending markets seeing increasing volatility tend to offer greater potential than those that aren’t.
In this scenario it maybe worthwhile considering only trading with the trend, not trying to pick bottoms or tops of markets, or if you do, consider a more cautious approach to your trading by reducing the size of your position and risk.
The material provided here has not been prepared in accordance with legal requirements designed to promote the independence of investment research and as such is considered to be a marketing communication. Whilst it is not subject to any prohibition on dealing ahead of the dissemination of investment research, we will not seek to take any advantage before providing it to our clients.
Pepperstone doesn’t represent that the material provided here is accurate, current or complete, and therefore shouldn’t be relied upon as such. The information, whether from a third party or not, isn’t to be considered as a recommendation; or an offer to buy or sell; or the solicitation of an offer to buy or sell any security, financial product or instrument; or to participate in any particular trading strategy. It does not take into account readers’ financial situation or investment objectives. We advise any readers of this content to seek their own advice. Without the approval of Pepperstone, reproduction or redistribution of this information isn’t permitted.

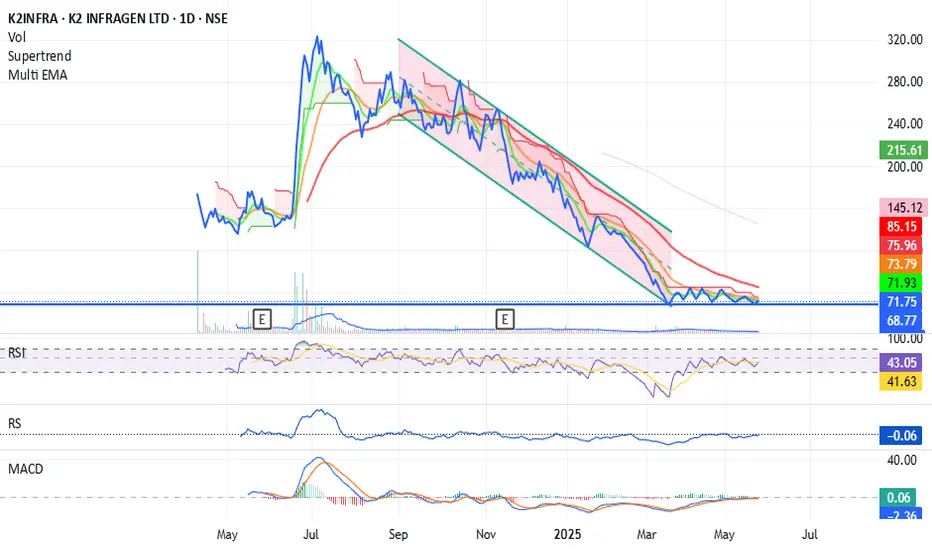
A very crucial level for k2InfraThe price is at very important support. The upside from here givs a very good return.
How to Use Fixed Range Volume Profile on TradingView
1️⃣ Why Fixed Range Volume Profile Matters
✅ It helps you spot real price structure where traders were active, not just where price passed through.
Useful for:
Identifying Supply & Demand zones
Understanding nstitutional activity (volume concentration = likely smart money involvement)
Analyzing range-bound markets
Confirming pullbacks or entries in trending setups
There are two different tools: one is called Volume Profile, and the other is Fixed Range Volume Profile. To learn more about them, check out the link below.
Volume Profile Indicators: basic concepts: www.tradingview.com
Fixed Range Volume Profile: www.tradingview.com
2️⃣ What is Volume in Trading?
Volume refers to the total number of units (e.g., shares, contracts, coins) traded during a specific time period. It measures the market's participation.
✔️ High Volume = strong interest and confirmation of price moves.
❌ Low Volume = weak conviction, indecision, or potential false moves.
Volume is calculated by counting all completed trades in a candle both buying and selling.
Learn more about volume here: www.tradingview.com
3️⃣ What is Fixed Range Volume Profile?
Fixed Range Volume Profile is a tool you can draw on your chart to check how much trading happened at different price levels, but only within the range you select. You pick the start and end point, and the tool shows volume activity just in that area.
It shows three main levels:
🔴 Point of Control (POC): the price where the most trading happened
🟢 Value Area High (VAH): the highest price in the area where most trades occurred (about 70% of total volume)
🔵 Value Area Low (VAL): the lowest price in that same area
These three levels show the price range where most trading took place also called the value area.
4️⃣ Why Fixed Range Volume Profile Matters
It helps you spot real price structure where traders were active, not just where price passed through.
Useful for:
Identifying Supply & Demand zones
Understanding institutional activity (volume concentration = likely smart money involvement)
Analyzing **range-bound markets
Confirming pullbacks or entries in trending setups
5️⃣ How to Use Fixed Range Volume Profile on TradingView
Steps:
1. First, look for a clear range on your chart. A range is a sideways movement where price is mostly moving back and forth instead of trending.
2. I like to use the 4-hour chart for this, but you can use any timeframe. Using candles with clearer shapes can help you see the range more easily.
3. Once you see a range, go to the left-hand toolbar and select the Fixed Range Volume Profile tool.
4. Click at the beginning of the range, then drag your mouse to the end of the range.
5. Let go of the mouse, and the volume profile will appear on that section of the chart.
Analyze:
POC: Price may often return to this level because it's where most trading happened
VAH: Price could have a harder time moving higher if it reaches this level may act like resistance
VAL: Price may find support around here — traders bought more in this area
1. Find the Range
2. Draw your Profile
3. You should treat your volume range like a basic support and resistance level. What you want to see is a flip between support and resistance.
4. If the price breaks above the volume profile and keeps going higher, you want it to come back and retest that same range this time acting as support.
5. Your entry should be near the support. Your stop-loss should be placed above the high of the breakout or a logical structure. Of course, setting a stop-loss always depends on more context, like the overall market structure and your risk management plan.
6️⃣ Practical Scenarios
✔️ Use it during sideways or quiet market phases (called consolidation) to see where most of the trading happened before the market moved
✔️ Try it on pullbacks in trending markets to check if price is returning to an area of high volume
✔️ Draw profiles on different price swings to spot areas where volume keeps showing up again and again
Example:
⚠️ Limitations
Fixed Range Volume Profile might not work well when:
The asset has very little trading volume (like new coins or very small stocks)
There’s a big news event causing unexpected volume spikes
The market is moving fast in one direction, and the volume zones don’t hold
⚠️ A couple of common mistakes traders make when using Fixed Range Volume Profile:
They apply it in trending markets. This tool works best in sideways or ranging markets, not when price is trending strongly up or down.
They include breakout volume. Breakouts often include forced liquidations or trapped traders this can create misleading spikes in volume.
7️⃣ Summary
Fixed Range Volume Profile helps you see where most trades happened in a specific part of the chart. It highlights price zones where traders were most active, which can help you understand possible support, resistance, or value areas.
✅ Good for:
Markets that are going sideways
Double-checking volume around key levels
Spotting price zones where support or resistance might appear
Disclaimer: This is not financial advice. Always do your own research. This content may include enhancements made using AI.

The Biggest Turning Point Isn’t in the Market — It’s in YouHard truth:
No new strategy, indicator, or tool will work until you change how you operate.
Here’s why:
Strategy hopping is fear wearing a costume.
If you keep switching tools after every loss, you’re not refining — you’re running.
You don’t need more — you need fewer, better decisions.
Simplifying your process is harder than adding new ideas. But that’s where edge lives.
Belief is the multiplier.
Without conviction, you’ll quit before any system has time to work.
🚀 The shift?
For us, it was trusting what we built — TrendGo.
When we finally stopped tweaking and started trusting the system, everything changed: our mindset, our consistency, our results.
The best tool is worthless if you don’t believe in your process.
🧠 Start there.

How to use advanced candlestick anatomy in trading: CADJPYEvery candlestick on the chart is made up of different or multiple candles on the lower timeframe. For example, a weekly candle is made up of seven daily candles. While a 4 hours candle is made up of four 1 hour candles. Understanding how these candles contribute to the formation of a single or more candlesticks will go a long way in improving our performance.
Candlestick anatomy has to do with the formation of candlestick on the chart and the implication of such candlestick. Conventionally, common candlesticks are engulfing candlestick, doji, evening star, hammer, pin bar and the rest. Some signify continuation while others are meant for reversal. The formation of these candlesticks at key levels provide an helpful insights into understanding the next market move. Hence, they can serve as confluence and confirmation for our trading decision.
Taking this further a bit, by examining these candlesticks, one can get to understand better a precise point for entry and exit. This may be new to a retail trader who trades just the candlestick while it will provide more insights for anyone looking for ways to optimize his performance.
As a case study, I had a sell setup on CADJPY and it gave a bearish engulfing candlestick on 1 hour timeframe as a confirmation for selling. Instead of entering the trade after the bearish candle closed, I changed to 5 minutes timeframe to examine the anatomy of the candlestick. Then, I discovered that there was sweep and change of character. Based on the price narrative on 5 minutes timeframe, then trading decision was made using the 5 minutes timeframe, targeting 3 RR. If 1 hour timeframe had been used for taking the trade, one is likely to have lost the profit by now.
Candlestick anatomy will help you to optimize your performance and returns.
I hope you've learnt something helpful from this post.
Thanks.
Fatai Kareem, Kof T Fx.

#AN002 Latest World News and Forex Impact
Hello, I'm Forex Trader Andrea Russo and today I want to talk about how recent global geopolitical tensions are radically changing the international currency balance.
In Forex, every crisis is a map of opportunities, but only those who analyze the global context can truly understand where capital will move. In this article, we analyze the main events of the week and reflect on how they could affect currencies in the coming days.
🇮🇳🇵🇰 India and Pakistan: risk of escalation across the border
After a terrorist attack in Kashmir that caused 26 civilian casualties, India launched “Operation Sindoor” targeting extremist groups across the border. Pakistan responded militarily with “Operation Bunyan-un-Marsoos”. Both countries used drones and cruise missiles.
Despite a ceasefire declared on May 10, the truce is fragile. The risk of a tactical nuclear crisis is real today.
🔍 Forex Impact: Strong pressure on the Indian rupee (USD/INR up) and increased demand for safe haven currencies such as CHF and JPY.
🇵🇸🇮🇱 Israel-Gaza: urban warfare resumes
Israeli operations in the Gaza Strip have intensified, aiming for complete control of the area. Hundreds of civilian casualties have been reported. Italy and other members of the Madrid+ Group are calling for a ceasefire, proposing an Arab plan for reconstruction.
🔍 Forex Impact: In the acute phase, gold (XAU/USD) and the US dollar are strengthening. The NIS (Israeli shekel) is showing signs of weakness, especially if the conflict extends to Lebanon or Syria.
🇺🇦🇷🇺 Ukraine-Russia: is a glimmer of hope opening up again?
Donald Trump spoke by phone with Vladimir Putin and other international leaders, including Giorgia Meloni, proposing the Vatican as a venue for new negotiations. Although the war continues mainly in Zaporizhzhia and the eastern region, diplomacy is back on the table.
🔍 Forex Impact: If the talks materialize, the EUR/USD could strengthen. If not, instability will further favor safe-haven currencies and weakness of the euro.
🇧🇫 Burkina Faso: the forgotten war
The jihadist group JNIM has carried out coordinated attacks in several cities in the north of the country, causing dozens of deaths and temporarily conquering the city of Djibo. The humanitarian crisis is worsening and the Sahel region remains among the most unstable in the world.
🔍 Forex Impact: Direct impacts marginal, but emerging African currencies continue to suffer from systemic instability and capital flight.
🇺🇸🇨🇳 US and China: new economic frictions
The second Trump administration has imposed new duties on Chinese products, exacerbating trade relations. The European Union, meanwhile, is seeking rebalancing by strengthening ties with Beijing. The global context is once again multipolar.
🔍 Impact on Forex: USD still strong in the short term, but growing tensions with China could weaken the USD/CNH and strengthen the CNY if Beijing responds with targeted monetary stimulus.
✝️ Vatican and new spiritual diplomacy
The new Pope, Leo XIV, is prioritizing migration and poverty. The Vatican proposes itself as a neutral venue for peace mediations, as in the Ukraine-Russia case. The Church returns to being a geopolitical actor.
🔍 Impact on Forex: Symbolic but relevant: the idea of Rome as a diplomatic center strengthens the perceived stability of the euro area.
📉 Italian GDP: growth slows
According to ISTAT, Italian GDP is falling in 2025. The causes? Industrial slowdown, residual inflation and uncertain global climate. However, public accounts are improving and employment remains stable.
🔍 Impact on Forex: EUR under pressure awaiting new ECB estimates. The spread remains under observation.
🧭 Final reflection: Forex and geopolitics, an inseparable pair
Geopolitical tensions are not background noise, but waves that move billions. Smart traders don't just read charts: they read the world. The fragility of international relations and ongoing conflicts will lead to a new polarization of Forex: on one side, safe haven currencies (JPY, CHF, USD in shock phases), on the other, emerging and cyclical currencies that are increasingly vulnerable.
Those who want to navigate this market must be prepared to react not to data, but to events that change data.

Strength of Movement: A Hidden Gem for Trend Traders📌 What Is It?
Have you ever struggled to determine whether a price move has real strength behind it? The Strength of Movement indicator might be the tool you're missing.
The Strength of Movement (SoM) indicator by RedK is designed to measure the momentum and conviction behind price movements. Unlike traditional momentum indicators like RSI or MACD, SoM focuses on the strength of directional moves, helping traders identify when a trend is gaining or losing steam.
This post will explore the features, configuration, and practical applications of this indicator.
🔍 What is the RedK Strength of Movement Indicator?
The RedK Strength of Movement indicator is designed to measure the strength of price movement and show when a quality trend has been established. It uses a simple mathematical concept to identify opportunities for long call or put positions.
📈 What kind of indicator is it?
The Strength of Movement indicator falls into the category of momentum indicators. Momentum indicators are used to measure the speed and strength of price movements.
⏳ Is it Leading or Lagging?
The RedK Strength of Movement indicator is primarily a leading indicator. It can act as a leading indicator for an imminent change in trend direction by exposing the relative movement or change of price.
⭐ Key Features
Strength Circles: These circles indicate that the top or bottom has not been reached yet, providing valuable insights into market momentum.
Measures the strength of price movement.
Identifies quality trends.
Helps filter out low-momentum conditions.
💡 Benefits Compared to other indicators
Provides clearer signals for trend identification.
Acts as a leading indicator for trend changes.
Helps avoid low-momentum conditions.
⚙️ Indicator Configuration
Timeframe Source: The indicator works on any timeframe, but higher timeframes (e.g., daily, weekly) are recommended for identifying high-quality trend setups.
Range Source: The calculation is based on the relative price change (as a ratio) from the previous bar, rather than absolute values. This makes it more intuitive and accurate for traders.
SoM Calculation Type: The core logic uses a modified `stoch()` function to normalize the strength of movement between 0% and 100%.
Smoothing Adjustments: In version 2, the calculation was refined to avoid visual confusion—especially on Renko or non-time-based charts—by adjusting how the lowest and highest values are interpreted.
📈 Enhancing Signal Accuracy with a Trend Indicator
To enhance the accuracy of signals generated by the RedK Strength of Movement indicator, it can be used in conjunction with trend indicators such as:
Moving Averages: Simple Moving Average (SMA) and Exponential Moving Average (EMA) are widely used to identify trend direction.
MACD: Moving Average Convergence Divergence helps reveal both direction and underlying momentum.
Combining these tools helps confirm signals and reduce false positives.
🔄 Alternatives
While the RedK Strength of Movement indicator is powerful, there are other alternatives that also focus on momentum and trend identification:
RSI: Relative Strength Index measures the speed and change of price movements.
Stochastic Oscillator: Measures the level of the closing price relative to the range of prices over a certain period.
💡 Practical Tips
Combine with Trend Indicators: Use the RedK Strength of Movement indicator alongside trend indicators to confirm signals.
Monitor Strength Circles: Pay close attention to the strength circles for insights into market momentum.
Backtest Thoroughly: Before using the indicator in live trading, backtest it on historical data to understand its performance and adjust settings accordingly.
📈 Which Securities Does This Apply For?
The RedK Strength of Movement indicator can be applied to a wide range of securities, including:
Stocks: Useful for identifying quality trends in individual stocks.
ETFs: Effective for analyzing exchange-traded funds.
Forex: Valuable for currency pairs, helping traders identify market cycles and potential reversals.
Commodities: Applicable to commodities like gold, oil, and agricultural products.
Cryptocurrencies: Can be used to analyze digital assets, providing insights into market momentum.
📌 Conclusion
The RedK Strength of Movement indicator is a powerful tool for traders looking to enhance their technical analysis. By measuring the strength of price movement and identifying quality trends, it provides clearer and more accurate signals, helping traders navigate complex market cycles.

If You’re Bored, You’re Probably Doing It RightYou think trading should be exciting?
That every day should feel like a high-stakes chess match?
That if it doesn’t feel intense, something’s wrong?
Nope.
Good trading is boring.
Systematic.
Repetitive.
Unemotional.
You take your setup. You size properly. You respect your stops. You move on.
Same rules. Same routine. Same process.
It’s not sexy. But it’s stable.
The truth?
The more exciting your trading feels, the more likely you’re slipping.
Overleveraging. Overtrading. Overreacting.
Boredom isn’t a bug. It’s a feature.
It means you’re not chasing.
You’re not forcing.
You’re following your edge — and letting the numbers do the heavy lifting.
You don’t need adrenaline.
You need consistency.
Get comfortable with boredom. That’s where the money is.
Boredom is not your enemy — it’s your ally.
Stay patient, stay consistent.
Charts & Grit

Automate Gold Trading with Machine Learning and LLMS: FULL Guide🚀 Harnessing Machine Learning and Large Language Models (LLMs) to Automate Gold Trading: A Practical Guide
Gold 🥇 has long been considered a safe-haven asset and a cornerstone of investment portfolios worldwide. The advent of advanced technologies like machine learning (ML) 🤖 and large language models (LLMs) 🧠 has opened new avenues for automating gold trading, enhancing accuracy, and improving profitability.
🌟 Why Automate Gold Trading with ML and LLMs?
Machine learning algorithms excel at detecting complex patterns, analyzing vast amounts of market data swiftly, and predicting price movements more reliably than traditional methods. LLMs, such as GPT-4, further augment trading strategies by interpreting news sentiment, macroeconomic data, and global geopolitical events in real-time, offering nuanced insights into gold market movements.
🛠️ Step-by-Step Practical Implementation
1. 📊 Data Acquisition and Preparation:
Historical gold price data (open, close, high, low).
Economic indicators: inflation rates 📈, currency valuations (USD strength 💵), and interest rates 📉.
News sentiment analysis 📰 derived from financial headlines using GPT-4.
Example Application:
Use APIs like Alpha Vantage or Yahoo Finance to pull historical gold prices.
Integrate financial news from Bloomberg or Reuters and summarize sentiments using GPT-4 API.
2. 🎯 Choosing the Right ML Model:
Time Series Forecasting Models: LSTM ⏳ (Long Short-Term Memory), GRU 🔄 (Gated Recurrent Units).
Classification Models: Random Forest 🌳, Gradient Boosting Machines (GBM), and XGBoost 🚀 for predicting upward/downward price movements.
Example Application:
Use Python libraries such as TensorFlow, Keras, and XGBoost to build and train these models.
Predict price changes for the next trading session to make informed entry and exit decisions.
3. 🤖 Integrating Large Language Models (LLMs):
Employ GPT-4 or similar LLMs to perform real-time sentiment analysis on financial news.
Translate sentiment results into numerical signals (e.g., +1 positive, 0 neutral, -1 negative).
Example Application:
Daily analyze major news headlines related to gold using GPT-4 to capture market sentiment.
Incorporate these signals into your ML model to refine price movement predictions.
4. 📈 Training and Validation:
Train models on historical datasets using cross-validation to prevent overfitting.
Optimize parameters using genetic algorithms 🧬 or grid search techniques.
Example Application:
Use scikit-learn’s GridSearchCV or genetic algorithms in libraries like DEAP for parameter tuning.
5. ⚙️ Automating Trades with Expert Advisors (EA) on MetaTrader 5:
Integrate ML and LLM-derived signals into MetaTrader 5 Expert Advisors.
Implement position-sizing logic, risk management, and automatic lot scaling.
Example Application:
Write custom MQL5 scripts that execute trades based on ML model predictions and sentiment analysis outputs.
Dynamically adjust position size based on account equity and market volatility.
🛡️ Practical Considerations for Robustness
Risk Management: Always integrate dynamic stop-losses 🛑, trailing stops, and overall account-level risk management.
Flat Market Detection: Employ advanced techniques like Hurst Exponent, ADX/DMI compression, or Bollinger Band squeezes 🔍.
Continuous Optimization: Regularly retrain models and update sentiment analysis parameters.
🌐 Benefits of Combining ML and LLMs
Enhanced predictive accuracy 📈 through combined numerical and textual data analysis.
Improved adaptability 🔄 in dynamic market conditions.
Reduced emotional bias 😌 and human errors in trading.
⚠️ Challenges and Solutions
Data Quality and Overfitting: Rigorous preprocessing and cross-validation.
Market Regime Shifts: Continuous monitoring and periodic recalibration of models.
📌 Real-World Application Examples
Example 1:
Combine sentiment analysis with price data to predict significant market movements around economic announcements (e.g., Fed rate decisions).
Example 2:
Deploy an ML-driven EA on MetaTrader 5, adjusting positions based on both predictive analytics and real-time news sentiment shifts, significantly improving trade timing and results.
Example 3:
Use an adaptive ML model that retrains weekly with the latest market data, ensuring the trading algorithm remains relevant to current market conditions.
🎉 Conclusion
Automating gold trading using machine learning and LLMs presents an exciting frontier for traders. By leveraging these technologies, traders can significantly enhance decision-making, effectively manage risk, and achieve consistent profitability. The future of gold trading automation lies in blending cutting-edge algorithms with insightful real-time analysis, making now the perfect time to integrate ML and LLMs into your trading toolkit. 🥇🤖💹

Trade the Angle, Not the Chop: Angle of MA ExplainedNot all moving averages are created equal. While most traders rely on the slope of a moving average to gauge trend direction, the Angle of Moving Average script by Mango2Juice takes it a step further—literally measuring the angle of the MA to help filter out sideways markets and highlight trending conditions.
Let’s explore how this tool works, how we use it at Xuantify, and how it can sharpen your trend-following strategy.
🔍 What Is the Angle of Moving Average?
This indicator calculates the angle of a moving average (default: EMA 20) to determine whether the market is trending or ranging. It introduces a No Trade Zone , visually marked in gray, to signal when the angle is too flat—suggesting the market is consolidating.
Key Features:
Measures the slope of the moving average
Highlights ranging zones with a gray color
Helps filter out low-momentum conditions
Customizable MA type and length
🧠 How We Use It at Xuantify
We use the Angle of Moving Average as a trend filter —not a signal generator.
1. Trend Confirmation
We only take trades in the direction of a steep enough angle. If the MA is flat or in the gray zone, we stay out.
2. Entry Timing
We combine this with structure tools (like BOS/CHOCH) to time entries after the angle confirms a trend is underway.
🎨 Visual Cues That Matter
The script uses color to show when the market is:
Trending : Clear slope, colored line
Ranging : Flat slope, gray line (No Trade Zone)
This makes it easy to:
Avoid choppy markets
Focus on momentum-driven setups
Stay aligned with the dominant trend
⚙️ Settings That Matter
You can customize:
MA Type : EMA, SMA, etc.
MA Length : Default is 20
Angle Sensitivity : Adjust to define what counts as “flat”
⚙️ Higher timeframe alignment
You can look at HTFs for better and stronger entry and exit points.
Below a 1H and 4H chart where the 4H clearly adds strong buying power for a good long entry point.
🔗 Best Combinations with This Indicator
We pair the Angle of MA with:
Structure Tools – BOS/CHOCH for trend context
MACD 4C – For momentum confirmation
Volume Profile – To validate breakout strength
Fair Value Gaps (FVGs) – For sniper entries
⚠️ What to Watch Out For
This is a filter , not a signal. It won’t tell you when to enter or exit—it tells you when not to trade . Use it with price action and structure for best results.
🚀 Final Thoughts
If you’re tired of getting chopped up in sideways markets, the Angle of Moving Average is a simple but powerful filter. It helps you stay out of low-probability trades and focus on trending opportunities.
Try it, tweak it, and see how it fits into your system.

Heikin Ashi VS Regular candlesticks - EducationalNASDAQ:AMZN
Everything is explained in the video.
I hope you will find it very educational and test it. Those who trade stocks will probably switch to Heikin Ashi :)
Thank you!

Learn TOP 3 Elements of a Perfect SWING TRADE (GOLD, FOREX)
In the today's post, I will share with you a formula of ideal swing trading setup.
✔️Element 1 - Market Trend
When you are planning a swing trade, it is highly recommendable that the direction of your trade would match with the direction of the market trend.
If the market is trading in a bullish trend, you should look for buying the market while if the market is bearish, you should look for shorting.
Take a look at CHFJPY pair on a daily. Obviously, the market is trading in a bullish trend and your should look for swing BUYING opportunity.
✔️Element 2 - Key Level
You should look for a trading opportunity from a key structure.
IF the market is bullish, you should look for buying from a key horizontal or vertical SUPPORT, WHILE if the market is bearish, you should look for shorting from a key horizontal or vertical RESISTANCE.
CHFJPY is currently approaching a rising trend line - a key vertical support.
Please, note that if the price is NOT on a key structure, you should patiently wait for the test of the closest one.
✔️Element 3 - Confirmation
Once the market is on a key level, do not open a trading position blindly. Look for a confirmation - for the sign of strength of the buyers, if you want to buy or for the sign of strength of the sellers, if you are planning to short.
There are dozens of confirmation strategies, one of the most accurate is the price action confirmation.
Analyzing a 4H time frame on CHFJPY, we can spot a falling wedge pattern. While the price is stuck within that, the minor trend remains bearish. Bullish breakout of the resistance of the wedge will be the important sign of strength of the buyers and can be your strong bullish confirmation.
Following these 3 conditions, you will achieve high win rate in swing trading. Try these techniques yourself and good luck in your trading journey.
❤️Please, support my work with like, thank you!❤️
I am part of Trade Nation's Influencer program and receive a monthly fee for using their TradingView charts in my analysis.

Two MAs, One Ribbon: A Smarter Way to Trade TrendsSome indicators aim to simplify. Others aim to clarify. The RedK Magic Ribbon does both, offering a clean, color-coded visualization of trend strength and agreement between two custom moving averages. Built by RedKTrader , this tool is ideal for traders who want to stay aligned with the trend and avoid the noise.
Let’s break down how it works, how we use it at Xuantify, and how it can enhance your trend-following setups.
🔍 What Is the RedK Magic Ribbon?
This indicator combines two custom moving averages:
CoRa Wave – A fast, Compound Ratio Weighted Average
RSS_WMA (LazyLine) – A slow, Smooth Weighted MA
When both lines agree on direction, the ribbon fills with:
Green – Bullish trend
Red – Bearish trend
Gray – No-trade zone (disagreement or consolidation)
Key Features:
Visual trend confirmation
No-trade zones clearly marked
Customizable smoothing and length
Works on any timeframe
🧠 How We Use It at Xuantify
We use the Magic Ribbon as a trend filter and visual guide .
1. Trend Confirmation
We only trade in the direction of the ribbon fill. Gray zones = no trades.
2. Entry Timing
We enter near the RSS_WMA (LazyLine) for optimal risk-reward. It also acts as a dynamic stop-loss guide.
🎨 Visual Cues That Matter
Green Fill – Trend is up, both MAs agree
Red Fill – Trend is down, both MAs agree
Gray Fill – No-trade zone, MAs disagree
This makes it easy to:
Avoid choppy markets
Stay aligned with the dominant trend
Spot early trend shifts
⚙️ Settings That Matter
Adjust CoRa Wave length and smoothness
Tune RSS_WMA to track price with minimal lag
Customize colors, line widths, and visibility
🧩 Best Combinations with This Indicator
We pair the Magic Ribbon with:
Structure Tools – BOS/CHOCH for context
MACD 4C – For momentum confirmation
Volume Profile – To validate breakout strength
Fair Value Gaps (FVGs) – For sniper entries
⚠️ What to Watch Out For
This is a confirmation tool , not a signal generator. Use it with structure and price action. Always backtest and adjust settings to your asset and timeframe.
🚀 Final Thoughts
If you want a clean, intuitive way to stay on the right side of the trend, the RedK Magic Ribbon is a powerful visual ally. It helps you avoid indecision and focus on high-probability setups.
What really sets the Magic Ribbon apart is the precision of its fast line—the CoRa Wave. It reacts swiftly to price action and often aligns almost perfectly with pivot reversals. This responsiveness allows traders to spot potential turning points early, giving them a valuable edge in timing entries or exits. Its accuracy in identifying momentum shifts makes it not just a trend filter, but a powerful tool for anticipating market moves with confidence.
Try it, tweak it, and let the ribbon guide your trades.

Follow the Flow: Trading with Liquidity ZonesLiquidity is where the market breathes. The Liquidity Zones indicator by BigBeluga helps traders visualize where large players may be hiding orders—revealing the zones where price is most likely to react, reverse, or accelerate.
Let’s break down how this tool works, how we use it at Xuantify, and how you can integrate it into your own strategy.
🔍 What Is the Liquidity Zones Indicator?
This open-source tool identifies pivot highs and lows filtered by volume strength and plots them as liquidity zones —highlighting areas where buy/sell orders are likely to accumulate.
Key Features:
Volume-filtered pivot detection (Low, Mid, High)
Dynamic or static liquidity zone boxes
Color intensity based on volume strength
Liquidity grab detection with visual cues
These zones act as magnets for price , helping traders anticipate where reactions, reversals, or stop hunts may occur.
🧠 How We Use It at Xuantify
We use Liquidity Zones as a contextual map for structure and execution.
1. Entry & Exit Planning
We align entries near untested liquidity zones and use them as targets for exits—especially when confirmed by structure or momentum.
2. Liquidity Grab Detection
When price pierces a zone and reverses, it often signals a liquidity sweep . We use this as a trigger for reversal setups.
3. Volume Context
Zones with higher volume intensity are prioritized. These are more likely to attract institutional activity and generate stronger reactions.
🧭 Dynamic vs. Static Zones
The indicator offers both dynamic and static zone modes:
Dynamic : Box height adjusts based on normalized volume, showing how much liquidity is likely present.
Static : Consistent box size for cleaner visuals and easier backtesting.
Why this matters:
Dynamic zones reflect real-time volume strength
Static zones offer simplicity and clarity
Both modes help visualize where price is likely to “grab” liquidity
⚙️ Settings That Matter
To get the most out of this tool, we recommend:
Volume Strength = Mid or High for cleaner zones
Enable Dynamic Mode when trading volatile assets
Use Color Intensity to quickly spot high-liquidity areas
🔗 Best Combinations with This Indicator
We pair Liquidity Zones with:
Market Structure Tools – BOS/CHOCH for context
Momentum Indicators – Like RSI or MACD for confirmation
Fair Value Gaps (FVGs) – For precision entries near liquidity
This layered approach helps us trade into liquidity , not against it.
⚠️ What to Watch Out For
Liquidity zones are not signals —they’re context . In fast-moving or low-volume markets, price may ignore zones or overshoot them. Always combine with structure and confirmation.
🔁 Repainting Behavior
The Liquidity Zones indicator is designed to be non-repainting . However, due to waiting for pivot confirmation, the zones are plotted in hindsight. This makes it suitable for real-time execution .
⏳ Lagging or Leading?
This tool is partially lagging —it waits for pivot confirmation and volume validation before plotting a zone. However, once plotted, these zones often act as leading levels , helping traders anticipate where price may react next.
🚀 Final Thoughts
The Liquidity Zones indicator by BigBeluga is a powerful visual tool for traders who want to understand where the market is likely to move—not just where it’s been. Whether you’re trading reversals, breakouts, or mean reversion, this tool helps you stay aligned with the market’s hidden intent.
Add it to your chart, test it, and see how it sharpens your edge.

How To: Automate TradingView Alerts to Real Trades The Easy WayHere’s a demonstration of how you can connect the dots using tools you probably already have: TradingView, email, and a simple automation setup on your computer.
How This Works
TradingView strategy spots a trade:
Your custom Pine Script runs on any chart, analyzing price action, trends, or pivots. When your strategy sees a buy or sell signal, it triggers an alert.
Alert lands in your email inbox:
TradingView sends a custom email alert (with your chosen keywords in the subject line) to your email account.
Your email app does the magic:
With a rule set up in Mozilla Thunderbird (or similar desktop email client), your computer can recognize the alert email as soon as it arrives.
Automatic trading bot executes the order:
The email filter launches a small program—your own buy or sell executable. This bot can be coded to interact with an exchange API (like Binance) and place the order, with whatever safety checks you want.
Step-by-Step Setup
1. Create Your Strategy in TradingView
Write your logic in Pine Script, or use any community script you like.
Set up an alert that sends you an email when a buy or sell is triggered.
Tip: Use specific words in the subject line like “order buy @” or “order sell @” to make automation easy.
2. Set Up Your Email Rule (Thunderbird Example)
Use Mozilla Thunderbird as your desktop mail client.
Go to Message Filters and create a new rule:
Condition: If Subject contains “order sell @” (for sell), or “order buy @” (for buy).
Action: Launch your chosen executable file (e.g., SELL SPOT AT MARKET PRICE.exe for sells, and a corresponding one for buys).
3. Create/Package Your Trading Bot
You can write your bot in Python and package it as a standalone .exe file with PyInstaller.
Example logic:
Connect to Binance using secure API keys (use keyring for safety).
On sell: place a limit sell order, and if it’s not filled in 30 seconds, cancel and execute a market sell instead.
On buy: same idea, but for buying.
4. Automate the Entire Chain
Once set up, the process is seamless:
TradingView strategy → Email alert → Thunderbird filter → Buy/Sell executable → Real trade
What’s Cool About This Demo
No manual clicking required.
You’re in control: Design your own entry/exit logic, risk management, and trade size.
Customizable: Works with any exchange that supports API trading.
Extensible: Add more rules, logging, or notifications as you wish.
Disclaimers
This workflow is for educational and demonstration purposes only.
You are fully responsible for your own trading actions, risk management, and system security.
I am not providing financial advice or trade recommendations.
Always test thoroughly—preferably with a demo account—before using real funds.
Keep your exchange API keys safe and never share your automation scripts.
How to Set Up Thunderbird to Process Emails and Trigger Scripts
This guide will help you configure Thunderbird to watch for TradingView alert emails and automatically launch your custom buy or sell executable file based on the alert type.
1. Install Thunderbird
Download Mozilla Thunderbird:
www.thunderbird.net
Install and open Thunderbird on your computer.
2. Add Your Email Account
Add the email address where you receive TradingView alerts (e.g., Outlook, Gmail, etc.).
Let Thunderbird sync your inbox.
3. Prepare Your Executable Files
Have your buy and sell trading bots packaged as .exe files (e.g.,
BUY SPOT AT MARKET PRICE.exe and SELL SPOT AT MARKET PRICE.exe).
Place these files in a known folder, such as
C:\Users\YourName\Documents\buy sell executables\.
4. Set Up Message Filters in Thunderbird
a. Go to the menu and choose
Tools → Message Filters...
or
Right-click your account in the left sidebar → Settings → Message Filters.
b. Click “New...” to create a new filter.
For a Sell Alert:
Filter Name: Subject contains: order sell @
Apply filter when:
✅ Getting New Mail
Match all of the following:
Subject contains order sell @
Perform these actions:
Launch File
Select your sell executable, e.g.:
C:\Users\YourName\Documents\buy sell executables\SELL SPOT AT MARKET PRICE.exe
For a Buy Alert:
Create a similar filter, but use:
Subject contains order buy @
Launch File → your buy executable, e.g.:
C:\Users\YourName\Documents\buy sell executables\BUY SPOT AT MARKET PRICE.exe
Tip: The “Launch File” action might require the “FiltaQuilla” add-on in Thunderbird, which enables advanced filtering actions like launching files.
5. Test Your Setup
Send yourself a test email with the appropriate subject line (e.g., order sell @).
If set up correctly, Thunderbird will process the new email and automatically run your chosen executable.
6. Going Live
Once tested, enable your TradingView alerts to email your account with the exact subject lines your filters are set to catch.
Your trading automation is now ready to work seamlessly!
Additional Notes
Security: Only set up automation on a trusted computer. Make sure your executables are secure and not accessible to others.
Logging: Consider adding logging in your Python bot to keep track of executed trades.
Add-ons:
If “Launch File” is not available, install the FiltaQuilla add-on in Thunderbird. After installation, the action “Launch File” will be available in the filter actions.
Summary Checklist
Thunderbird installed and set up with your email
Buy/sell scripts packaged as .exe files
Message filters set up for both buy and sell alerts
(Optional) FiltaQuilla add-on installed
Tested and working before going live
