Bullish RatesWatch Out if the the 10Y closes above 4.30.
I would start getting very bearish on equities if this happens.
Price action on yields here indicated higher long term rates.
It is currently setting up as if the tax protest will happen.
The wave count here is just a suggestion for this outcome. Long-term rates could spike one final time before the Fed panics. This also lines up with the 10Y minus 2Y yield curve uninverting. The uninversion has started, but typically it will shoot up before downturns and that would happen if this continues.
10yr

US10Y Technical Breakdown – Post-Moody’s DowngradeMoody’s has downgraded the US credit rating for the first time since 2011, citing rising debt levels and long-term fiscal challenges.
This move sends a clear warning signal about America’s fiscal path and adds fresh uncertainty to markets already navigating interest rates, inflation, and geopolitical risks.
Focus on the US 10-Year Treasury Yield as the market’s pulse on sovereign risk, inflation expectations, and future borrowing costs. Tracking its medium-term trend will provide crucial clues on market sentiment and risk appetite.
Medium-Term Market Analysis
(6-12 Months)
1. Structural Fiscal Risks
This downgrade highlights growing concerns over the US debt trajectory and political gridlock around spending and debt ceilings.
It’s less about an immediate crisis, more about long-term sustainability.
2. Rising Yields and Market Volatility
The 10-year Treasury yield could move higher, beyond 4.60% we could see rates possibly testing previous resistance of 4.80% (Jan 2025) or 5.00% (Oct 2023).
Higher yields mean increased borrowing costs, which can pressure interest-sensitive sectors like tech and real estate and add volatility to equities.
3. Federal Reserve’s Tough Balancing Act
With bond yields edging up, the Fed faces a dilemma: delaying cuts further could risk inflation climbing higher.
However, this downgrade raises the likelihood that the Fed could keep rates higher for longer than many investors expect.
4. Dollar and Capital Flow Shifts
While a credit downgrade may initially pressure the US dollar, its safe-haven status remains strong.
Global capital could increasingly look to alternatives like emerging markets or gold, leading to shifts in international financial flows.
Perspective
While Moody’s downgrade is a serious signal, it’s important to consider:
1) Political Leverage: Sometimes, rating agencies’ decisions can influence political negotiations. This downgrade may add pressure on US lawmakers to reach fiscal compromises. It’s a tool, not necessarily a verdict.
2) US Dollar & Debt Demand Resilience: Despite concerns, US Treasury securities remain the world’s primary safe asset, with global demand still robust. This could temper yield spikes and limit fallout.
Some could view the downgrade as “priced in” to a degree, given ongoing debt ceiling battles and past political brinkmanship.
If true, markets may react less dramatically than feared.
Watch
US 10-Year Yield: Key indicator to watch for shifts in risk sentiment and inflation expectations.
Equities: Prepare for increased volatility; consider defensive sectors and value plays.
Credit Markets: Monitor for widening spreads as risk aversion grows.
Policy Signals: Fed communications and US political developments will be critical catalysts.
This Moody’s downgrade isn’t just a headline, it’s a medium-term signal to recalibrate risk and position for a more uncertain fiscal backdrop.

10Y Note Auction & Why Markets did %10 Movement with Last Data?Hello Traders tomorrow we have 10-Year Note Auction data and I wanted to prepare a nice little information for you about this topic because the data released last month showed an immediate 10% increase and from what I saw, many people had no idea what was happening.
📌 What is the 10-Year Note Auction?
The U.S. government regularly issues 10-year Treasury notes to finance its budget. The auction result reflects investor demand and long-term interest rate expectations. The yield (interest rate) that results from the auction is a key benchmark for financial markets globally.
🔄 Connection to U.S. Stocks and EUR/USD
🟢 If Demand Is Strong (Yields Stay Low):
Investors are eager to buy U.S. debt, pushing prices up and yields down.
This indicates confidence in the U.S. economy and little concern about inflation or rate hikes.
Stock markets generally react positively.
🔴 If Demand Is Weak (Yields Rise):
Investors require higher returns, possibly due to inflation fears or policy tightening expectations.
This pushes yields up, increasing borrowing costs and reducing the attractiveness of risk assets.
Stocks typically decline, and the dollar strengthens.
💱 Effect on EUR/USD
🟢 If Yields Rise:
U.S. dollar becomes more attractive due to higher returns.
Investors buy USD to invest in Treasuries.
EUR/USD typically falls.
🔴 If Yields Fall:
Lower yields reduce the appeal of the dollar.
Investors may move capital elsewhere.
EUR/USD tends to rise.
🗓️ Latest 10-Year Treasury Auction – April 9, 2025
Auction Size: $39 billion
High Yield: 4.435%
Expected (WI) Yield: 4.465%
Outcome: Strong demand – yield came in lower than expected.
📊 Post-Auction Market Reactions
🔹 10Y Treasury Yield:
Before auction: ~4.466%
After auction: Dropped to ~4.38%
➝ Reflects strong investor demand and confidence in long-term stability.
🔹 S&P 500 Index:
Lower yields reduce borrowing costs and support equity valuations.
Investors often shift toward riskier assets like stocks when yields fall.
The S&P 500 responded positively after the auction.
🔹 EUR/USD:
Falling yields reduce the dollar's relative appeal.
This may push EUR/USD higher, depending on other macroeconomic influences (like ECB policy or geopolitical risks).
✅ Conclusion
The April 9, 2025, 10-year Treasury auction showed strong demand with a yield lower than market expectations. This led to a drop in yields, a positive reaction in U.S. stock markets, and potential downward pressure on the dollar, which may support EUR/USD.

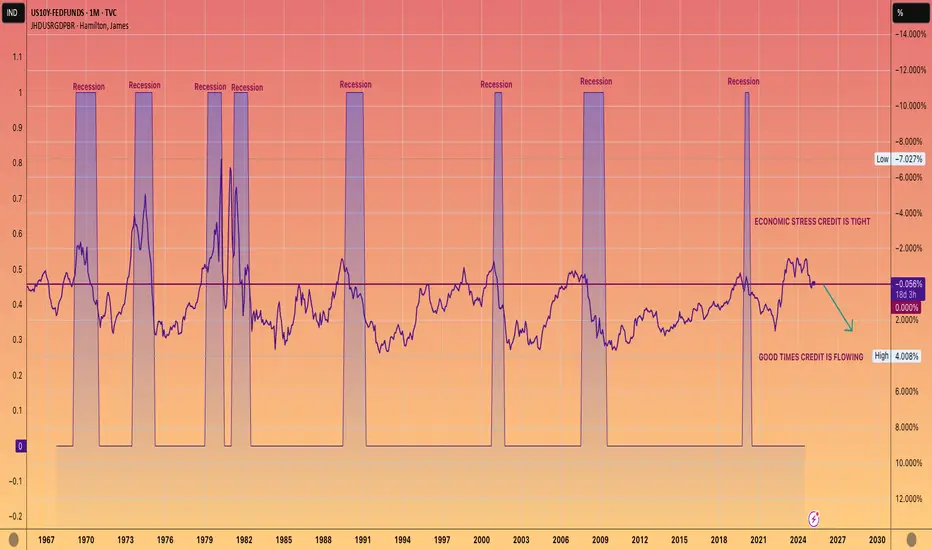
WE ARE COMING OUT OF A RECESSION. NOT GOING INTO ONE.This chart shows 10-year yield, which is closely tied to mortgage rates, minus the Federal funds rate.
When this figure is negative, it typically indicates that we are experiencing a recession or economic downturn.
Conversely, a positive number usually aligns with economic growth, often referred to as the good times.
While it's up to you to determine the reasons behind a official recession not being declared during the Biden administration, the undeniable data reflects a prolonged period of economic strain.
However, the current trend seems to be shifting towards a positive reading, which should lead to more accessible lending and economic growth.
AKA The good times are coming.
don't get caught chasing yields higher Intraday Update: The divergent RSI in the 10yr ZN's is allowing for a pullback/moderation of overbought intraday conditions, and yields have recovered near term. However, we expect dips to be bought in any dip towards the 110'00 level.

10yr notes inverted H&S patternIntraday Update: 10yr notes has an inverted head and shoulders pattern in play, however is at the 61.8% Fibonacci retracement level of the Dec 8 highs to Jan 14 lows.

German 10 year bund (yield chart) giant HS patternGerman 10 year bund keeps scaling.
Price action is reflected on the charts. On the long term, seems like the german 10 year bund is building a huge Head and Shoulders pattern. That would be consistent with rates going down in the eurozone.
But… if the German bund should spike over 2.50%, that would probably mean that euro rate cuts will be on hold for longer than expected.
IMO, it’s all about geopolitics, as it’s also related to oil/natural gas supply from the east, commercial war with the USA, China and India, etc. all of them are inflationary and would also be pushing government spending to the upside on military and defense systems, detracting investment capacity from the private sectors…
All to be seen in coming weeks… any insights you would like to share about the topic, please let me know!

Bitcoin - Another sign that Fed credibility is waning.A Sick Feeling in the Belly of the Yield Curve
Another sign that Fed credibility is waning.
The socioeconomic point of view is that, as the Supercycle bear market develops, central banks will lose their mantle as being omnipotent directors of markets. Whereas in the bull market, central bankers like Alan “the Maestro” Greenspan were lauded because positive social mood was driving the stock market higher, in the bear market central bankers will be vilified as negative social mood causes a downtrend in stock prices.
Yesterday, Fed Chairman Jerome Powell sought to reassure Americans that the series of interest rate hikes that the central bank is embarking on would not tip the U.S. economy into recession. The bond market promptly ignored those soothing words and the yield curve flattened. A flattening yield curve, whereby the positive gap between short-dated bonds and long-dated bonds is narrowing, is a sign that the market is anticipating slower economic growth. When the yield curve inverts, with long-dated yields below short-dated, it has historically been a signal that an economic recession is on the horizon.
That historical relationship is most generally related to the yield spread between 2-year yields and 10-year yields, and that yield curve has been flattening over the past year from 1.50% to around 0.20% where it is currently hovering. So, not quite inverted yet, but trending in that direction.
However, in the so-called belly of the yield curve, the area between 5 and 10-year maturity, the message is already here. The chart below shows that the yield spread between 5 and 10-year U.S. Treasury yields has declined precipitously over the last year and, yesterday, turned negative. This yield curve inversion is a clue that a 2-yr /10-yr (2s 10s in industry vernacular) inversion is probably on its way.
Despite what the Fed says, a beast of a recession may be approaching.
U.S. Treasury 10-Year Yield Minus 5-Year Yield

10yr possible false breakoutPossible false breakout US 10yr yields and this is a risk for risk sensitive currencies like USDJPY and USDCHF

10 Year wants 5%...at a minimumDo you really need to ask if interest rates have topped out?
Head & Shoulders patterns at tops and bottoms are generally spot on...this Inverse H&S pattern occurred at a bottom, clearly broke out from the neckline and just wants 5%...at a minimum.
"Don't fight the Fed"
The Fed is not going to pivot to the downside anytime soon...why would they? What makes anyone think this is on the horizon?
Here are the 3 things Powell stated would need to happen for a pause (not a pivot ) at Jackson Hole:
1. Lower Growth
2. Softening Labor Market
3. Inflation on pace to 2%.
2022 Q2 vs. Q3 GDP came in positive and much stronger than expected, Jobs reports remain hot and inflation isn't anywhere near 2%. So at this point, we can't even check off any boxes for a possible pause in rate hikes let alone a pivot . In addition, Powell hasn't really wavered in his statements since Covid, he's been pretty straightforward, so why would he all of a sudden change his behavior?

10 yr Bond yields - BullishAcross the board 10 year bonds look scary. The italy 10 yr is so clear i figured id publish it. Same with Cadanian 10 yr, US 10 yr. Central banks must be shitting themselves. It'll be an interesting next week or 2.

10Y Bonds vs. the Dollar Index - DXY
On this Monthly Chart we can see the correlation between the 10Y Government Bonds (in teal) vs. the Dollar Index - DXY (in light orange).
The correlation is somewhat pretty strong and the 10Y can be used to somewhat predict moves in the Dollar Index (DXY).
Now looking at the Daily chart, we can see that the 10Y has been growing from a support level of around the low 3% range.
I forecast that the DXY will continue continue to trend higher from the recent low at around the 99.89 level.
Of course this is only one of the many other indicators we can use to predict currency moves.

Knock Knock Who is there? it is me, US10Y 4.2%Knock knock.
Who's there?
I. O.
I. O. who?
Me.
When are you paying Treasury holders back?
Never!
Bullish Breakout ...to be continued...
The information and publications are not meant to be, and do not constitute, financial, investment, trading, or other types of advice or recommendations.

Market correlationI'm testing this correlation and looking at the bounce-up for the 10-year yields
To buy indices and sell gold, let's see :)
Let me hear from you..

10-Year Treasury Yield Ready to Extend Advance to 2022 Highs?The 10-year Treasury yield has been rising since the end of January in the aftermath of a Bullish Morning Star candlestick pattern.
Now, prices are approaching the December high at 3.905 after confirming a breakout above a falling trendline from October.
Meanwhile, a bullish Golden Cross is set to form between the 20- and 50-day Simple Moving Averages, further offering an upside technical bias.
Confirming a breakout above the December high exposes the 78.6% Fibonacci retracement level at 4.118 towards the 2022 peak at 4.335.
US10Y

US 10 YR Yield vs SPX hit a resistance that started other bottomZoom out and in Oct US 10 Year yields hit a supply level from Dec 2018 which started that big rally, we rejected hard from that in Oct. Now heading into resistance on shorter timeframes that started the other two major equities bottoms. If this rejects here which I think it can that will keep the rally continuing.

US 10Year - 02Year - Yield Inversion (Posted 01FEB23)In this chart you can see how inverted we are and for how long on the 10-2year. I also have the 10-03mo chart that I will link to this also. This is a recession indicator. It will be interesting to follow this chart as the FOMC tries to bring the curve back under control. I will return frequently to run the "Play" and see how they do over the months!

Will the backup hold?The 10 year T is fighting the line. A bounce and break of current downtrend could mean more pain. But a break of the secondary support would demolish the bears as it would signal my long-expected blow-off top in the U.S. stock market. Stay tuned.

10yr-2yr Inversion VS Stock market bottomThe last two times of market recessions, Dotcom and the Great Recession both times the stock market did not hit bottom until 3yrs after the inversion happened.
Meaning we are only 129 days into this one. I would take advantage of this current rally and not get overly long on positions, but sell out of positions into strength.
The FED has made it clear there will be more pain ahead, and they will only strengthen their resolve next meeting.
Either way, a .50 basis or a .75 move is on the table stocks will not bottom until the inversion starts to un-invert, as proven in the past.

10yr predictions before FED Dec meeting @ Dec meeting Dec 14
Cur Rate 3.75 4 3.75 4 3.75 4 4.25 4.5
Fed Hikes 0.25 0.25 0.5 0.5 0.75 0.75 0.25 0.25
Future Rate 4 4.25 4.25 4.5 4.5 4.75 4.5 4.75
4.125 4.375 4.625 4.625


US 10-Year Treasury Yield Bullish Engulfing in Focus Before FedThe US 10-year Treasury yield left behind a Bullish Engulfing candlestick pattern on the daily chart this Friday.
This is as the bond tested a rising range of support from August.
A turn higher from here could open the door to revisiting the October high of 4.33.
Otherwise, breaking lower exposes the 50-day Simple Moving Average, which could reinstate the upside focus.
All eyes next week turn to the Fed, which is expected to deliver a 75-basis point rate hike. The focus will rather be on their language going forward as markets increasingly expect moderation.
TVC:US10Y

Prediction of next financial downturnAccording to FedWatch Tool www.cmegroup.com there will be 2 or even 3 interest rate CUTS in late 2020.
It means the difference between US10-US02Y spread will move up - arrow on the plot. We can already see that values jumped to 1.63 and that will continue!
The vertical dashed lines indicate the official beginning of recessions from fred.stlouisfed.org
While the horizontal line (red/green) indicate 250 days moving average; Every time US10Y-US02Y crossed the 250d average the recession occurred but was not announced until a few months later!
It means interest cuts will follow during Presidential elections in the US and recession will not be announced until 2021!!!
