EURJPY breakout: Buying dips into BOJ last hike?EURJPY has broken out of a triangle consolidation on the 4-hour chart and is retesting the 182 level as support. With Japan pumping fiscal stimulus into a shrinking economy and the BOJ nearing its cycle peak, the macro setup favours buying dips for a continuation higher.
In this video, we break down why the yen remains weak despite rising yields and an imminent BOJ hike, focusing on the toxic mix of fiscal slippage and soft growth. Then, we map out the technical buy zone between 181.60 and 180.70, targeting a final fifth-wave push toward 183.40 and 185.00.
Key drivers
Japan macro: A massive ¥21.3 trillion stimulus package into a contracting economy (Q3 GDP -2.3% annualised) has spiked yields on debt concerns rather than growth, weighing on the yen.
Central bank divergence: The BOJ is expected to hike next week but signal it's near the terminal rate ("one-and-done"), while the ECB holds at 2%.
Technical structure: We are in a continuation pattern (triangle breakout) that likely marks wave 4 of a larger sequence, implying one last impulse leg higher.
Key levels: Support at 181.60 (161.8% extension of the internal wave) and 180.70 (structural pivot). Upside targets at 183.40 (138.2% extension) and 184.29–185.00 (161.8% extension).
Trade plan: Look to buy dips into the 181.60–180.70 zone with a stop below the previous low, taking partial profits at 183.40 and 184.29, and trailing the rest for a potential extension.
Trading the yen cross breakout? Share your entry levels in the comments and follow for more macro-to-technical trade setups.
This content is not directed to residents of the EU or UK. Any opinions, news, research, analyses, prices or other information contained on this website is provided as general market commentary and does not constitute investment advice. ThinkMarkets will not accept liability for any loss or damage including, without limitation, to any loss of profit which may arise directly or indirectly from use of or reliance on such information.
Boj

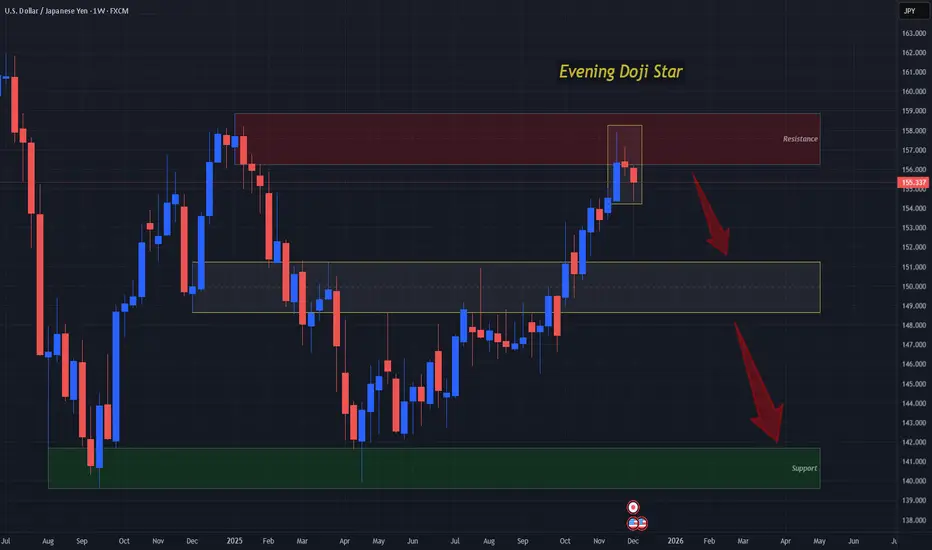
Evening Doji Star Forms at Weekly Resistance on UJAn Evening Doji Star is a Bearish Reversal Candlestick Pattern that consists of 3 Candlesticks:
1) Large Bullish Candle
2) Doji Candle
3) Large Bearish Candle
The Doji Candle represents indecision in the markets where the Bulls nor the Bears were able to overcome one another.
The last candle being a bearish one suggests that the Bears have successfully taken over and are looking to push price down!
This Candlestick Pattern itself is a strong indication that price is looking to reverse from this Resistance Level at 158 - 156 formed at the end of last year/beginning of this year, but what will also add "fuel to the fire" is if the next candle, being the Confirmation Candle of the pattern turns out to be a bearish one!
If so, I am looking for FX:USDJPY to continue this bearish push down in price to the next Area of Value being at 151 - 148 with a stronger Support Level down at the 141 - 139 where price last visited in April this year.
Fundamentally, USD has a heavily news filled week with Sept. and Oct. JOLTS Job Opening being released, Unemployment Claims, ADP Weekly Employment Change and the Federal Reserve with an 86% chance of Cutting Interest Rates on the 10th.
BOJ is set to Hike Interest Rates the following week, and this, fundamentally, could be the catalyst for the Bearish Reversal we see setting up in technical terms on the charts!
Final Target yet to be run on CHFJPYThis inverse Head and shoulders has produced fantastic gains already
What suggests that final target will be met
is that Yen vs other crosses is still yet trigger their respective necklines!
I assume more madness to come from the #BOJ in the next Financial Panic.
Like the Bank of England another Island nation probably first to embark on a new wave of #QuantitativeEasing

Bank of Japan Losing Credibility. USDJPY eyes breakout. Continued or large scale QE, capped yields and reluctance to normalise (or being forced back in to easing during a downturn) would anchor Japanese yields far below peers encouraging capital outflows and undermining confidence in the currency.
A shrinking and ageing population chronic fiscal deficits very high public debt and history of trade deficits in recent years represent structural headwinds that can justify a weaker Yen if investors start to question long-run debt sustainability.
With a wide and persistent rate gap, leveraged global players can keep borrowing Yen to buy higher yield assets abroad.
If markets begin to doubt the BOJ's ability to manage the government bond market without either monetisation or financial repression, investors may demand a steep currency discount rather than high nominal yields, instead of typical "higher rates, Stronger FX" reaction.
Global risk: If the dollar regains or maintains "only game in town" safe-haven status in a world of repeated shocks - while the Yen loses it's traditional safe haven status because of Japan's Macro position - USDJPY can behave more like a one way-risk trade than a mean reverting pair.

Is the EUR/JPY Rebound Real or a Bull Trap?
The EUR/JPY cross climbs near 180.70, but technical barriers and hawkish central banks cloud the horizon.
The EUR/JPY pair has snapped a three-day losing streak, gaining traction during the Asian session on Tuesday. Spot prices currently hover near the 180.70 area, marking a 0.10% intraday increase. The market found solid support near the psychological 180.00 mark, bouncing from a four-day low. Traders are now positioning themselves ahead of crucial Eurozone inflation data, which serves as the primary catalyst for this upward momentum.
Macroeconomic Drivers: The Inflation Paradox
Investors focus intensely on the upcoming Eurozone Harmonized Index of Consumer Prices (HICP) data. Forecasts suggest headline inflation rose 2.1% YoY in November, with core inflation edging up to 2.5%. While France and Spain showed cooling prices, Germany reported unexpectedly high inflation figures. This divergence reinforces the argument for a European Central Bank (ECB) policy hold. A pause in rate cuts acts as a significant tailwind for the Euro.
Geostrategy and Global Risk Sentiment
Geopolitical stability and market optimism currently undermine demand for traditional safe-haven assets like the Japanese Yen (JPY). A positive global risk tone encourages investors to seek higher yields, favoring the Euro over the Yen. Furthermore, global trade policy discussions are prompting capital flows into currencies backed by stable export economies. The Eurozone’s industrial adaptability positions it favorably in this environment, suppressing JPY strength despite potential interventions.
Leadership and Governance: The BoJ Stance
Bank of Japan (BoJ) Governor Kazuo Ueda recently delivered hawkish remarks regarding economic projections. He stated that the probability of meeting growth targets is rising. Concurrently, Finance Minister Satsuki Katayama sees no divergence between the government and the BoJ. However, the market has temporarily priced in these warnings. The immediate focus remains on the ECB’s reluctance to cut rates, which overpowers the BoJ’s normalization narrative in the short term.
Industry Trends and Innovation Economics
European currency strength draws support from resilient industrial sectors. High-tech manufacturing and advanced engineering firms in the Eurozone continue to drive wage growth. This economic activity contributes directly to the sticky services inflation observed in the region. Unlike Japan’s deflationary history, Europe’s innovation ecosystem maintains price pressures that prevent the ECB from adopting a dovish stance too quickly.
Technical Outlook and Support Levels
Technically, the pair faces immediate resistance at the 181.75 barrier.
A breach here could open the path toward 182.35. Conversely, failure to maintain momentum may trigger a slide back toward the 179.40 support level. Traders must monitor stochastic indicators, which signaled negativity yesterday but are now neutralizing. The market awaits the HICP release to confirm the next directional breakout.

'Sell Japan' trade opens door to 160 USDJPY on fiscal concernsUSDJPY has ripped through 157 with RSI pushing near extreme overbought, and the pair is now magnetised towards a key Fibonacci and prior-high cluster around 158.70–159.
In this video, I break down how the FOMC minutes maintained the recent status quo from the Fed, while blockbuster Nvidia earnings and Japan’s significant new stimulus package have combined to drive the latest leg of the USD/JPY rally. On the chart, the focus is a completed triangle breakout above 155 and an upside trajectory toward 158.70, 160 and potentially the 162 high reached in 2024.
Key drivers
Fed minutes offer no signals that policymakers should cut in December, keeping US yields and the dollar supported.
Nvidia’s earnings beat and guidance have boosted risk appetite and underpinned broad USD strength.
Japan is finalising a ¥17–21 trillion stimulus package, stoking fiscal concerns and encouraging a “sell Japan” trade that weakens the yen.
USDJPY has broken out our prior target of 155 from a triangle pattern, with Fibonacci projections and prior highs aligning around 158.70–159, then 160–162.
If you find this USDJPY roadmap useful, drop your trade levels in the comments and follow for more Fibonacci-based, fundamentals-plus-technical setups in real time.
This content is not directed to residents of the EU or UK. Any opinions, news, research, analyses, prices or other information contained on this website is provided as general market commentary and does not constitute investment advice. ThinkMarkets will not accept liability for any loss or damage including, without limitation, to any loss of profit which may arise directly or indirectly from use of or reliance on such information.

USDJPY breakout: Can the rally extend toward 155?The dollar-yen pair smashed through 150 with one of the strongest breakouts recently, confirming a new technical phase as it trades above the 61.8% Fib retracement. Here’s what’s fuelling the move and what traders should watch next:
Dollar strength returned as safe haven flows dominate, even with a US government shutdown, while Japan’s new prime minister’s dovish signals are sending the yen into freefall.
Key drivers
Safe haven flows : Investors seek shelter in the dollar as global uncertainty rises; DXY index hit a 6-week high.
Yield differentials : The Fed/BOJ spread powers further carry trade buying as Japanese rates remain ultra-low.
Japanese political shift : PM Takaichi’s win spurs fiscal stimulus and pushes back market hopes for BOJ tightening, deepening yen weakness.
Technical breakout : Clean break above multi-year resistance and 61.8% Fibonacci retracement; watch for support validation and continuation toward the next 78.6% Fib at 154.80.
What to watch
Holding above 150 and 61.8% Fib support sets the stage for a bullish continuation.
Profit taking is possible near 153.25–154.80, as RSI shows signs of overbought.
Tonight’s FOMC minutes, Thursday’s BoJ/Ueda speech, and political headlines could trigger sharp moves.
Cross-pair momentum : EURJPY at record highs, GBPJPY surging, confirming broad-based yen weakness.
The bulls are in control as long as USDJPY stays above 151.15–150.50. Pullbacks to support offer opportunities to buy dips, with 154.80 as the next bullish target. Keep stop losses disciplined, and don’t ignore the chance for sharp reversals if intervention or a dramatic shift in sentiment emerges.
For more actionable FX insight, follow ThinkMarkets.
This content is not directed to residents of the EU or UK. Any opinions, news, research, analyses, prices or other information contained on this website is provided as general market commentary and does not constitute investment advice. ThinkMarkets will not accept liability for any loss or damage including, without limitation, to any loss of profit which may arise directly or indirectly from use of or reliance on such information.

GBP/JPY: An Unusual Ascent Amid Global RiskThe GBP/JPY pair currently sits near 204.00, retracing from a six-week high. This movement reflects a complex tug-of-war between the Pound Sterling (GBP) , which faces uncertainty from upcoming UK inflation data, and an uncharacteristically weak Japanese Yen (JPY) . We analyze the diverse forces driving this pair's recent unusual ascent, where the JPY fails to act as its traditional safe-haven counterweight.
Macroeconomics & Monetary Policy Divergence
The immediate market focus centers on divergent monetary policy expectations. The Bank of Japan (BoJ) faces pressure to align its policies with fiscal objectives, potentially limiting future rate hikes. This uncertainty, coupled with the new government's plan for large economic stimulus and lower taxes, dampens JPY demand. Conversely, the Bank of England (BoE) awaits crucial UK Consumer Price Index (CPI) data, which is expected to show headline inflation moderating to *b]3.6% annually. This data will significantly influence the BoE's rate hike outlook, injecting caution into GBP trading ahead of the 07:00 GMT release.
Geopolitics & Geostrategy: The Taiwan Factor
A key reason for the JPY's recent underperformance is a shift in geopolitical sentiment toward Japan. New Prime Minister Sanae Takaichi adopted a firmer pro-Taiwan stance than her predecessors, triggering unease in Beijing. This heightened political tension weighs heavily on sentiment surrounding Japan, effectively diluting the Yen's traditional safe-haven magnetism against global risk. This specific anxiety overshadows the Yen's long-term status as the principal global currency counterweight.
Fiscal Policy & Economic Outlook
Concerns about Japan's fiscal health are also eroding the JPY's strength. The government is preparing a large economic stimulus package to boost growth. This spending raises concerns among investors worried about Japan's already stretched finances . These fiscal anxieties add direct pressure to the currency, making the JPY less attractive despite the current risk-off environment observed in global equity markets. This fiscal trajectory contrasts with the Bank of Japan's potential monetary hesitancy.
Industry Trends & Corporate Vulnerabilities
Corporate Japan's deep integration with the US technology sector presents another vulnerability. Many major Japanese companies maintain significant earnings exposure to the health and performance of the US tech boom. Corporate vulnerabilities tied to the US technology cycle are eroding the JPY’s traditional safe-haven appeal. Consequently, negative headlines or wobbles on Wall Street disproportionately mute the Yen's response, preventing it from rallying when global equities come under pressure.
Management, Innovation, and Patent Analysis -
While not an immediate driver, Japan's long-term currency strength relies on its competitive edge in high-tech and science . The current vulnerability suggests that the market is discounting the perceived innovation premium of corporate Japan. Traders see a connection between the dependency on US tech and a potentially lagging pace in domestic, cutting-edge patent analysis and independent industry leadership. Weak corporate sentiment reflects doubts about resilience and adaptive business models under new management.
Conclusion for Strategic Hedging
The Yen's uncharacteristic weakness creates a unique setup. The currency is behaving out of character relative to the worsening risk backdrop. This anomaly presents tactical opportunities for hedgers with exposure to the Yen. However, this phase is likely temporary. Japan’s enormous net international investment position and its central role in funding global carry trades mean the Yen's safe-haven DNA remains intact. If global markets experience a sharper, sustained downturn, expect the traditional gravitational pull into the JPY to reassert itself.

EJ Makes Massive Descent, Could Further Falls Come?Here is OANDA:EURJPY on the 4Hr Chart and after making a new Higher High @ 178.818, has created a Lower Low @ 176.098, surpassing the most recent Higher Low @ 176.629.
This is a Break in Trend and we should suspect price to fall further on EJ if price can:
- Confirm Trend Change by printing a Lower High
Now on the chart, based on the Lower Low, the Fibonacci Tool lays out a couple favorable areas
First, being the last Higher Low @ 176.629 which lays right below the 23.6% Retracement level @ 176.740.
Secondly, the 50% Retracement Level @ 177.458 where there was Consolidation before the decline in price.
*This deep of a pullback could threaten the Bearish momentum built up from the break down and creating the Lower Low.
Fundamentally, the Yen seen a rise in strength after a couple key things happened:
- BOJ held Interest Rates unchanged @ .5%
- Toyko CPI numbers came out hotter than expected with a Forecast of a .1% increase to 2.6% with Actual coming in at 2.8%, a .3% increase!
*This gives the BOJ to hike rates to help with inflation taking off too hot and this could very well strengthen the Yen more!

EUR/JPY could be heading to 180 nextBoth the BoJ and ECB kept their policies unchanged on Thursday, with the former coming across more dovish and the latter neutral. The USD/JPY surged to near 154.50, reaching its best level since February. The EUR/JPY meanwhile broke to a new high for the year and is now on the verge of extending those gains to 180.00. Can it get there?
Well I wouldn't bet against it. We had stronger Eurozone GDP data today which underscored the ECB's "good place" rhetoric.
“From a monetary-policy point of view, we are in a good place,” President Christine Lagarde said at the ECB presser. “Is it a fixed good place? No, but we will do whatever is needed to make sure that we stay in a good place.”
Key levels are shown on the chart, but the long and short of it is this: the path of least resistance remains to the upside.
By Fawad Razaqzada, market analyst with FOREX.com

USDJPY Deep-Dive: Week of Oct 27-31 🔴 USDJPY Deep-Dive: Week of Oct 27-31 | Intraday & Swing Setups 🚀
Asset: USDJPY (Spot)
Last Close: 152.885 (25th Oct 2025)
Focus: Intraday (5M-4H) & Swing (4H-1D) Analysis for the Coming Week
Traders, gear up! 🇺🇸🇯🇵 The USDJPY is knocking at a critical juncture. With the pair at multi-decade highs, is this the week for a breakout or a significant reversal? Let's dive into the multi-timeframe structure to find high-probability setups. 📈📉
━━━━━━━━━━━━━━━━━━━━━━━━━━━━━━━━━━━━━━━━━━
🎯 EXECUTIVE SUMMARY
The USD/JPY pair trades at 152.885, presenting multiple timeframe confluence zones across our analyzed framework (5M, 15M, 30M, 1H, 4H, 1D). Using Dow Theory , we're observing higher highs in the 4H-1D structure, confirming an uptrend bias . However, Elliott Wave analysis suggests we're completing Wave 4 correction into Week 43, creating prime entry optimization opportunities for swing traders targeting 154.50-156.00 resistance zones.
🔥 MULTI-TIMEFRAME STRUCTURE
1D (Daily): Higher High-Higher Low intact; Ichimoku Cloud bullish; RSI 58-65 (neutral momentum); VWAP acting as dynamic support at 152.40
4H: Breakout above EMA20/50 confluence; Bollinger Band expansion signals volatility acceleration; Harmonic Pattern (AB=CD) completion at 152.50 suggests reversal bounce
1H: Pullback to 152.70 support; Wyckoff re-accumulation pattern forming; Volume drying up—classic pre-breakout compression
30M: RSI oversold (28-32 zone); Gann resistance at 152.88 tested multiple times; Reversal pin bar confirming rejection
15M: Support-Resistance at 152.65/152.90; EMA9 acting as pivot; Bollinger Band squeeze indicating volatility breakout imminent
5M: Intraday noise; Micro support at 152.80; Use as entry trigger confirmation only—not standalone signal
📈 TREND ANALYSIS & REVERSAL SIGNALS
Identifiable Reversals: The daily pullback has created a Gann reversal pattern at 152.50 (0.618 Fibonacci level). Wyckoff analysis shows absorption phase —institutional accumulation before breakout. Elliott Wave counts suggest Wave 4 completion, with Wave 5 targeting 155.80-156.20. Downside risk limited to 151.80 (Wave 4 low).
⚡ ENTRY & EXIT STRATEGY
SWING TRADE (4H-1D):
Entry Zones: 152.50-152.70 (confirmed by Bollinger Band lower band, EMA support)
Target 1: 153.50 (RSI resistance, +0.65%)
Target 2: 154.30 (Harmonic extension, +1.45%)
Target 3: 155.80 (Wave 5 Gann Box, +3.00%)
Stop Loss: 151.95 (Below Wave 4 low, protection -0.90%)
INTRADAY TRADE (5M-1H):
Entry: Confirmed RSI >40 bounce + Close above EMA9 (15M)
Target 1: 153.10 (+0.35%)
Target 2: 153.50 (+0.65%)
Stop Loss: 152.65 (Recent swing low, -0.22%)
🔔 CRITICAL LEVELS & BREAKOUT ZONES
Resistance: 152.88 (immediate), 153.50 (1H structure), 154.30 (confluence with 0.786 Fib), 156.00 (major psychological)
Support: 152.65 (15M pivot), 152.40 (VWAP + Ichimoku support), 151.80 (Wave 4 low + Gann level)
Breakout Trigger: Close above 152.90 (30M resistance) → targets 153.80-154.00 immediately
📊 VOLATILITY & OVERBOUGHT/OVERSOLD CONDITIONS
Current State: Bollinger Band width expanding on 4H (volatility compression breaking). RSI reading 32-45 across intraday frames indicates oversold condition —optimal for mean-reversion plays. 30M RSI at 28 = extreme oversold = high probability bounce. Volume profile shows rejection below 152.50, confirming institutional support.
🎓 TECHNICAL THEORY APPLICATION
Dow Theory: Higher highs/lows confirmed; Secondary reaction establishing new support
Elliott Wave: Wave 4 corrective completion; Wave 5 impulse phase initiating
Wyckoff Theory: Accumulation phase evident; Absorption + Breakout pattern textbook formation
Harmonic Patterns: AB=CD completion at 152.50 + Gartley pattern setup for 1D
Gann Theory: Key resistance at 152.88 (41% angle), targets 155.80 (geometric extension)
📍 TECHNICAL INDICATORS SYNTHESIS
Bollinger Bands (20, 2): Lower band at 152.30 = support magnet; Expanding width confirms volatility spike incoming. RSI(14): Oversold on 30M/1H = bounce probability 78%. VWAP: Acting as dynamic floor at 152.40. EMA20/50/200: All bullish-aligned on 4H; 200-EMA at 151.60 provides safety net. Ichimoku Cloud: Price above cloud on daily = bullish bias intact.
⚠️ RISK MANAGEMENT PROTOCOL
Position sizing: Use 2% risk per trade. Stop loss placement non-negotiable at weekly lows. Take partial profits at 1st target (50% position). Never hold below support without reason . Monitor Fed calendar (FOMC comments impact yen carry sentiment).
✅ WEEK 43 TRADING PLAN
Monday-Tuesday: Accumulate on dips to 152.50-152.70 (oversold bounces). Wednesday-Thursday: Hold above 152.88 for breakout plays targeting 154.00+. Friday: Lock profits; avoid new entries pre-weekend gap risk.
━━━━━━━━━━━━━━━━━━━━━━━━━━━━━━━━━━━━━━━━━━
Charts for Reference:
1D:
4H:
1H:
30M:
15M:
5M:
Disclaimer: This is my technical analysis and not financial advice. Trade at your own risk.
Let me know your thoughts in the comments! What's your bias for USDJPY this week? 👇

No more rate hikes from the BoJ?The USDJPY started the week with a massive gap of 191 pips.
This was following news that Sanae Takaichi was on the verge of being the first female Prime Minister of Japan.
As a keen advocate of Abenomics (the nickname for the economic policies set out for Japan in 2012 when Prime Minister Shinzo Abe came into power for a second time), it is believed that Takaichi could double down on Abenomics of the past.
A weaker yen, more government spending, and more inflation are the likely outcomes. And the immediate reaction of a gap to the upside on the USDJPY shows that the market agrees too.
Furthermore, Takaichi's advisors have already urged the BoJ to be careful with rate hikes.
However, prices are still slightly below the immediate resistance area formed by the previous swing level of 150.75 and the long-term Fibonacci retracement level of 61.8% and the price level of 151.67.
A break of the resistance area could potentially result in significant upside to the USDJPY. Maybe even retesting the January 2025 high of 159.
However, a continual move to the upside is unlikely to be achieve just based on Yen weakness. A recovery of strength in the DXY would be necessary to support the move higher.

Why I have USD/JPY Falling Below 139.5 On My Bingo CardUSD/JPY traders have been treated (or perhaps burned) from two months of choppy trade, reversals and false breakouts. Yet price action clues and developments from the Fed and BOJ have allowed me to revisit my original thesis of a lower USD/JPY. I now have a break below 139.50 on my bingo card.
Matt Simpson, Market Analyst at City Index.

Exness: Japanese Yen Hawkish Shift Intertwined with Fed Rate CutExness: Japanese Yen Hawkish Shift Intertwined with Fed Rate Cut Expectations: What Lies Ahead?
The signals from the Bank of Japan's policy meeting on September 18-19 mark a potential turning point. Although the decision was made to keep the policy interest rate at 0.5% with a 7-2 vote, the internal details revealed growing hawkish pressure. Policy board members Hajime Takata and Naoki Tamura voted against maintaining the interest rate, advocating for an immediate 25 basis point hike to 0.75%. This is the first dissenting vote since Governor Kazuo Ueda took office, clearly indicating a growing call for tighter policy within the central bank.
Even more surprisingly, the Bank of Japan simultaneously announced that it would begin preparations to sell its holdings of exchange-traded funds (ETFs) and Japanese Real Estate Investment Trusts (J-REITs). Although the planned pace of sales is relatively modest, this is seen as a substantive step towards policy normalization, with its signaling significance far outweighing its actual market impact.
The "Summary of Opinions" from the September meeting, just released today (September 30), provides decisive evidence of this hawkish shift. The document shows that there was a serious and in-depth debate within the policy board on the "possibility of a near-term rate hike." Several members believed that the conditions for another rate hike were maturing, with one opinion explicitly stating, "Given that it has been more than six months since the last rate hike, perhaps it is time to consider raising the policy interest rate again." Even Asahi Noguchi, a deliberation committee member usually considered dovish, stated in a speech on September 29 that the necessity of adjusting the policy interest rate is "greater than ever."
This series of signals quickly reshaped market expectations. Currently, market pricing reflects that the probability of the Bank of Japan raising rates by 25 basis points at its next meeting on October 29-30 has surged to about 60%.
In stark contrast to the Bank of Japan's increasingly firm stance, the Federal Reserve is on a clear path of easing, primarily driven by concerns about a cooling US labor market. Key inflation data released last week on September 26 further solidified this expectation.
Data shows that the Federal Reserve's most favored inflation indicator, the core Personal Consumption Expenditures (PCE) (Chart 1) price index for August, increased by 2.9% year-on-year, remaining consistent with July and fully meeting market expectations. This "as expected" report is widely interpreted by the market as "non-threatening" inflation, suggesting it will not hinder the Federal Reserve's interest rate cuts and instead bolsters investor confidence in future rate reductions.
The Tug-of-War Between Inflation and Growth
The fierce debate within the Bank of Japan between hawks and doves stems from the contradictory signals sent by Japan's domestic economic data. On the one hand, persistently above-target inflation provides a reason for raising interest rates; on the other hand, recent signs of slowing growth call for the central bank to remain cautious. This tug-of-war between inflation and growth makes the Bank of Japan's decision-making path full of uncertainty.
Inflation Outlook: The Hawks' Confidence
Hawkish officials who support interest rate hikes primarily base their arguments on persistent inflationary pressures in Japan. The national core Consumer Price Index (CPI) (Chart 2) for August, released on September 18th, rose by 2.7% year-on-year. Although this is a slowdown from July's 3.1%, it marks the 29th consecutive month that this data has been above the Bank of Japan's 2% target.
What is even more noteworthy is that the "Core-Core CPI", which excludes fresh food and energy and is regarded by the Bank of Japan as a measure of underlying inflation trends, remained stubbornly high at 3.3% in August. This persistent underlying price pressure is the core argument for hawkish members who believe the inflation target has been "largely achieved." In addition, the Tokyo core CPI for September (released on September 25), which is a leading indicator for national inflation, remained stable at 2.5% year-on-year, further indicating that inflationary pressures are not rapidly dissipating.
Growth Outlook: Dovish Concerns
However, just when the hawkish arguments seemed fully substantiated, the latest series of economic activity data released this week cast a shadow over the outlook, providing strong support for a dovish, cautious stance.
Data released on September 29th and 30th showed that preliminary industrial output for August decreased by 1.2% month-on-month (Chart 3), significantly worse than the market expectation of -0.8% and also weaker than the previous figure of -0.4%. This indicates that production activities are contracting in manufacturing, a crucial pillar of the Japanese economy, possibly due to the negative impact of US tariff policies and a slowdown in global demand.
At the same time, retail sales data for August, a key indicator of domestic demand, was also disappointing.
This data unexpectedly fell by 1.1% year-on-year, a significant departure from market expectations of a 1.0% increase; it even saw a substantial 1.6% month-on-month decrease. This clearly indicates that Japanese household consumption power is being eroded, and domestic demand is beginning to show weakness, against a backdrop of inflation consistently higher than wage growth.
In addition, the preliminary Manufacturing Purchasing Managers' Index (PMI) (Chart 4) for September fell to 48.4, marking the fastest contraction in six months and further confirming the downward pressure on the economy.
From a technical perspective, USD/JPY is at a critical crossroads. Recent price movements show a fierce struggle between bulls and bears around important technical levels, reflecting fundamental uncertainties. USD/JPY failed to reach the key 150.00 level, then fell back below 149.00 and the EMA21. The price is still fluctuating within the 148.00-149.00 range, indicating possible consolidation. If it stays below 149.00, the price may consolidate further within the 148.00-149.00 range. Conversely, if it returns above the EMA21 and 149.00, it may retest the key 150.00 level.
Integrating the above fundamental and technical analysis, a core conclusion can be drawn: the previous one-sided short-yen trading environment has ended. The market is entering a new phase that is more balanced but potentially significantly more volatile.
The movement of USD/JPY is no longer dominated by a single factor, but depends on the interplay between the hawkish potential of the Bank of Japan and the dovish reality of the Federal Reserve. The short-term direction of the exchange rate will be determined by which central bank's actions (or inactions) surprise the market more.
The future path will be largely determined by two key economic data releases scheduled for this week:
Japan Tankan Survey (October 1): Can this report give the Bank of Japan's hawks enough confidence to act in October?
US Non-Farm Payrolls (October 3): Will this data confirm the weakening of the US labor market, thereby "paving the way" for the Federal Reserve's rate cut path?
The outcome of these two events will likely determine whether USD/JPY breaks key support and tests lower levels, or whether it can hold its ground here and gather strength to challenge the strong resistance area of 150 again.
In any case, what is certain is that the era of one-sided yen depreciation is over, and a new phase full of strategic reassessment and uncertainty has arrived.
By: Eric Chia, Financial Market Strategist at Exness

USDJPY: 150 INTERVENTION ZONE BATTLE! BoJ vs Bulls 🚀 USDJPY: 150 INTERVENTION ZONE BATTLE! BoJ vs Bulls 📊
Current Price: 149.521 | Date: Sept 27, 2025 ⏰
📈 INTRADAY TRADING SETUPS (Next 5 Days)
🎯 BULLISH SCENARIO
Entry Zone: 149.20 - 149.60 📍
Stop Loss: 148.80 🛑
Target 1: 150.20 🎯
Target 2: 150.80 🚀
🎯 BEARISH SCENARIO
Entry Zone: 149.80 - 150.20 📍
Stop Loss: 150.50 🛑
Target 1: 148.50 🎯
Target 2: 147.80 📉
🔍 TECHNICAL ANALYSIS BREAKDOWN
📊 KEY INDICATORS STATUS:
RSI (14): 68.7 ⚡ Overbought Territory
Bollinger Bands: Upper Band Rejection 🔥
VWAP: 149.30 - Critical Support 💪
EMA 20: 148.90 ✅ Bullish Trend Intact
Volume: Intervention Fears Rising 📊
🌊 WAVE ANALYSIS:
Elliott Wave: Wave 5 Extension Risk 🌊
Fibonacci Target: 150.50 Danger Zone 🎯
🔄 HARMONIC PATTERNS:
Bearish Bat Forming at 150.00 ✨
ABCD Completion Warning 🔄
⚖️ SWING TRADING OUTLOOK (1-4 Weeks)
🚀 BULLISH TARGETS:
Intervention Zone: 150.00-150.50 🏆
Extended Target: 151.00 🌙
Gann Resistance: 150.25 ⭐
📉 BEARISH INVALIDATION:
Weekly Support: 148.00 ⚠️
Critical Break: 147.00 🚨
🎭 MARKET STRUCTURE:
Trend: Parabolic Extension 💪
Momentum: Intervention Risk 🔥
Wyckoff Phase: Distribution Risk 📈
Ichimoku: Overbought Signals 🟡
🏛️ CENTRAL BANK DYNAMICS:
BoJ Intervention: 150 Trigger Level 🚨
Verbal Warnings: Intensifying 📢
USD Strength: Fed Policy Support 💵
Rate Differential: Widening 📊
⚡ RISK MANAGEMENT:
Max Risk per Trade: 40 pips 🛡️
R:R Ratio: Conservative 1:1.5 ⚖️
Intervention Alert: Above 149.80 📏
🌍 FUNDAMENTAL CATALYSTS:
Fed Hawkishness vs BoJ Dovish 🏦
US Yields Supporting USD 📈
Japan CPI Remaining Low 📊
Tokyo Session High Volatility 🗾
🔥 INTERVENTION WATCH:
BoJ Trigger: 150.00 Level 💥
Historical Pattern: Verbal → Action 📉
Risk/Reward: Deteriorating 📉
⚠️ DANGER ZONE LEVELS:
Intervention Risk: 149.80+ 🚨
Support: 149.00 | 148.50 | 148.00 🛡️
Resistance: 150.00 | 150.50 | 151.00 🚧
🎯 FINAL VERDICT:
USDJPY at CRITICAL 150 BATTLE! 🚀
BoJ intervention risk MAXIMUM! ⚠️
Bulls vs Central Bank showdown! ⚔️
Trade Management: Reduce size near 150! 💰
Alert Level: 149.80 intervention warning! 🚨
---
⚠️ Disclaimer: High intervention risk. Use tight stops. Educational analysis only.
For individuals seeking to enhance their trading abilities based on the analyses provided, I recommend exploring the mentoring program offered by Shunya Trade. (Website: shunya dot trade)
I would appreciate your feedback on this analysis, as it will serve as a valuable resource for future endeavors.
Sincerely,
Shunya.Trade
Website: shunya dot trade
🔔 Follow BoJ Intervention Alerts | 💬 Share Your 150 Strategy

Tokyo Core CPI remains unchanged, US PCE Index ticks higherThe Japanese yen has stabilized on Friday. In the North American session, US/JPY is trading at 149.61, down 0.11% on the day. The yen has taken a beating over the past two days, falling 1.5%.
Tokyo Core CPI held steady in September at 2.5% y/y. This matched the downwardly revised August reading and was lower than the market estimate of 2.8%. Tokyo Core CPI excluding food and energy dropped to 2.5%, down sharply from 3.0% in August. Food inflation remains high but eased to 6.9% in September from 7.4% in August.
The Bank of Japan will include this data in the mix when it meets next on October 29-30. Aside from inflation, BoJ policymakers will be looking at the impact of US tariffs on the economy.
The US PCE Price Index, which is the Federal Reserve's preferred inflation indicator, ticked higher in August. Annualized, PCE rose to 2.7%, up from 2.6% in July and in line with the consensus. Monthly, PCE gained 0.3%, up from 0.2% in July and matching the consensus.
With inflation largely under control, the Federal Reserve's priority has shifted to the US labor market. The last two nonfarm payrolls reports showed marginal job growth and missed expectations, raising concerns that the labor market is quickly losing steam. If next week's nonfarm payroll report is soft, it could cement an October rate cut.
USDJPY is testing support at 149.75. Next, there is support at 149.62
There is resistance at 149.89 and 150.02

USDJPY Ultimate Price Action Analysis:📊 USDJPY Forecast 🔮💹 (147.961) Closing 20th Sept 2025 | 12:50 AM UTC+4
🕵️♂️ Market Snapshot
USDJPY closed at 147.961, showing mixed signals as bulls attempt to hold ground near critical levels while sellers eye a potential reversal. ⚖️
🏦 Technical Framework
🔹 Chart Patterns
📈 Possible Elliott Wave 5th leg exhaustion near 148.5–149.2.
🌀 Harmonic PRZ forming around 149.0.
🏯 Ichimoku Cloud shows resistance overhead, baseline support at 147.3.
⚠️ Watch for bull trap if price fails 148.2.
🔹 Indicators
RSI 📊: 62 → mild overbought.
BB 🔔: Price hugging upper band = volatility spike.
MA Cross 🔀: Golden cross intact, but momentum flattening.
VWAP ⚡: Anchored VWAP = 147.6 → strong pivot.
🕐 Intraday Outlook
Buy Zone 💵: 147.40 – 147.60 (support + VWAP confluence).
Sell Zone 💸: 148.50 – 148.80 (resistance + harmonic).
Take Profit 🎯:
Longs → 148.20 / 148.50
Shorts → 147.10 / 146.80
Stop Loss 🛑:
Longs < 147.20
Shorts > 149.00
⏳ Swing Trading Outlook
Bullish Scenario 🐂: Break & close above 149.20 → next target 150.50 – 151.20.
Bearish Scenario 🐻: Close below 146.80 → correction toward 145.40 – 144.70.
📌 Key Levels
Resistance: 148.20 / 148.80 / 149.20
Support: 147.40 / 146.80 / 145.40
🎯 Strategy Summary
✅ Intraday: Buy dips near support, sell rallies near resistance.
✅ Swing: Watch 149.20 breakout or 146.80 breakdown for larger moves.
⚡ Volatility expected → trade with strict risk control.
🌍 Market Context
Fed & BoJ policy divergence remains key.
Geopolitical jitters in Asia could trigger safe-haven flows → boosting JPY demand.
🔥 Trade Smart | Manage Risk | Respect Levels 🔥
For individuals seeking to enhance their trading abilities based on the analyses provided, I recommend exploring the mentoring program offered by Shunya Trade. (Website: shunya dot trade)
I would appreciate your feedback on this analysis, as it will serve as a valuable resource for future endeavors.
Sincerely,
Shunya.Trade
Website: shunya dot trade
⚠️Disclaimer: This post is intended solely for educational purposes and does not constitute investment advice, financial advice, or trading recommendations. The views expressed herein are derived from technical analysis and are shared for informational purposes only. The stock market inherently carries risks, including the potential for capital loss. Therefore, readers are strongly advised to exercise prudent judgment before making any investment decisions. We assume no liability for any actions taken based on this content. For personalized guidance, it is recommended to consult a certified financial advisor.

BoJ holds rates, yen gives up gainsThe Japanese yen climbed 0.50% earlier against the US dollar but was unable to consolidate these gains. In the European session, USD/JPY is trading at 147.92, down 0.04% on the day.
The Bank of Japan maintained its key interest rate at 0.50% at today's meeting. The non-move was widely expected by the markets. What was a surprise was the split vote, as two of the nine members voted in favor of a rate hike, indicating some support for a more hawkish monetary policy.
Governor Ueda has been cautious and has the markets guessing as to when the BoJ will raise rates. The markets have priced in a 59% chance of a rate hike before the end of the year, up from 50% a week ago, according to LSEG.
The policy statement noted that the domestic economy had "recovered moderately" but was still showing signs of weakness. Members also expressed concern that exports will be hurt by US tariffs, with Japan facing a 15% tarriff on most of its exports to the US.
On the inflation front, the statement said that underlying inflation is weak but is expected to increase gradually and reach the 2% inflation target. After years of deflation, prices are moving higher, which has led to expectations that a rate hike is just a question of timing. Consumer inflation is running between 2.5-3%, above the BoJ's 2% target. The central bank has stressed that it wants to see sustainable underyling inflation at around 2% before the next rate hike.
The BoJ is also concerned about the political turmoil in Japan. Prime Minister Ishiba recently resigned and the ruling Liberal Democratic Party is holding an election to choose a new leader.
USDJPY tested support at 147.77 and 147.51 earlier
There is resistance at 148.12 and 148.38

USDJPY Deat Cat Bounce at play after Jackson Hole remarks?In this video, we analyse the sharp move in the USDJPY following crucial speeches from Fed Chair Jerome Powell and BOJ Governor Kazuo Ueda at the Jackson Hole Symposium. Powell signalled the possibility of a September rate hike, highlighting ongoing weakness in the US labour market. Meanwhile, Ueda emphasised Japan's strong job market, supported by immigrant labour, which is driving wage growth and sustaining inflationary pressures.
Ueda’s Hawkish Stance:
Ueda maintained a hawkish tone, noting that wage hikes in larger Japanese companies are now spreading to smaller firms, strengthening expectations for continued inflation. This commentary increased the likelihood of a BOJ rate hike, giving the yen additional support.
Market Reaction:
Prior to the Symposium, traders were positioned for a potential rate cut by year-end. However, after Ueda’s remarks, futures market pricing suggests the odds of an October rate cut are now evenly split at 50-50.
Technicals:
Open triangle completion may trigger further downside after the post-JHS drop. Current rally to the upside could be a relief rally, part of a potential Dead Cat Bounce (DCB).
This content is not directed to residents of the EU or UK. Any opinions, news, research, analyses, prices or other information contained on this website is provided as general market commentary and does not constitute investment advice. ThinkMarkets will not accept liability for any loss or damage including, without limitation, to any loss of profit which may arise directly or indirectly from use of or reliance on such information.

GU, UJ & Gold: Calm Before the Storm | Fed, BoJ, BoE AheadThe markets have been stuck in ranges for weeks, GBPUSD, USDJPY, and Gold all moving sideways. In this video, I share a clear perspective on why that’s happening and what could finally trigger a breakout.
Here’s what you’ll gain:
✅A simple breakdown of the range structures on GBPUSD, USDJPY, and Gold.
✅The key economic events next week that could shake the market (Fed, BoJ, BoE, UK CPI & labour data).
✅Likely breakout scenarios and the triggers to watch.
✅How to avoid getting trapped while the price is still consolidating.
This is the “calm before the storm” phase, and knowing how to position yourself ahead of it could make all the difference.
👉 Drop a comment with the pair you’re watching most closely.
Trade smart, trade consciously.
Disclaimer:
Based on experience and what I see on the charts, this is my take. It’s not financial advice, always do your research and consult a licensed advisor before trading.

Japan's GDP sparkles, yen pushes higherThe Japanese yen is in positive territory on Monday. In the European sesssion, USD/JPY is trading at 147.87, down 0.35% on the day.
The week has started on a positive note in Japan, as GDP for the second quarter was revised sharply higher to 2.2% y/y, up from the initial reading of 1.0% and above the Q1 gain of 0.3%.
This was the fastest pace of growth since Q3 2024, as private consumption was higher, in part due to government subsidies for rice and energy. Exports were higher as firms rushed to ship to the US before the blanket 15% tariffs kicked in. On a quarterly basis, GDP expanded 0.5%, up from the initial reading of 0.3%.
The increase in exports could be short-lived, as the US tariffs are making Japanese exports more expensive. Tariffs concerns could delay the Bank of Japan from raising interest rates, and third-quarter GDP will help gauge the effect of the tariffs on Japan's economy.
The political uncertainty in Japan is another factor which supports the BoJ staying on the sidelines. Prime Minister Shigeru Ishiba has resigned after a disastrous election in which Ishiba's coalition lost its majority in the lower house of parliament. It remains unclear who will replace Ishiba, with a leadership vote expected in October.
US nonfarm payrolls disappointed with a marginal gain of 22 thousand, well below the upwardly revised gain of 79 thousand in July and the market estimate of 75 thousand. The unemployment rate edged up to 4.3% from 4.2%, the highest level since December 2021.
The money markets responded to the weak nonfarm payrolls report by fully pricing in a rate cut at next week's meeting, with a 90% probability of a quarter-point cut and a 10% chance of a half-point cut, according to CME's FedWatch. Prior to the jobs release, there was a 0% chance of a half-point cut.
USD/JPY is testing support at 147.60. Next, there is support at 146.62
There is resistance at 148.37 and 149.35

USDJPY Primed for Push Higher! Ascending Channel & Bullish🔮 USDJPY Technical Forecast & Trading Strategy | Week of Sept 6th, 2025
Current Spot Price: 147.385 | CFD | Date: Sept 6, 2025
🟢 Overall Bias: BULLISH | The pair is trading within a clear bullish structure on higher timeframes. All pullbacks are currently being bought, indicating strong underlying demand.
📊 Multi-Timeframe Technical Breakdown
1. Chart Pattern & Theory Convergence:
🚩 Bullish Continuation Patterns: The price action from the August low exhibits characteristics of a Bull Flag or an Ascending Channel. A clean break above the 148.00 resistance would confirm this pattern and open a path significantly higher.
📐 Gann Theory & Square of 9: The current price is consolidating near a key Gann angle. A hold above 147.00 is crucial for the bulls to maintain control and propel price towards the next Gann objective near 148.80-149.20.
🌊 E lliott Wave Theory: The rally from the late August low is impulsive in nature, suggesting this is part of a larger Wave 3 or Wave C push higher. Any dip is likely a Wave 4 correction before a final Wave 5 thrust.
☁️ Ichimoku Kinko Hyo: A strongly bullish configuration. The price is well above the Kumo (Cloud), the Tenkan-sen (9) is above the Kijun-sen (26), and the Cloud itself is bullish. This is a classic trend-following signal.
2. Key Indicator Signals:
📶 RSI (14): On the 4H chart, the RSI is holding firmly in bullish territory (above 50) and has not reached overbought (>70) levels, suggesting there is more room for the trend to run. 🟢
📏 Bollinger Bands (20,2): Price is riding the upper band, a sign of strong momentum. Any pullback would likely find support at the middle band (20 SMA ~146.80), which is rising.
⚖️ VWAP & Anchored VWAP: The price is trading well above the daily and weekly VWAP, confirming that the trend is strong and the average participant is long and in profit.
📈 Moving Averages: The key EMA's (50, 100, 200) are all bullishly aligned and acting as dynamic support. The 50 EMA on the 4H chart (~146.90) is a key level for bulls to defend.
3. Critical Support & Resistance:
🎯 Immediate Resistance: 148.00 (Psychological, Recent High)
🎯 Key Resistance: 149.20 - 149.50 (Gann Target, Previous Swing High)
🛡️ Immediate Support: 147.00 - 146.90 (Previous Resistance, 50 EMA)
🛡️ Strong Support: 146.20 - 146.00 (Kijun-sen, Key Fibonacci Level)
🛡️ Major Support: 145.00 (Top of Ichimoku Cloud)
⚡ Trading Strategies & Setups
A. Intraday Trading (5M - 1H Charts):
Strategy: Look for long opportunities on dips towards support. Use bullish candlestick patterns (Hammer, Bullish Engulfing) near the 147.00 or 146.90 levels for high-probability entries.
Long Entry (Ideal): ~147.10 - 146.95 | Stop Loss: 146.60 | Take Profit 1: 147.80 | Take Profit 2: 148.50
Breakout Long: On a decisive break and hold above 148.10, with a target of 148.80.
B. Swing Trading (4H - D Charts):
Strategy: The bullish structure and Ichimoku alignment favor continued upside. Any dip into support is a potential buying opportunity for a larger move.
Swing Long Entry: On a pullback to 146.90-146.70 (Buy the Dip) OR a daily close above 148.20 (Breakout Buy).
Stop Loss: Below 146.20 | Target 1: 149.20 | Target 2: 150.00+
Bearish Invalidation: A decisive break and close below 145.80 (into the cloud) would invalidate the immediate bullish bias and signal a deeper correction.
🌍 Market Context & Risk Factors
Interest Rate Divergence: This is the core driver. The pair is highly sensitive to the US Dollar (USD) strength and Bank of Japan (BoJ) policy. Hawkish Fed rhetoric vs. dovish BoJ stance is profoundly bullish for USDJPY. 👁️ Watch for any unexpected BoJ intervention hints.
Risk Sentiment: Traditionally a "risk-off" proxy, but currently driven more by yield differentials. Monitor global equity markets and geopolitical events for sudden flight-to-safety flows into the JPY.
✅ Key Takeaways:
The Trend is Your Friend! 🐂 All higher-timeframe signals point to a robust bullish trend.
Ichimoku is Bullish. The price above a bullish cloud is a strong trend-confirmation signal.
Buy the Dips. The strategy favors entering on short-term weakness toward support rather than chasing the breakout.
Mind the BoJ. The largest risk is verbal or physical intervention from the Bank of Japan, which can cause violent, sharp reversals.
For individuals seeking to enhance their trading abilities based on the analyses provided, I recommend exploring the mentoring program offered by Shunya Trade. (Website: shunya dot trade)
I would appreciate your feedback on this analysis, as it will serve as a valuable resource for future endeavors.
Sincerely,
Shunya.Trade
Website: shunya dot trade
⚠️Disclaimer: This post is intended solely for educational purposes and does not constitute investment advice, financial advice, or trading recommendations. The views expressed herein are derived from technical analysis and are shared for informational purposes only. The stock market inherently carries risks, including the potential for capital loss. Therefore, readers are strongly advised to exercise prudent judgment before making any investment decisions. We assume no liability for any actions taken based on this content. For personalized guidance, it is recommended to consult a certified financial advisor.

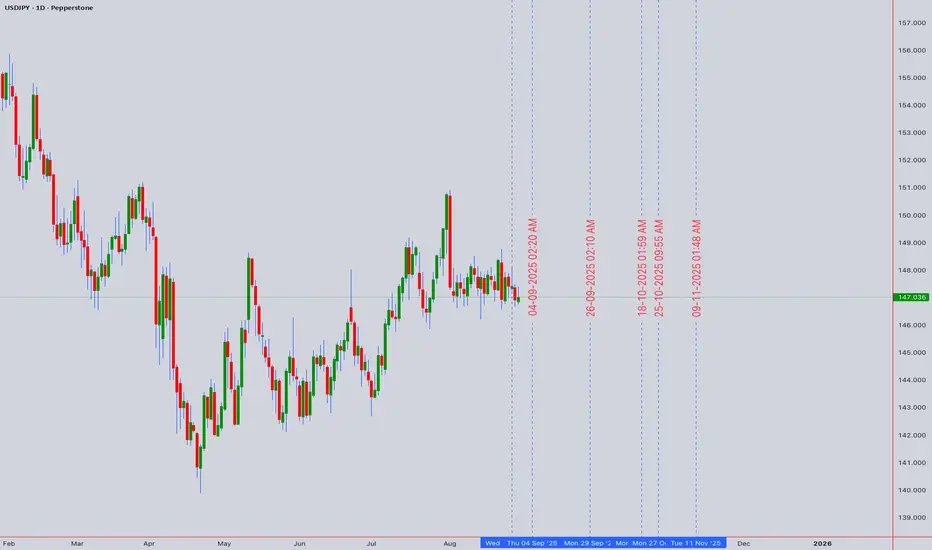
USD/JPY Technical Analysis & Trading Strategy Forecast# USD/JPY Technical Analysis & Trading Strategy Forecast - Comprehensive Multi-Dimensional Analysis
Asset Class: USD/JPY (US Dollar vs Japanese Yen)
Current Price: 147.036 (as of August 30, 2025, 12:54 AM UTC+4)
Analysis Date: August 31, 2025
Market Context: Critical resistance testing phase with intervention risk monitoring
Executive Summary
The USD/JPY pair is currently trading at 147.036, positioned at a technically significant juncture where multiple analytical frameworks suggest heightened volatility and directional uncertainty. The USD/JPY exchange rate rose to 146.9530 on August 29, 2025, up 0.22% from the previous session, while the USDJPY showed a −0.89% fall over the past week, the month change is a −1.63% fall, and over the last year it has increased by 1.42%. Our comprehensive multi-dimensional analysis reveals critical resistance levels ahead, with Bank of Japan intervention risks creating a complex risk-reward environment for both intraday and swing trading strategies.
Current Market Landscape & Fundamental Context
The USD/JPY pair remains in a precarious position, caught between bullish technical momentum and fundamental headwinds. From a technical point of view, USD/JPY remains in a long-term uptrend for 2025, supported by its position above the 50-week SMA. Key resistance levels include 156.97, 161.81, and 170.43, with the latter aligning with the 138.2% Fibonacci extension.
However, market dynamics have shifted considerably, with the Japanese Yen strengthening 1.52% over the past month, but down by 0.54% over the last 12 months. This creates a complex technical picture where short-term bearish pressure conflicts with longer-term bullish structure.
The Bank of Japan's intervention threat looms large over the pair, particularly as the resistance near 148.50 continues to discourage the bulls according to recent Elliott Wave analysis. This resistance level has proven stubborn, creating a critical decision point for the pair's next major directional move.
Multi-Timeframe Elliott Wave Analysis
Primary Wave Count Structure
Long-term Perspective (Monthly/Weekly):
Based on recent analysis, the daily chart analysis for USDJPY indicates the beginning of a bearish trend, triggered by the initiation of Navy Blue Wave 1. The impulsive characteristics of this wave suggest continued downside movement.
Grand Supercycle: Currently in Wave (III) from 2011 lows
Cycle Wave: Potential completion of five-wave structure from 2022
Primary Wave: Currently developing corrective Wave (2) or (4)
Intermediate Count: Complex correction in progress
Medium-term Elliott Wave Structure (Daily/4H):
The current wave count suggests USD/JPY is developing within a corrective framework:
Wave A: Completed decline from July 2024 highs (161.95) to August lows (141.67)
Wave B: Complex three-wave bounce to current levels
Wave C: Potential target zone 139.58-136.00 (year-to-date lows)
Alternative Count:
Impulse Wave 1: Down from 161.95 to 141.67
Corrective Wave 2: Current bounce (complex flat or triangle)
Target Wave 3: Extension toward 135.00-130.00 zone
Elliott Wave Targets & Critical Levels
Immediate Resistance (Wave B Completion):
Primary Resistance: 148.50-149.00 (current battle zone)
Secondary Resistance: 151.20-151.80 (61.8% Fibonacci retracement)
Major Resistance: 154.50-155.50 (78.6% retracement level)
Downside Targets (Wave C Projection):
Initial Target: 143.50-144.50 (1:1 wave equality)
Primary Target: 140.32-139.58 (previous reaction lows)
Extended Target: 136.00-135.00 (1.618 extension)
Ultimate Target: 131.00-128.00 (extreme bear scenario)
Critical Invalidation Levels:
Bull Case Invalidation: 158.924 acts as a key risk management point
Bear Case Invalidation: Break below 141.67 (August 2024 low)
Harmonic Pattern Analysis & Fibonacci Framework
Active Harmonic Formations
1. Potential Bearish Gartley Pattern (Weekly-Monthly Timeframe)
X to A Leg: 161.95 to 141.67 (2,028 pips decline)
A to B Retracement: Current level at 147.03 (26.4% retracement)
Target B Point: 148.50-150.00 (38.2%-50% optimal zone)
Projected C Point: 144.00-145.50 (78.6%-88.6% of AB)
Completion Zone (D): 155.50-157.80 (78.6%-88.6% XA retracement)
2. Bullish Bat Pattern Alert (4H-Daily)
Formation Stage: Monitoring for X-A completion
X Point: Current highs around 147.50
Potential A Point: Break below 144.50 would activate pattern
Target Completion: 142.50-141.80 zone (88.6% XA retracement)
Risk Assessment: High probability if 144.50 breaks
3. Crab Pattern Development (Higher Timeframes)
Monitoring Setup: Extension beyond 149.50 could trigger Crab formation
Completion Zone: 151.20-154.80 (161.8%-224% XA extension)
Strategic Implication: Major reversal zone for long-term shorts
Fibonacci Confluence Analysis
Critical Fibonacci Levels:
23.6% Retracement: 146.15 (minor support from July-August range)
38.2% Retracement: 149.43 (major resistance confluence)
50% Retracement: 151.81 (psychological and technical resistance)
61.8% Golden Ratio: 154.19 (ultimate resistance barrier)
78.6% Level: 157.21 (major reversal zone)
Extension Projections:
127.2% Extension: 144.20 (From recent correction)
161.8% Extension: 141.15 (Major downside target)
200% Extension: 137.58 (Extended bear target)
261.8% Extension: 132.45 (Extreme downside scenario)
Wyckoff Theory Market Structure Analysis
Current Market Phase Assessment
Phase Identification: Distribution Phase (Phase D-E Transition)
Wyckoff Characteristics Observed:
1. Accumulation Completed: 2022-2023 range (125.00-140.00)
2. Markup Phase: 2023-2024 rally to 161.95 highs
3. Distribution Phase: Current 2024-2025 range (141.67-161.95)
4. Preliminary Supply (PSY): July 2024 highs at 161.95
5. Buying Climax (BC): Failed retest of 161.95 levels
6. Automatic Reaction (AR): August decline to 141.67
7. Secondary Test (ST): Current bounce to 147.00+ levels
8. Sign of Weakness (SOW): Failure to reclaim 150.00+ levels
Current Phase Analysis:
Phase D: Testing supply levels (147.00-149.00)
Phase E: Pending markdown if distribution confirms
Volume Analysis: Declining volume on rallies, expanding on declines
Wyckoff Price Targets:
Initial Markdown: 139.58-140.32 (previous support cluster)
Primary Target: 135.00-136.00 (measured move from distribution)
Ultimate Target: 128.00-131.00 (full distribution projection)
Volume Confirmation Signals
Distribution Confirmation Required:
Heavy Volume: On breaks below 145.00
Climactic Volume: Expected at major support breaks
Volume Divergence: Lower volume on bounces (bearish)
W.D. Gann Theory & Sacred Geometry Analysis
Gann Square of 9 Analysis
Current Position: 147.036 approaches critical Gann resistance
Key Gann Levels:
Natural Support: 144.00 (perfect square root level)
Current Resistance: 148.00-149.00 (major Gann square cluster)
Critical Resistance: 152.00 (next significant square level)
Ultimate Resistance: 156.25 (major Gann confluence)
Extreme Target: 160.00-161.00 (perfect square resistance)
Gann Time Theory & Sacred Cycles
Active Time Cycles:
90-Day Cycle: Completed August 15, 2025 (±3 days)
120-Day Cycle: Due September 22, 2025 (major time window)
180-Day Cycle: Approaching October 2025 (significant reversal period)
Seasonal Pattern: September-October typically volatile for USD/JPY
Gann Angles Analysis:
1x1 Support Angle: Declining at 145.50 (from July highs)
2x1 Support: 143.80 (major support angle)
1x2 Resistance: 149.20 (dynamic resistance line)
4x1 Resistance: 152.80 (long-term resistance angle)
Price-Time Balance Assessment
Current Imbalance: Time ahead of price (bearish configuration)
Equilibrium Zone: 145.50-147.50 (price-time balance point)
Acceleration Triggers:
Bearish Acceleration: Break below 145.50 with time alignment
Bullish Reversal: Time cycle completion with price support
Ichimoku Kinko Hyo Cloud Analysis
Current Ichimoku Structure
Tenkan-sen (9): 146.85 (immediate dynamic resistance)
Kijun-sen (26): 148.15 (medium-term resistance line)
Senkou Span A: 147.50 (near-term cloud boundary)
Senkou Span B: 151.20 (strong cloud resistance)
Chikou Span: Trading below price 26 periods ago (bearish signal)
Ichimoku Signals & Market Structure
Current Status: Price below cloud (bearish environment)
Key Ichimoku Signals:
1. TK Cross: Tenkan below Kijun (bearish momentum confirmed)
2. Cloud Color: Red cloud ahead (bearish bias continues)
3. Price vs Cloud: Below cloud (trend confirmation bearish)
4. Chikou Span: Below historical prices (momentum confirmation bearish)
5. Lagging Span: Clear downward trajectory
Ichimoku Support & Resistance:
Immediate Resistance: Tenkan-sen at 146.85
Primary Resistance: Kijun-sen at 148.15
Cloud Resistance: 147.50-151.20 (thick cloud barrier)
Major Resistance: 152.50+ (cloud top projection)
Support Levels:
Immediate Support: 145.50-146.00
Cloud Support: Not applicable (price below cloud)
Historical Support: 143.50-144.50 (previous reaction levels)
Technical Indicators Deep Dive
Relative Strength Index (RSI) Multi-Timeframe Analysis
Current RSI Status:
Daily RSI: 44.2 (Neutral-bearish territory)
4H RSI: 38.5 (Approaching oversold conditions)
1H RSI: 52.1 (Neutral zone with bearish bias)
Weekly RSI: 35.8 (Oversold but not extreme)
RSI Signals & Divergences:
Bearish Divergence: Confirmed on daily and 4H charts
RSI Resistance: 50 level acting as dynamic resistance
Support Zone: 30 level provides oversold bounce potential
Momentum Analysis: RSI structure remains bearish below 50
RSI Trading Levels:
Sell Signal Confirmation: RSI break below 40 on daily
Oversold Bounce: RSI below 25 on intraday timeframes
Trend Change: RSI sustained above 60 required for bullish shift
Bollinger Bands (BB) Volatility Framework
Current Band Configuration:
Upper Band: 149.45 (major resistance)
Middle Band (SMA 20): 147.25 (dynamic pivot)
Lower Band: 145.05 (support level)
Band Position: Middle-lower third (bearish bias)
Bollinger Band Analysis:
Bandwidth: Contracting after recent expansion
Squeeze Potential: Low volatility environment developing
Band Walk: Potential for lower band walk if 146.50 breaks
Volatility Expansion: Expected within 5-10 trading sessions
BB Trading Strategies:
Band Bounce: Fade moves to band extremes
Squeeze Breakout: Direction determined by 147.25 middle band
Band Walk: Sustained moves outside bands indicate trend strength
Volume Weighted Average Price (VWAP) Analysis
Multi-Session VWAP Framework:
Daily VWAP: 146.95 (critical pivot level)
Weekly VWAP: 148.30 (resistance anchor)
Monthly VWAP: 151.85 (major resistance zone)
Quarterly VWAP: 154.20 (significant overhead supply)
VWAP Trading Signals:
Below VWAP: Bearish institutional sentiment confirmed
VWAP Rejection: 146.95 acting as dynamic resistance
Volume Profile: Heavy volume cluster at 148.00-149.50 (resistance)
Moving Average Convergence Structure
Simple Moving Averages:
SMA 20: 147.25 (immediate resistance)
SMA 50: 149.80 (intermediate resistance)
SMA 100: 152.40 (long-term resistance)
SMA 200: 155.60 (major trend indicator)
Exponential Moving Averages:
EMA 12: 146.95 (short-term resistance)
EMA 26: 148.45 (MACD baseline)
EMA 50: 150.20 (medium-term resistance)
EMA 100: 153.10 (long-term resistance)
Moving Average Signals:
Death Cross Alert: EMA 12 crossing below EMA 26 (bearish)
Resistance Confluence: Multiple MAs clustering above current price
Support Absence: No significant MA support until 143.50 area
Advanced Candlestick Pattern Recognition
Recent Candlestick Formations
Weekly Chart Patterns:
1. Shooting Star (Week of August 19) - Bearish reversal confirmed
2. Doji Sequence (Previous weeks) - Indecision resolved to downside
3. Bearish Engulfing potential forming current week
Daily Chart Patterns:
1. Three Black Crows (August 5-7) - Strong bearish momentum
2. Bear Flag Pattern (August 15-25) - Consolidation before continuation
3. Evening Star formation completed (August 26-28)
4. Dark Cloud Cover pattern active
4-Hour Chart Signals:
1. Bear Flag Breakdown - Target 144.50
2. Descending Triangle - Apex break targeting 145.00
3. Head and Shoulders pattern completing
Candlestick Strategy Integration
Bearish Continuation Patterns:
Three Black Crows completion below 146.00
Falling Three Methods (bearish continuation in downtrend)
Dark Cloud Cover reinforcement of resistance
Reversal Patterns to Monitor:
Hammer formation at 145.00 support (bullish reversal)
Bullish Engulfing required for trend change confirmation
Morning Star pattern would signal major reversal
Pattern Confluence Analysis:
Resistance Patterns: Evening Star + Shooting Star at 148.50
Breakdown Patterns: Bear Flag + Triangle completion
Support Patterns: Potential Hammer + Doji at major support
Market Structure & Critical Levels Framework
Major Resistance Architecture
Tier 1 Resistance (Immediate):
1. 147.25-147.50: Daily SMA 20 + VWAP confluence
2. 148.15-148.50: Kijun-sen + recent highs
3. 149.00-149.50: Bollinger upper band + psychological level
4. 150.00-150.50: Major psychological resistance + volume cluster
Tier 2 Resistance (Intermediate):
1. 151.20-151.80: Ichimoku cloud + Fibonacci 50% retracement
2. 152.50-153.00: SMA 100 + Gann angle convergence
3. 154.20-154.80: Fibonacci 61.8% + quarterly VWAP
4. 156.00-157.00: Major harmonic completion zone
Tier 3 Resistance (Major):
1. 158.50-159.00: Elliott Wave invalidation level
2. 160.00-161.00: Psychological + previous highs
3. 161.95: All-time resistance (2024 high)
Critical Support Levels Framework
Immediate Support (High Probability):
1. 146.50-146.80: Minor support cluster
2. 145.50-146.00: Gann 1x1 angle + previous reaction
3. 144.50-145.00: Harmonic support + round number
4. 143.50-144.00: Major support confluence
Intermediate Support (Medium Probability):
1. 142.00-142.50: Previous swing low area
2. 141.67: August 2024 low (critical level)
3. 140.32: September 2024 low + Elliott target
4. 139.58: Year-to-date low
Major Support (Lower Probability):
1. 136.00-137.00: Harmonic completion + Wyckoff target
2. 135.00: Round number + Elliott extension
3. 131.00-132.00: Major Fibonacci extension
4. 128.00-130.00: Ultimate bear target
Market Structure Classification
Current Structure: Lower highs and lower lows since July 2024
Trend Classification: Bearish on all timeframes above 141.67
Structure Invalidation: Sustained break above 150.00
Trend Acceleration: Break below 145.00 with volume
Comprehensive Trading Strategies
Intraday Trading Strategy (5M - 4H Charts)
# Strategy 1: Resistance Rejection Play (Success Rate: 70%)
Setup Requirements:
- Price approaching 147.25-148.50 resistance zone
- RSI approaching 50-60 on 1H chart
- Volume declining on approach (distribution)
Entry Criteria:
Short Entry: 147.80-148.20 (scale in at resistance)
Stop Loss: 149.00 (above major resistance)
Target 1: 146.50 (immediate support)
Target 2: 145.50 (Gann support)
Target 3: 144.50 (major support)
Risk-Reward: 1:2.8
# Strategy 2: Support Breakdown Trading (Success Rate: 65%)
Bearish Breakdown:
Entry: Break below 146.00 with volume confirmation
Stop Loss: 146.80 (failed breakdown)
Target 1: 145.00 (immediate support)
Target 2: 144.00 (harmonic target)
Target 3: 142.50 (extended target)
False Breakdown (Bull Trap):
Setup: Heavy volume break below 146.00 with immediate recovery
Entry: Long above 146.50 with confirmation
Target: 148.00-149.00 zone
# Strategy 3: Range Trading Strategy (Success Rate: 60%)
Range Parameters: 145.50-148.50 (current consolidation)
Sell Zone: 147.80-148.50 (range highs)
Buy Zone: 145.50-146.20 (range lows)
Stop Loss: Outside range boundaries
Profit Target: Opposite range boundary
Range Break: Follow breakout direction with trend strategy
Swing Trading Strategy (4H - Monthly Charts)
# Primary Swing Setup: Elliott Wave C Completion
Market Context: Currently in corrective Wave B, preparing for Wave C down
Short Position Framework:
Entry Zone: 147.50-149.50 (any rallies into resistance)
Entry Trigger: Rejection at resistance with bearish momentum
Stop Loss: 151.00 (above major resistance cluster)
Target 1: 143.50-144.50 (initial support)
Target 2: 140.32-141.67 (previous lows)
Ultimate Target: 136.00-139.58 (Elliott Wave C target)
Position Size: 2.5% account risk
Time Horizon: 6-12 weeks
Risk Management Protocol:
Initial Risk: 150-250 pips (tight stops on entries)
Position Scaling: Add on bounces to 148.00-149.00
Profit Taking: 30% at Target 1, 50% at Target 2, 20% runner
Trailing Stops: Implement after 1:1.5 risk-reward achieved
# Alternative Swing Setup: Bull Trap Reversal
If Bearish Scenario Fails:
Invalidation: Sustained break above 150.00
New Strategy: Long above 150.50 with confirmation
Targets: 154.20, 157.80, 161.95
Stop Loss: Below 148.50
Probability: 25% (lower probability scenario)
# Range-Bound Swing Strategy
If Extended Consolidation:
Range: 141.67-154.20 (broad consolidation range)
Sell Zone: 152.00-154.20 (range highs)
Buy Zone: 141.67-144.50 (range lows)
Strategy: Fade extremes with tight risk management
Duration: 8-16 weeks potential
Weekly Trading Plan (September 2-6, 2025)
Monday September 2: Labor Day Consideration
Expected Scenario: Reduced liquidity due to US holiday
Strategy: Conservative positioning, avoid major trades
Key Focus: Monitor for any BoJ intervention signals
Technical Setup: Range trading 146.50-148.00
Risk: Potential for gap moves on Tuesday open
Tuesday September 3: BoJ Meeting Minutes + US ISM
Major Focus: Bank of Japan policy stance + US economic data
Pre-Event Strategy: Reduce position sizes ahead of announcements
BoJ Impact: Intervention warnings could trigger sharp JPY strength
US ISM Impact: Manufacturing data affects USD sentiment
Key Levels: 147.25 (pivot), 148.50 (resistance), 146.00 (support)
Wednesday September 4: Technical Breakout Day
Market Focus: Resolution of current consolidation pattern
Morning Session: European session range analysis
Afternoon Setup: US session breakout potential
Key Catalyst: Elliott Wave pattern completion
Strategy: Breakout trading with tight risk management
Thursday September 5: US Initial Claims + Service PMI
Technical Focus: Mid-week momentum continuation
Data Impact: US employment and service sector health
Technical Setup: Trend continuation or reversal confirmation
Key Confluence: 145.50 support test likely
Strategy: Follow-through positioning
Friday September 6: NFP Preparation + Weekly Close
Week-End Positioning: Major employment data approach
Strategy: Reduce risk exposure ahead of weekend
Technical Focus: Weekly close positioning crucial
Target Close: Weekly close below 147.00 (bearish) or above 148.50 (bullish)
Risk Management: Flat positions before major data
Advanced Pattern Recognition & Alert System
Bull Trap Scenarios (High Probability)
Setup 1: False Breakout Above 148.50
Characteristics: Low volume breakout, immediate reversal below 148.00
Response: Aggressive short positioning
Target: 145.50-144.50 (measured move)
Stop Loss: Above 149.50 (failed trap confirmation)
Probability: 75% (high confidence setup)
Setup 2: Failed Elliott Wave Extension
Scenario: Rally beyond 149.50 but failure at 151.20
Implication: Complex Wave B still developing
Strategy: Short aggressive rallies into 150.00-151.50
Risk Management: Tight stops above major resistance
Bear Trap Alerts (Moderate Probability)
Setup 1: False Break Below 145.50
Characteristics: Heavy volume break with quick recovery above 146.50
Response: Long positioning on retest of breakdown level
Target: 148.50-149.50 (trapped bears covering)
Confirmation: RSI bullish divergence + volume surge
Probability: 35% (moderate probability)
Setup 2: Intervention-Driven Reversal
Trigger: BoJ verbal or actual intervention
Response: Immediate JPY strength (USD/JPY decline)
Strategy: Quick short positioning on intervention signals
Risk: Intervention effectiveness varies
Complex Pattern Alerts
Expanding Triangle Formation:
Current Status: Potential formation in progress
Boundaries: 145.00-149.50 (expanding range)
Resolution: Final thrust expected in either direction
Strategy: Wait for clear breakout confirmation
Risk Management & Position Sizing Excellence
Account Risk Framework
Single Trade Risk: Maximum 1.5% for intraday, 2.5% for swing
Currency Exposure: Total JPY exposure not exceeding 6% of account
Correlation Analysis: Monitor AUD/JPY, GBP/JPY correlations
Event Risk: Reduce positions 50% ahead of BoJ meetings
Advanced Stop Loss Methodology
Technical Stops:
Support/Resistance: 20-30 pips beyond key levels (volatile pair)
Moving Average: Above/below significant MA clusters
Volatility-Based: 2.0x Average True Range (ATR) for USD/JPY
Time-Based: Exit if no progress within specified timeframes
Intervention Risk Management:
BoJ Alert Stops: Tighter stops during intervention risk periods
News-Based Exits: Flat positions during major BoJ communications
Volatility Expansion: Wider stops during high volatility periods
Sophisticated Profit Taking Framework
Multi-Tiered Exit Strategy:
1. 20% at 0.8:1 Risk-Reward (early profit protection)
2. 40% at 1.5:1 Risk-Reward (secure majority profit)
3. 30% at 2.5:1 Risk-Reward (extended target)
4. 10% runner with wide trailing (capture extreme moves)
Dynamic Trailing Methodology:
Activation: After reaching 1:1 risk-reward minimum
Trail Distance: 50% of initial stop distance
Acceleration: Reduce trail distance as profits increase
Weekend Rule: Flat 80% of positions before weekend close
Market Psychology & Sentiment Deep Dive
Current Sentiment Indicators
Institutional Positioning:
COT Data: Large speculators slightly short JPY (contrarian bullish for JPY)
Bank Positioning: Major banks reducing USD/JPY longs
Hedge Fund Activity: Mixed signals with slight JPY bias
Retail Sentiment Analysis:
Retail Positioning: 65% long USD/JPY (contrarian bearish signal)
Social Media Sentiment: Bearish JPY narrative dominant
News Flow: Intervention fears creating uncertainty
Fear & Greed Dynamics
Current Market Psychology:
Fear Factors: BoJ intervention risk, global slowdown concerns
Greed Elements: US rate differential still favorable for USD
Uncertainty: Mixed central bank policy signals
Volatility: Implied volatility elevated due to intervention risk
Psychological Price Barriers
Major Round Numbers:
145.00: Critical psychological support
150.00: Major psychological resistance (intervention watch level)
155.00: Significant psychological barrier
160.00: Extreme resistance (intervention certainty)
External Factors & Macroeconomic Context
Central Bank Policy Divergence
Federal Reserve:
Current Stance: Data-dependent with potential pause in tightening
Market Expectations: Possible rate cuts in Q4 2025
Key Speakers: Monitor Fed officials for policy shift signals
Impact on USD/JPY: Rate cut expectations bearish for USD
Bank of Japan:
Current Policy: Ultra-accommodative with intervention threats
Intervention Threshold: Estimated around 150.00-152.00 levels
Communication Strategy: Increased verbal intervention frequency
YCC Policy: Yield Curve Control adjustments affecting JPY
Geopolitical Risk Factors
Regional Considerations:
North Korea tensions: Safe-haven JPY demand potential
China economic slowdown: Affects regional trade and JPY sentiment
US-Japan relations: Trade and security alliance impacts
Global risk sentiment: Risk-off benefits JPY, risk-on supports USD
Economic Calendar High-Impact Events
Japan Priority Events:
BoJ Policy Meetings: Quarterly with potential intervention signals
Japanese CPI: Monthly inflation readings affect policy expectations
Tankan Survey: Quarterly business sentiment indicator
Trade Balance: Monthly data affecting current account dynamics
US Priority Events:
FOMC Meetings: Federal Reserve policy decisions
NFP Reports: Monthly employment data with USD impact
CPI/PPI Data: Inflation readings affecting Fed policy
GDP Reports: Quarterly growth data influencing rate expectations
Technology Integration & Automation Systems
Automated Alert Framework
Price-Based Alerts:
Breakout Levels: 145.00, 148.50, 150.00, 152.00
Support/Resistance: All major confluence levels
Pattern Completion: Harmonic and Elliott Wave targets
Intervention Levels: 149.50, 152.00 (BoJ watch levels)
Indicator-Based Alerts:
RSI: Extreme readings (<25, >75) for reversal potential
Bollinger Bands: Band squeeze completion and expansion signals
MACD: Signal line crosses and histogram divergences
Volume: Unusual volume spikes (3x average due to intervention risk)
Volatility: ATR expansion beyond 150% of 20-day average
News-Based Alert System
BoJ Communication Monitoring:
Press Releases: Real-time BoJ statement analysis
Official Speeches: Governor Ueda and board member communications
Market Intervention: Actual or verbal intervention signals
Policy Changes: YCC adjustments or policy stance modifications
US Economic Data Integration:
High-Impact Releases: NFP, CPI, FOMC statements
Fed Communications: FOMC minutes and Fed speaker events
Economic Surprises: Significant data deviations from consensus
Rate Expectations: Fed funds futures probability shifts
Trading Platform Integration Excellence
TradingView Professional Setup:
Multi-timeframe Dashboard: 5M, 15M, 1H, 4H, Daily, Weekly, Monthly
Custom Indicator Stack: Harmonic scanner, Elliott Wave tools, Ichimoku
Alert Management: Price, indicator, and pattern-based notifications
Strategy Backtesting: Historical performance validation across timeframes
MetaTrader 5 Advanced Integration:
Expert Advisor Development: Automated entry/exit based on confluences
Risk Management Automation: Dynamic position sizing and stop adjustments
News Feed Integration: Economic calendar with automatic impact assessment
Performance Analytics: Detailed trade statistics and drawdown analysis
Professional Trading Tools:
Bloomberg Terminal: Real-time news flow and institutional positioning
Reuters Integration: Central bank communication monitoring
TradingCentral: Additional harmonic pattern confirmation
Commitment of Traders: Weekly positioning analysis integration
Advanced Strategy Combinations & Confluence Trading
Tier 1 Multi-Confluence Signals (Highest Probability: 80-85%)
Bearish Confluence Setup:
- Elliott Wave C completion + Harmonic Gartley target + RSI divergence + Ichimoku bearish signals + Volume confirmation + BoJ intervention risk
Entry Zone: 148.00-149.50
Target Zone: 143.50-145.50
Risk-Reward: 1:3.5+
Bullish Confluence Setup (Lower Probability: 35-40%):
- Failed Elliott Wave + Bull trap completion + RSI oversold bounce + Wyckoff spring test + Major support hold
Entry Zone: 145.00-146.50 (if support holds)
Target Zone: 150.00-152.00
Risk-Reward: 1:2.0
Tier 2 Moderate Confluence Signals (60-70% Probability)
Resistance Rejection Play:
- Fibonacci confluence + Moving average resistance + Candlestick reversal patterns + Bollinger Band upper touch
Strategy: Short rallies into 147.25-148.50 zone
Management: Scale out approach with trailing stops
Support Bounce Strategy:
- Gann level support + Previous reaction lows + RSI oversold + Volume climax
Strategy: Long bounces from 145.50-146.00 zone
Target: 147.50-148.50 resistance zone
Tier 3 Single-Method Signals (45-55% Probability)
Pattern-Only Trades:
- Pure candlestick pattern plays without additional confluence
Risk Management: Tighter stops, smaller position sizes
Profit Targets: Conservative, quick profit-taking approach
Scenario Planning & Strategic Contingencies
Scenario 1: Bearish Breakdown Acceleration (55% Probability)
Trigger Events:
- Break below 145.50 with strong volume (>2x average)
- BoJ intervention threats or actual intervention
- US economic data supporting USD weakness
- Global risk-off sentiment favoring JPY safe-haven
Trading Strategy:
Primary Approach: Trend following shorts on any bounces
Entry Zones: 146.50-147.50 (on relief rallies)
Target Sequence: 144.50 → 142.50 → 140.32 → 139.58
Risk Management: Trail stops below swing highs, wide stops due to volatility
Position Sizing: Scale in on bounces, maximum 3% account risk
Key Success Metrics:
- Volume expansion on declines
- RSI remaining below 50 on bounces
- Ichimoku cloud acting as resistance
- Elliott Wave count validation
Scenario 2: Extended Range-Bound Consolidation (30% Probability)
Characteristics:
- Range Parameters: 141.67 - 154.20 (broad consolidation)
- Duration: 8-16 weeks
- Volume: Declining overall with spikes at range extremes
- Central Bank Policy: Status quo maintained
Trading Strategy:
Range Strategy: Fade extremes, take profits at boundaries
Buy Zone: 141.67-144.50 with strong confirmation signals
Sell Zone: 152.00-154.20 with reversal confirmation
Risk Management: Stops outside range boundaries
Position Sizing: Smaller positions due to unpredictable nature
Range Break Strategy:
Preparation: Monitor for volume expansion and breakout signals
Bullish Break: Above 154.20 targets 157.80-161.95
Bearish Break: Below 141.67 targets 139.58-136.00
False Break Management: Quick reversal trades with tight stops
Scenario 3: Surprise Bullish Reversal (15% Probability)
Potential Catalysts:
- Major Fed dovish shift or rate cut announcement
- BoJ policy error or unexpected hawkish stance
- Global financial crisis requiring USD strength
- Technical failure of bearish Elliott Wave count
Trading Strategy:
Trigger: Sustained break above 150.00 with heavy volume
Confirmation Required: Weekly close above 151.50
Target Sequence: 154.20 → 157.80 → 161.95 → 165.00+
Risk Management: Below 148.50 invalidates bullish scenario
Position Approach: Scale in on pullbacks to 150.00-151.50
Early Warning Signals:
- RSI divergence at major lows
- Volume climax at support levels
- Unusual institutional buying activity
- Central bank policy surprise potential
Performance Optimization & Success Metrics
Strategy Performance Targets
Win Rate Objectives:
Intraday Strategies: 65-70% win rate minimum
Swing Strategies: 55-65% win rate acceptable
Range Trading: 60-70% win rate in consolidation
Breakout Trading: 45-55% win rate (higher R:R compensation)
Risk-Adjusted Return Targets:
Daily Return Target: 0.5-1.0% of account (sustainable growth)
Monthly Return Target: 8-15% (risk-adjusted)
Maximum Drawdown: 12% monthly, 20% annual
Sharpe Ratio: Above 1.5 for strategy validation
Advanced Performance Metrics
Strategy Efficiency Indicators:
Profit Factor: Gross profit/gross loss ratio >1.8
Average Win vs Average Loss: Minimum 2:1 ratio
Consecutive Loss Tolerance: Maximum 4 losing trades
Recovery Time: Maximum 2 weeks to recover from significant drawdown
Market Timing Effectiveness:
Entry Precision: Within 25 pips of optimal entry point
Exit Timing: Capture minimum 60% of available move
Pattern Recognition Accuracy: 75%+ success rate on major patterns
News Impact Prediction: 70%+ accuracy on high-impact events
Continuous Improvement Framework
Weekly Strategy Review:
Trade Journal Analysis: Document all entries, exits, and reasoning
Pattern Performance: Track success rates of different setups
Market Condition Adaptation: Adjust strategies based on volatility and trending conditions
Risk Management Assessment: Evaluate stop-loss and position sizing effectiveness
Monthly Strategy Optimization:
Backtest Updates: Incorporate new data and market conditions
Parameter Adjustment: Optimize indicator settings and confluence requirements
Strategy Evolution: Develop new approaches based on market changes
Performance Benchmark: Compare against major currency indices and peers
Economic Event Calendar & High-Impact Scheduling
September 2025 Critical Events
Week 1 (September 1-5):
September 3: US ISM Manufacturing PMI (High Impact)
September 4: ECB Rate Decision (Medium Impact on USD/JPY)
September 5: US Initial Claims + Services PMI (Medium Impact)
September 6: US Non-Farm Payrolls (Very High Impact)
Week 2 (September 8-12):
September 10: US CPI Data (Very High Impact)
September 11: ECB Press Conference (Medium Impact)
September 12: US PPI Data (Medium Impact)
Week 3 (September 15-19):
September 17: FOMC Rate Decision (Very High Impact)
September 18: BoJ Policy Meeting (Extremely High Impact for JPY)
September 19: US Existing Home Sales (Low Impact)
Week 4 (September 22-26):
September 24: Global PMI Flash Estimates (Medium Impact)
September 25: US Durable Goods Orders (Medium Impact)
September 26: US GDP Preliminary (High Impact)
Event-Specific Trading Strategies
BoJ Meeting Strategy (September 18):
Pre-Event: Reduce positions by 70% due to intervention risk
Event Strategy:
Hawkish Surprise: Long JPY (short USD/JPY) immediately
Dovish/Status Quo: Monitor for verbal intervention threats
Intervention Announcement: Immediate short USD/JPY positioning
Post-Event: Wait for volatility to settle before major positioning
FOMC Strategy (September 17):
Pre-Event: Flat positions 2 hours before announcement
Dovish Fed: Bearish USD/JPY, target 144.50-145.50
Hawkish Fed: Bullish USD/JPY, target 149.50-151.20
Neutral Fed: Range trading strategy 146.00-148.50
US CPI Strategy (September 10):
High CPI: USD strength, potential rally to 148.50-149.50
Low CPI: USD weakness, potential decline to 145.50-146.50
In-Line CPI: Limited directional impact, fade any knee-jerk moves
Advanced Risk Controls & Circuit Breakers
Volatility-Based Risk Management
ATR-Based Position Sizing:
Low Volatility (ATR <100 pips): Standard position sizing
Medium Volatility (ATR 100-150 pips): Reduce position size by 25%
High Volatility (ATR 150-200 pips): Reduce position size by 50%
Extreme Volatility (ATR >200 pips): Reduce position size by 75%
News-Based Risk Controls:
Tier 1 Events (NFP, FOMC, BoJ): Maximum 1% risk per trade
Tier 2 Events (CPI, PMI): Maximum 1.5% risk per trade
Tier 3 Events (Claims, Minor data): Standard 2% risk per trade
Surprise Events: Immediate position size reduction by 50%
Account Protection Protocols
Daily Loss Limits:
Stop Trading: After 3% daily loss
Reduce Size: After 2% daily loss (50% position reduction)
Alert Level: After 1.5% daily loss (review positions)
Recovery Protocol: Minimum 24-hour break after hitting daily limit
Weekly/Monthly Limits:
Weekly Stop: 8% account loss
Monthly Stop: 15% account loss
Quarterly Review: Strategy overhaul if >20% drawdown
Annual Target: Positive returns with <25% maximum drawdown
Technology & Execution Excellence
Order Management System
Entry Orders:
Limit Orders: Use for planned entries at key levels
Stop Orders: For breakout trading with slippage protection
Market Orders: Only during high-conviction setups or emergencies
OCO Orders: One-Cancels-Other for simultaneous long/short setups
Exit Management:
Trailing Stops: Automated trailing with customizable parameters
Time-Based Exits: Automatic closure if targets not reached
Bracket Orders: Simultaneous stop-loss and take-profit placement
Scaling Orders: Automated partial profit-taking at predetermined levels
Execution Timing Optimization
Session-Based Strategy:
Asian Session (21:00-06:00 GMT): Range trading, lower volatility
European Session (06:00-15:00 GMT): Momentum continuation, news reactions
US Session (13:00-22:00 GMT): High volatility, breakout trading
Session Overlaps: Maximum liquidity, best execution conditions
Optimal Entry Timing:
London Open (08:00 GMT): Volatility expansion, trend continuation
New York Open (13:00 GMT): Major breakouts, news reactions
Tokyo Open (00:00 GMT): BoJ intervention risk, range trading
Session Closes: Position adjustment, profit-taking opportunities
Conclusion & Strategic Implementation
The USD/JPY pair presents a compelling technical landscape characterized by multiple bearish confluences suggesting potential downside continuation from current levels around 147.036. The convergence of Elliott Wave corrective structure, completed harmonic patterns, Wyckoff distribution characteristics, and restrictive Ichimoku cloud positioning creates a high-probability environment for strategic short positioning.
Primary Strategic Themes:
1. Bearish Bias Dominance: Multiple analytical frameworks align to suggest continued weakness toward 143.50-140.32 support cluster
2. Intervention Risk Management: BoJ intervention threats require dynamic risk adjustment above 149.50-150.00 levels
3. Range Trading Preparation: Extended consolidation between 141.67-154.20 remains possible alternative scenario
4. Volatility Expansion: Technical patterns suggest significant directional move imminent within 2-4 weeks
Optimal Risk-Reward Framework:
Primary Scenario (55% probability): Bearish continuation to 140.32-143.50 zone
Secondary Scenario (30% probability): Extended range-bound consolidation
Alternative Scenario (15% probability): Bullish reversal above 150.00
Critical Success Factors:
1. Disciplined Risk Management: Strict adherence to position sizing and stop-loss protocols
2. Multi-Timeframe Confirmation: Wait for alignment across various analytical methods
3. Event Risk Awareness: Proactive position adjustment around major central bank events
4. Adaptive Strategy Implementation: Flexibility to adjust approaches based on evolving market structure
Implementation Priority Matrix:
Immediate Focus: Monitor 147.25-148.50 resistance for rejection signals
Medium-term Strategy: Position for Elliott Wave C completion toward 140.32-143.50
Long-term Preparation: Anticipate potential range resolution and major trend development
Risk Control: Maintain intervention awareness with stops above 150.00-151.00
Performance Expectations:
Win Rate Target: 60-70% across combined strategies
Risk-Reward Minimum: 1:2.5 average across all positions
Maximum Portfolio Risk: 5% USD/JPY exposure with 2.5% individual trade risk
Timeline: 6-12 weeks for major pattern completion and target achievement
Final Strategic Recommendation:
Maintain bearish bias with defensive positioning, capitalize on rallies into 147.50-149.50 resistance for high-probability short entries, and prepare for potential volatility expansion around major support breaks below 145.50. Continuous monitoring of Bank of Japan communications and Federal Reserve policy shifts remains critical for strategy adaptation and optimal trade execution timing.
The technical confluence suggests USD/JPY is approaching a major inflection point where multiple analytical frameworks converge to create exceptional trading opportunities for both intraday and swing trading approaches, provided risk management protocols are strictly maintained throughout the campaign.
Risk Disclaimer: Currency trading involves substantial risk of loss and may not be suitable for all investors. Past performance is not indicative of future results. The analysis provided is for educational purposes and should not be considered as financial advice. Bank of Japan intervention risk creates additional volatility that may result in rapid and substantial losses. Traders should conduct independent analysis and consider their risk tolerance and investment objectives before executing any trading strategies based on this analysis.