BTCUSDT – Major Distribution Zone Detected! Potential Drop Ahead📉 BTCUSDT – Distribution Completed, Correction Likely
1️⃣ Previous Range Accumulation (Left Zone)
Price moved sideways in a tight consolidation box.
After holding for some time, BTC broke down sharply, showing clear supply pressure.
---
2️⃣ Strong Recovery Rally (Middle Zone)
After the breakdown, price created a bullish accumulation zone.
A strong impulsive move up followed — this is a classic liquidity grab + reversal.
The diagonal trendline shows the momentum slope of the recovery.
---
3️⃣ Current Market Structure (Right Zone)
Price is currently inside another consolidation box, similar to the first range.
This suggests distribution, not accumulation.
Momentum is weakening near 93,000–94,000, with repeated rejections.
---
4️⃣ Expected Move (Bearish)
Your drawn projection is correct:
After sideways movement, BTC is likely to break down from this range.
Target region shown (~91,000 zone) makes sense because it aligns with:
Previous support
Unfilled imbalance
Ichimoku lower cloud support
---
5️⃣ Key Levels
Resistance: 93,800 – 94,200
Support: 92,000 → 91,000
Break Confirmation: Closing below 92,200
Bearish target: 91,000 – 90,800
---
🔍 Summary
BTC is forming a distribution zone after an overextended move. Market shows signs of exhaustion.
Unless BTC breaks above 94,200, the probability favors a move down toward 91,000.
Chartanalysis

GBPUSD Rejection Zone: Smart Money Plan Ahead🔍 GBPUSD Technical Analysis
1. Structure Break + Bullish Momentum
Price has broken out of the previous range and is now trading above the key zone 1.3333 – 1.3348.
This breakout confirms bullish market structure.
2. Pullback Expected
Your chart correctly marks a pullback area around the breakout zone.
Price is likely to retest:
👉 1.3348 – 1.3340 (first support)
👉 1.3333 (secondary liquidity zone)
These levels may act as support for the next bullish move.
3. No Sell Setup
The “NO SELL” sign matches the market structure:
Trend is bullish
Price trading above Ichimoku cloud
Breakout + continuation patterns
Selling is risky unless price breaks below 1.3320
4. Next Move Projection
If price retests support and holds:
📈 Upside targets:
1.3380
1.3400
If support fails:
📉 Downside liquidity target:
1.3310 (your marked level)
5. Trendline + Cloud Support
Both the trendline and the green Ichimoku cloud show strong bullish energy.
As long as price stays above them, buyers remain in control.
---
✅ Summary
Market is bullish.
Expect pullback → continuation.
Buy dips, avoid selling.
Key support: 1.3348 – 1.3333.
Breakout targets: 1.3380 – 1.3400

The Market Doesn’t Wait — But Winners Don’t Hesitate.The market has transitioned into a short-term bearish cycle after sweeping the buy-side liquidity above 4243. A clean CHoCH → BOS sequence confirms the shift from bullish displacement into redistribution, signaling bearish orderflow dominance.
📌 1. CURRENT TREND — MARKET STRUCTURE
The chart is showing a short-term bearish structure on H1 because:
- After forming a HH, price broke the previous low → BOS to the downside.
- Current structure: LH → LL → LH → minor HL → LL.
- Price is heading toward the 4,181 – 4,163 support zone, which is a major structure low.
➡️ H1 trend: short-term bearish (deep pullback)
➡️ Higher-timeframe trend (H4/D1): still bullish → this drop is a corrective move.
📌 2. KEY LEVELS — SUPPORT & RESISTANCE
Main Resistance
- 4,225 — previous swing high and key liquidity target.
Major Support Zones
- 4,181 — mid-range support, likely first reaction point.
- 4,163 — key structure low; strong zone where a new HL may form.
📌 3. MAIN SCENARIOS
Scenario 1 (Primary Scenario): Price taps 4,181 → small sweep → pushes up
Price may form a small internal LL/HL pattern near 4,181.
Potential for liquidity sweep / double bottom.
If price confirms, it will push back toward:
- 4,200
- 4,215
- Main target: 4,225
➡️ This aligns with the higher-timeframe bullish trend + H1 pullback.
Scenario 2 (Cleanest & Highest RR): Price sweeps 4,163 then reverses
- A strong liquidity grab around 4,163 forms a major HL.
- This is where smart money typically accumulates positions.
- A bullish BOS afterward confirms the reversal on H1.
➡️ Best risk-to-reward setup.
📌 4. ENTRY – SL – TP
🎯 ENTRY 1: 4,181 – 4,185 (after rejection/confirmation)
SL: below 4,172
TP1: 4,200
TP2: 4,215
TP3: 4,225
🎯 ENTRY 2 (safer, high RR): 4,163 – 4,168
SL: below 4,150
TP1: 4,185
TP2: 4,200
TP3: 4,225
📌 5. SUMMARY
H1 structure is bearish, but it is simply a deep pullback inside a bullish higher-timeframe trend.
The best long setups are at 4,181 and 4,163.
Once a new HL forms, bullish continuation targets 4,225.
Every pullback is a chance — not a punishment. Stay patient, trust your structure, and execute like a pro.

EURUSD 30M: Identifying Key Demand Zone for Potential ReversalEUR/USD 30-Minute Chart Analysis: Signs of Bullish Reversal Amid Downtrend
the EUR/USD currency pair on a 30-minute timeframe. It captures price action from approximately December 3 to December 6, 2025, based on the x-axis labels (21:00 on Dec 3 through 21:00 on Dec 6, though the labels appear truncated). The chart uses a candlestick format to illustrate market movements, with annotations highlighting potential reversal signals. At the time of the snapshot, the pair is quoted at 1.16571, with a daily high of 1.16580, low of 1.16552, close of 1.16573, showing a slight decline of -0.0002 (-0.01%) and volume of 50,509.
The overall visual suggests a short-term downtrend in EUR/USD, characterized by a series of red (bearish) candles, but with emerging bullish cues at lower levels. This could indicate exhaustion in selling pressure and the potential for a reversal. Below, I'll break down the chart in detail, incorporating technical analysis elements, key patterns, and broader context for traders. This explanation is structured as a TradingView-style idea for clarity and professionalism.
Chart Overview and Timeframe Context
The 30-minute chart provides a granular view of intraday price dynamics, ideal for short-term traders like scalpers or day traders. EUR/USD, one of the most liquid forex pairs, often reacts to economic data releases, interest rate differentials between the ECB and Fed, and geopolitical events. On this date (December 4, 2025), the pair appears to be trading in a narrow range around 1.1650–1.1680, following a broader downtrend visible in the left portion of the chart.
The y-axis scales from approximately 1.1635 to 1.1680, with price labels on the right. The x-axis shows time in UTC, spanning multiple trading sessions (including overnight hours), which highlights the 24/5 nature of forex markets. The background is light green, with a horizontal green band marking a "Reversal Zone - Demand Zone" near the lower end, suggesting a support area where buyers may step in.
Key visual elements include:
Candlesticks : Predominantly red bodies with long upper and lower wicks, indicating volatility and seller dominance early on, followed by smaller candles near the bottom, hinting at indecision.
Annotations:
A green horizontal zone labeled "Reversal Zone - Demand Zone" around 1.1645–1.1650, with a green circle at the base.
A purple circle labeled "Volume Burst" at the low point, suggesting a spike in trading activity.
A black arrow pointing upward to "Pattern Bust" near the recent candles, implying a failed bearish pattern.
"Ask" labeled in red at 1.16578, possibly indicating the current ask price or a target level.
A U.S. flag icon and lightning bolt at the bottom, which might represent news events or alerts (common in TradingView).
This setup points to a classic reversal scenario: after a sell-off, the price enters a demand zone with increased volume, busting a potential continuation pattern and signaling bullish momentum.
Technical Analysis: Patterns and Indicators
From a technical perspective, the chart reveals a bearish-to-bullish transition. Let's dissect the key components:
Downtrend Structure: The left side shows a series of lower highs and lower lows, with large red candles from around 1.1680 down to 1.1650. This could represent a pullback within a larger trend, possibly influenced by USD strength (e.g., due to U.S. economic data or Fed policy hints). Wicks on these candles indicate rejection at highs, reinforcing seller control.
Reversal Zone and Demand Zone: The highlighted green band (approximately 1.1645–1.1650) acts as a support area. In price action trading, demand zones are regions where historical buying interest has absorbed selling pressure, often leading to bounces. The price touching this zone with a "Volume Burst" (purple circle) suggests institutional accumulation—traders buying dips amid high turnover. This burst could be measured via volume bars (though not fully visible here), where a spike often precedes reversals.
Pattern Bust: The annotation "Pattern Bust" with an upward arrow likely refers to a failed bearish pattern, such as a head-and-shoulders continuation or a flag breakdown. In trading psychology, a "bust" occurs when a pattern sets up for one direction but reverses sharply, trapping participants (e.g., short sellers covering positions). Here, after probing the demand zone, the price forms a small green candle or doji, indicating bullish rejection and potential for an upside breakout.
Volume and Momentum Insights: The "Volume Burst" at the low is crucial—high volume at support often signals capitulation (final sellers exiting) followed by reversal. If integrated with indicators like RSI or MACD (not shown but implied in TradingView setups), we'd likely see oversold conditions (e.g., RSI below 30 rebounding). The chart's minimalism focuses on pure price action, aligning with strategies like Supply/Demand or ICT (Inner Circle Trader) methodologies.
Broader Trend Lines and Levels: An implied horizontal support at 1.1650 runs across the chart, with potential resistance at 1.1670–1.1680 (from prior highs). The arrow suggests an upward trajectory, possibly targeting the ask at 1.16578 or higher. No explicit trend lines are drawn, but the structure implies a channel breakdown turning into a false breakout.
In summary, this chart embodies a "fakeout" scenario: bears push to new lows, but volume and zone defense by bulls create a springboard for recovery.
Fundamental Context for EUR/USD
While the chart is technical, fundamentals provide color. As of December 4, 2025, EUR/USD might be influenced by:
Eurozone inflation data or ECB meeting outcomes, potentially weakening the euro if dovish.
U.S. non-farm payrolls (NFP) anticipation, often causing volatility—strong data could bolster USD.
Global risk sentiment: Risk-off environments favor USD as a safe haven.
Traders should cross-reference with economic calendars; a volume burst might coincide with news like PMI releases.
Trade Idea: Bullish Reversal Setup
Based on the chart:
Entry: Long above the demand zone confirmation, e.g., a close above 1.1655 with increasing volume. Wait for a bullish candle engulfing the prior red one.
Stop Loss: Below the demand zone low, around 1.1640, to protect against further downside.
Take Profit: Initial target at prior resistance (1.1670), with extensions to 1.1680 or Fibonacci retracement levels (e.g., 50% of the downmove).
Risk-Reward Ratio: Aim for 1:2 or better—risk 10 pips to gain 20+.
Timeframe Suitability: Ideal for intraday trades, holding 1–4 hours. Scale out positions if momentum builds.
This idea assumes no major news breaks; always use a demo account for testing.
Risk Management and Trader Mindset
No trade is without risk—forex markets are prone to whipsaws, especially in ranging conditions like this. Key mindsets:
Discipline Over Emotion: Stick to the zone; don't chase if the reversal fails.
Position Sizing: Risk no more than 1–2% of capital per trade to survive drawdowns.
Confirmation Bias Avoidance: The "Pattern Bust" is promising, but validate with multi-timeframe analysis (e.g., check 1H or 4H for alignment).
Continuous Learning: Charts like this teach the value of volume in reversals—study historical EUR/USD zones for patterns.
In conclusion , this 30-minute EUR/USD chart signals a potential shift from bearish exhaustion to bullish control, driven by the demand zone and volume burst. If confirmed, it could offer a high-probability setup. Monitor for follow-through in subsequent sessions. For real-time updates, refer to TradingView or reliable forex platforms. Trade responsibly.

USDJPY 30-Minute Analysis | Central Reversal Zone & Demand Zone📌 USDJPY – 30 Minutes Technical Breakdown
Smart Money Reversal Zone | QFL Reaction | Pattern Confirmation Needed
🔎 1. Market Overview
USDJPY on the 30-minute timeframe is currently trading inside a corrective bearish phase, following a series of lower highs that show temporary selling pressure. Despite this short-term bearish structure, the pair is now approaching a high-value Central Reversal Zone, where institutional buyers have previously shown strong interest.
This creates a potential opportunity for a trend continuation bounce, provided the correct pattern forms within the zone.
📉 2. Structure Analysis
A. Recent Down-Move & Liquidity Collection
The price has been gradually declining after failing to break above the previous intraday high. This downward move is likely driven by:
Liquidity hunting
Stop-loss sweeping
Mitigation of previous buy orders
The highlighted area labeled QFL marks an earlier Key Failure Level, where price sharply reversed.
B. Central Reversal Zone (CRZ)
The blue demand zone under the price is the Central Reversal Zone, which contains:
Previous reaction levels
Order block footprints
Multiple wick rejections
Evidence of quiet accumulation
This zone acts as the primary target and expected bounce region.
🎯 3. Expected Price Behavior
🟢 Bullish Scenario (High Probability)
If price taps into the Central Reversal Zone and forms a bullish confirmation pattern (engulfing, double bottom, or strong rejection wick):
✔ USDJPY may initiate a clean bullish reversal
✔ Possibility to retest 155.600 – 155.950 levels
✔ Buyers regain control with institutional support
This is shown by the upward arrow on the chart.
⚠️ Pattern Requirement
The label “Pattern Must” indicates:
➡ No blind entries
➡ A clear bullish structure must form
➡ Confirmation of demand must appear
Without pattern confirmation, price may continue to range inside the zone.
🛑 4. Bearish Scenario (If Pattern Fails)
If no bullish pattern forms:
Price may dip to sweep more liquidity
Deeper grab inside the zone is possible
Temporary range or double-tap before reversing
This scenario still keeps the bullish reversal valid, but only after liquidity collection.
📈 5. Professional Outlook
Overall, USDJPY is approaching a critical institutional demand zone, where we expect the next major reaction. Buyers may step in aggressively if the expected pattern forms.
This setup is ideal for:
Smart Money traders
QFL / Failure Level traders
Reversal traders
Confirmation-based entries
Patience is key — only enter after the pattern appears.

XAUUSD Technical Analysis : Targeting Demand Zones on 30 Mints 📊 XAUUSD (Gold) – 30-Minute Chart Smart Money Analysis
Liquidity Sweep | Volume Burst Zones | QFL Structure
🔍 1. Market Context & Current Price Behavior
Gold on the 30-minute timeframe is currently showing bearish momentum after rejecting the recent intraday high. The price has been consistently forming lower highs and lower lows, indicating controlled selling pressure from institutional participants.
The market is now approaching two demand zones where liquidity and volume reactions are expected. These areas are highlighted with blue boxes on the chart and marked as "Target" zones.
📉 2. Breakdown of the Price Move
A. Strong Sell-Off From Recent Swing High
The recent impulsive bearish candle broke below the previous structure, signaling:
A potential continuation of bearish trend,
A possible liquidity grab, preparing for a bullish correction from lower zones.
B. QFL / Base Levels Identified
The annotation “QFL 1” and “QFL 2” represents base levels (original demand zones) where price previously bounced aggressively.
These areas often serve as:
Liquidity collection zones
Re-entry points for smart money
Points where volume bursts initiate
🎯 3. Target Levels & Expected Reaction Zones
**🟦 Target Zone 1 (Upper Demand Zone)
This is the first reaction area where price may:
Form a reversal pattern (double bottom, engulfing, or pin bar)
Slow down the bearish momentum
Give a short-term bounce for scalpers
This zone is optimal for counter-trend trades only if confirmation patterns appear (as labeled “Pattern Needed Here”).
**🟩 Target Zone 2 (Lower Demand + Volume Burst Zone)
The second zone is stronger because:
It overlaps with a previous volume burst area
It also aligns with deeper liquidity pools
Smart money often initiates long positions in such zones
This zone is suitable for more high-probability buys, again requiring price action confirmation.
📌 4. Institutional Footprint & Liquidity Logic
The chart shows a clear structure that suggests:
Institutions drove price down to collect buy-side liquidity.
The market is likely engineered to tap into these lower liquidity pools before any strong reversal.
A strong bullish push is possible only after volume confirmation inside the highlighted zones.
📈 5. Trading Plan (Professional Insight)
🔽 Short Bias Until Zone
Price is expected to continue downward until it taps into the demand zones.
🔼 Buy Only With Confirmation
Look for:
Bullish engulfing
FTR/FVG reaction
Volume spike
Break of minor structure
❌ Avoid Premature Entries
Entering without confirmation can lead to getting trapped in a liquidity sweep.
📝 Conclusion
Gold is currently showing controlled bearish pressure, but two strong demand zones are waiting below. These zones are likely areas where institutional buying interest may re-enter the market.
The best strategy is to wait for price to reach the highlighted target zones and watch for bullish reversal patterns, as clearly labeled “Pattern Needed Here” on the chart.
Patience will reward you with a high-probability, low-risk entry.

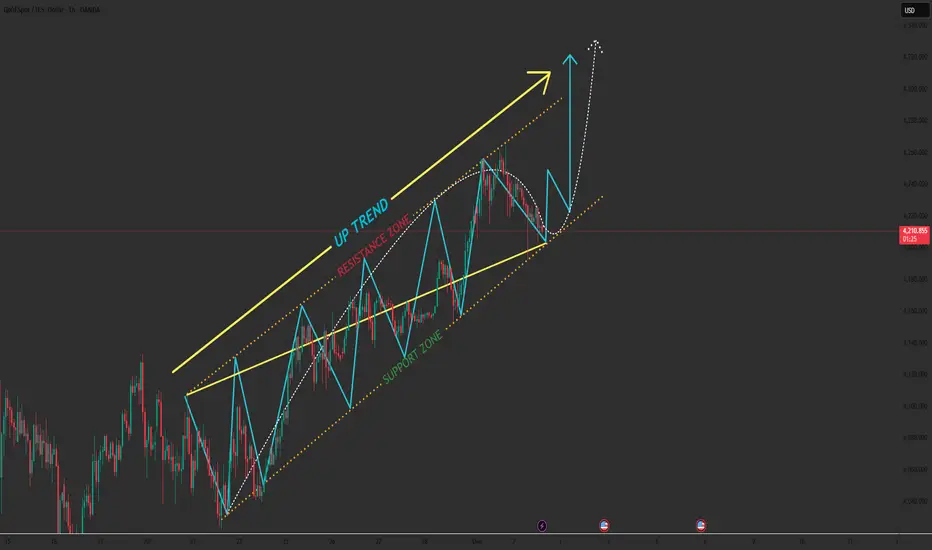
The Pullback Everyone Fears… But Smart Traders Are Waiting For1️⃣ Price Retracing Into Key Support
Gold is dipping into the support zone just below yesterday’s low.
This zone aligns with:
- The lower boundary of the short-term retracement channel
- The midline of the major ascending channel
- A liquidity pocket where buyers previously stepped in aggressively
This creates a textbook buy-the-pullback setup.
2️⃣ Trend Structure: Buyers Still in Control
Despite the temporary pullback:
- Trendline remains intact
- Momentum is still upward
- No major swing low has been broken
As long as 4,190 holds, the market favors continuation to the upside.
3️⃣ Expected Upside Rotation
If price stabilizes above 4,190–4,200 and intraday buyers return:
- Gold may begin a new bullish swing
- First target sits at 4,260
- Main target aligns with the upper boundary of the channel → 4,290
This completes the wave cycle shown in the chart (blue pattern).
4️⃣ Risk Scenario
⚠️ If Gold cleanly breaks below the channel and invalidates the trendline:
Price can correct toward 4,120 and even retest 4,100 before rebuilding bullish structure.
This does not kill the uptrend — but it delays the next bullish leg.
➡️ Primary Scenario
Pullback holds above 4,190 → bullish continuation → target 4,260 → 4,290.
⚠️ Risk Scenario
Break below the channel = short-term drop toward 4,120–4,100.
If this analysis resonates with you or if you see a different angle drop your thoughts in the comments. I’d love to hear your view!
When an Uptrend Breaks..Smart Money Doesn’t Hesitate📉 XAUUSD MARKET OUTLOOK (1H)
- Gold has officially transitioned from its previous rising channel into a clear downtrend structure, marked by lower highs, lower lows, and a decisive break below the rising support line. The bullish momentum has faded, and sellers are gradually taking control.
- Price is now moving inside a descending correction channel, and every rally is being absorbed by supply — a textbook shift from accumulation to distribution.
1️⃣ Uptrend Channel Has Been Broken
Gold traded for several days inside a rising channel, respecting both support and resistance.
But price has now:
- Broken below the rising trendline
- Retested it and failed
- Formed a new bearish structure
This confirms the end of the previous bullish phase.
2️⃣ Strong Resistance Zone Holding Firm
The resistance zone around 4,235 – 4,245 has rejected price multiple times.
Each rejection produced:
- Lower swing highs
- Increasing bearish pressure
- Momentum shift toward sellers
This zone is now the ceiling of the new downtrend.
3️⃣ Descending Channel Signals Bearish Continuation
- Price is currently moving cleanly inside a downward-sloping channel.
- Every bounce is shallow → every drop is sharp.
- This is the behavior of a market controlled by sellers.
If the current corrective bounce fails at the upper boundary of the channel, another hard leg down is highly likely.
4️⃣ Key Target: Strong Support Zone Below
The next major liquidity area lies at the 4,105 – 4,120 strong support zone.
This is where buyers previously stepped in aggressively.
If price reaches this zone again, expect:
- Either a strong bullish reaction
- Or a deeper breakdown if momentum remains heavy
➡️ Primary Scenario (High Probability)
Retest of the channel top → rejection → bearish continuation into 4,105 – 4,120 zone.
Sellers remain in control as long as price stays under the broken trendline.
⚠️ Risk Scenario
A clean breakout above the descending channel may trigger a temporary bullish correction, but the overall structure remains bearish unless price reclaims the old resistance zone.
What’s your take on gold’s trend shift?

BTC’s Bounce Looks Weak — Sell Pressure May Hit Harder .....📌 Quick Market Breakdown (BTC – 4H)
Bitcoin is showing a textbook corrective bounce after a sharp breakdown from its rising structure. The current reaction is weak and aligns perfectly with a short-term bearish continuation setup.
Key Points From the Chart
- BTC broke both trendline support and the rising wedge, creating strong downside momentum.
- Price is now pulling back into the previous demand ⇒ now supply zone (the green zone you marked).
- The bounce is losing steam exactly at the SHORT ENTRY zone, signaling a high-probability reversal point.
- Market structure has officially shifted from bullish → bearish short-term.
🎯 Main Scenario (High Probability)
The pullback rejects and BTC heads lower.
Short entry zone: 86,800 – 87,500
Target 1: 84,000 zone (first liquidity pocket)
Target 2: 82,000 zone (deep demand zone)
This fits perfectly with the break-retest-drop pattern.
⚠️ Alternate Scenario (Low Probability)
If BTC closes a 4H candle ABOVE 88,600, the short-term bearish idea is invalidated.
In that case, BTC may retest 89,500 – 90,000, but this is less likely given current momentum.
📌 Final Conclusion
BTC is currently in a bearish correction phase, and the bounce you're seeing now is likely nothing more than a pullback into resistance.
The chart strongly favors continuation to the downside, with sellers ready to step in aggressively from the short-entry zone.

Netflix: Long-Term Buy Zone in Focus Netflix shares have recently turned lower, moving towards our previously identified long-term entry zone between $96.27 and $75.19. Within this range, we expect the low of the turquoise wave 4 to form, setting the stage for the ongoing upward impulse in wave 5 to push past resistance at $134.11. In a new alternative scenario, there is a 30% probability that the beige wave alt.IV could establish a lower low below $81.27, though it would still remain within the long-term entry zone

BTC 15m Analysis — Falling Wedge Pattern📊 BTC 15m Analysis — Falling Wedge Pattern
Bitcoin is trading around $92,870 – $92,920 and forming a falling wedge, which is typically a bullish reversal pattern.
1️⃣ Support Zone
Support sits near $92,750 – $92,800.
Price has bounced from this area multiple times, showing buyers are active here.
2️⃣ Falling Wedge Structure
Lower highs and higher lows are squeezing price inside the wedge.
This usually indicates weakening selling pressure and potential breakout to the upside.
3️⃣ Breakout Conditions
A strong bullish move can form if BTC breaks above the wedge resistance, around:
👉 $93,000 – $93,100
A breakout and hold above this zone may trigger a push toward higher levels.
4️⃣ Bearish Risk
If price breaks below support at $92,750, the pattern invalidates and BTC may drop further.
Summary
Pattern: Falling wedge (bullish setup)
Support: $92,750
Resistance: $93,000 – $93,100
Watching for breakout above resistance or breakdown below support.

Neutral Price-Action Analysis (ETH/USD – 15M)📌 Neutral Price-Action Analysis (ETH/USD – 15M)
1. Double-Top Structure
The chart highlights a double-top pattern, formed by two peaks around the 3084–3087 area:
TOP 1: Price reached approximately 3084 before pulling back.
TOP 2: Price returned to the same region near 3087, creating the second high.
This shows that price struggled to break above this zone on two attempts.
2. Neckline Zone
The lower boundary of the pattern sits near the 3060–3065 area, where price previously found temporary support.
This level acts as the midpoint of the structure.
3. EMA Context
The EMA 7, 9, and 21 are closely stacked under price, showing short-term momentum earlier in the move.
ETH is currently trading just above these EMAs but showing hesitation near the double-top resistance.
The EMA 50 at approximately 3048 sits below as a deeper support reference.
4. Price Reaction
After touching the second top near 3087, the latest candles show rejection from this zone, indicating reduced strength as price interacts with resistance.
The red arrow on the chart simply illustrates a possible continuation idea based on the structure, not a signal.
5. Summary
ETH reached the 3084–3087 resistance area twice, forming a double-top pattern on the 15-minute chart. Price is now showing rejection from this zone while holding above the 3060–3065 neckline region, with the EMA 50 near 3048 acting as a broader support reference.

AMD — WEEK 49 TREND REPORT | 12/03/2025AMD — WEEK 49 TREND REPORT | 12/03/2025
Ticker: NASDAQ:AMD
Timeframe: WEEKLY
This is a reactive structural classification of AMD based on the weekly chart as of this timestamp. Price conditions are evaluated as they stand — nothing here is predictive or forward-assumptive.
⸻
1) Current Trend Condition [ Numbers to Watch ]
• Current Price @ 216$
• Trend Duration: +0 weeks (Bearish)
• Trend Reversal Level (Bullish): 230.68$
• Trend Reversal Level (Bearish Confirmation): 191.07$
• Pullback Support : 217.79$
• Correction Support : 179.09$
⸻
2) Structure Health
• Retracement Phase:
Correction (approaching 61.8%)
• Position Status:
Healthy (price above both structural layers)
⸻
3) Temperature :
Cooling Phase
⸻
4) Momentum :
Neutral
⸻
5) Market Sentiment
Bullish
⸻
Author’s Note
This analysis is fully reactive, not predictive. Market conditions, trend structure, and behavior are classified as they appear in real time. The objective is to identify where directional shifts first occurred, where structural integrity remains intact, and where it would begin to weaken if key levels were breached.
Predictive analysis projects outcomes that do not exist yet. Without price confirmation, prediction is built on baseless assumptions. This framework avoids that entirely by responding only to verified structural changes and live conditions.
The levels shown simply identify where the current trend structure first shifted and where it would begin to lose integrity if breached. Recognizing these boundaries allows for clearer interpretation of market behavior without relying on forward guarantees, speculative projections, or unsupported assumptions.
⸻
Methodology Overview
This classification framework evaluates directional conditions using internal trend-interpretation logic that references price behavior relative to its structural layers. These relationships are used to identify when price movement aligns with the framework’s criteria for directional phases, transition points, or regime shifts. Visual elements or structural labels reflect these internal interpretations, rather than explicit trading signals or preset indicator crossovers. This framework is observational only and does not imply future outcomes.

NVDA — WEEK 49 TREND REPORT | 12/03/2025NVDA — WEEK 49 TREND REPORT | 12/03/2025
Ticker: NASDAQ:NVDA
Timeframe: WEEKLY
This is a reactive structural classification of NVIDIA based on the weekly chart as of this timestamp. Price conditions are evaluated as they stand — nothing here is predictive or forward-assumptive.
⸻
1) Current Trend Condition [ Numbers to Watch ]
• Current Price @ 180.26$
• Trend Duration: +31 weeks (Bullish)
• Trend Reversal Level (Bullish): 190.87$
• Trend Reversal Level (Bearish Confirmation): 176.52$
• Pullback Support : 167.75$
• Correction Support : 132.86$
⸻
2) Structure Health
• Retracement Phase:
Pullback (approaching 78.6%)
• Position Status:
Caution (interacting with structural layers)
⸻
3) Temperature :
Cooling Phase
⸻
4) Momentum :
Coiling
⸻
5) Market Sentiment
Bullish
⸻
Author’s Note
This analysis is fully reactive, not predictive. Market conditions, trend structure, and behavior are classified as they appear in real time. The objective is to identify where directional shifts first occurred, where structural integrity remains intact, and where it would begin to weaken if key levels were breached.
Predictive analysis projects outcomes that do not exist yet. Without price confirmation, prediction is built on baseless assumptions. This framework avoids that entirely by responding only to verified structural changes and live conditions.
The levels shown simply identify where the current trend structure first shifted and where it would begin to lose integrity if breached. Recognizing these boundaries allows for clearer interpretation of market behavior without relying on forward guarantees, speculative projections, or unsupported assumptions.
⸻
Methodology Overview
This classification framework evaluates directional conditions using internal trend-interpretation logic that references price behavior relative to its structural layers. These relationships are used to identify when price movement aligns with the framework’s criteria for directional phases, transition points, or regime shifts. Visual elements or structural labels reflect these internal interpretations, rather than explicit trading signals or preset indicator crossovers. This framework is observational only and does not imply future outcomes.

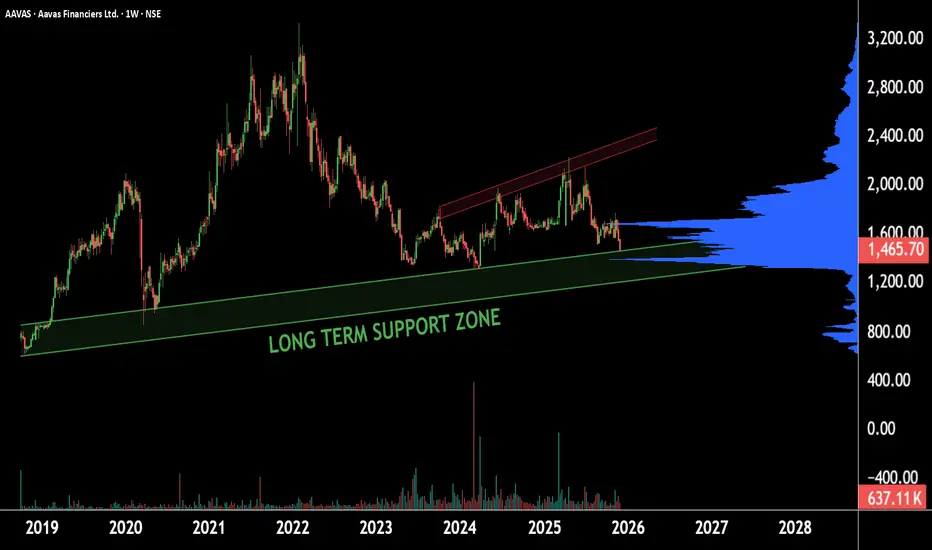
AAVAS: Hidden Gem Turning Into a MultibaggerThis is the weekly timeframe chart of AAVAS.
The stock is currently trending near its long-term support zone of ₹1400–₹1200.
The volume indicator also suggests significant accumulation around the ₹1350 range.
This zone acts as a major demand area, and the stock is likely to attempt a reversal from this region.
Thank you.
BTC 4H AnalysisBitcoin is at important resistance zone right now.
Once it break the level upward we might see new levels as drawn on chart.
NFA DYOR

Apple Stock Setup: Momentum and Patterns Point Toward New ATHA deep dive into Apple’s latest technical setup, analyzing MACD momentum, RSI strength, and emerging chart patterns that signal a potential breakout toward a new all-time high around $290.

S&P500: Futures Stuck in Tight Range S&P 500 futures traded mostly sideways yesterday, remaining confined within a tight range. In our primary scenario, however, we anticipate that magenta wave (4) will soon resume its downward move. During this phase, the index is expected to initially break below the support levels at 6540 and 6371 points. We then look for the final low of the wave (4) correction to occur within our green Long Target Zone between 6163 and 5912 points. Once this low is established, the subsequent wave (5) should propel prices above resistance at 6952, marking the peak of the broader blue wave (III). Immediately after, we expect the onset of magenta wave (1), which should kick off a significant corrective phase. However, if the index continues to fall below the Long Target Zone, our alternative scenario may come into play (probability: 31%). In that case, it would suggest that the alternative blue wave alt.(III) has already completed and the major correction is already in progress.

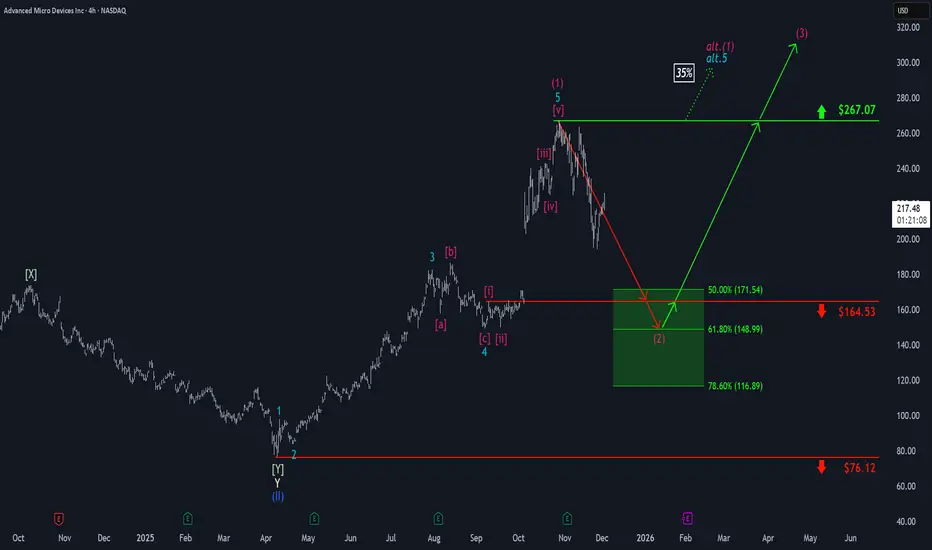
AMD: Short-Term Rebound Before Pullback?At AMD, a rebound has been taking shape recently. If this upward momentum continues in the near term and pushes price decisively above the $267.07 resistance level, we may have to expect a new high for the magenta wave alt.(1) (probability: 35%). However, our primary expectation is for the stock to soon turn lower and to move into our green Long Target Zone between $171.54 and $116.89. Following the low of the magenta wave (2) within this zone, the ongoing upward move should eventually break through the $267.07 resistance.
BTC/USD on the 15-minute timeframe Neutral Chart InterpretationNeutral Chart Interpretation
This chart shows BTC/USD on the 15-minute timeframe, using several Exponential Moving Averages (EMA 7, 21, 50, and 9). The main focus appears to be on potential support zones and how price might behave around them.
1. Current Price Area
The price is moving sideways near the EMAs.
Multiple EMAs are close together, showing a short-term consolidation phase.
2. First Support Zone (S1)
A grey box highlights a nearby support area just below the current price.
The chart suggests that if price dips into this zone, it may stabilize before attempting another upward move.
3. Second (Stronger) Support Zone
A wider support region is marked lower on the chart.
This level appears to act as a stronger cushion if the market experiences a deeper pullback.
4. Upward Scenario (Green Arrows)
The chart shows an illustrated potential path where the price could rebound from one of the support zones and continue moving upward.
These arrows simply represent possible movement — not a prediction or signal.
5. EMA50 Highlight
The EMA50 label suggests that this moving average is being watched as a dynamic support during pullbacks.
Safe Posting Notes
This explanation avoids giving trade signals or recommendations.
It sticks to neutral chart interpretation only: price levels, zones, and market structure.

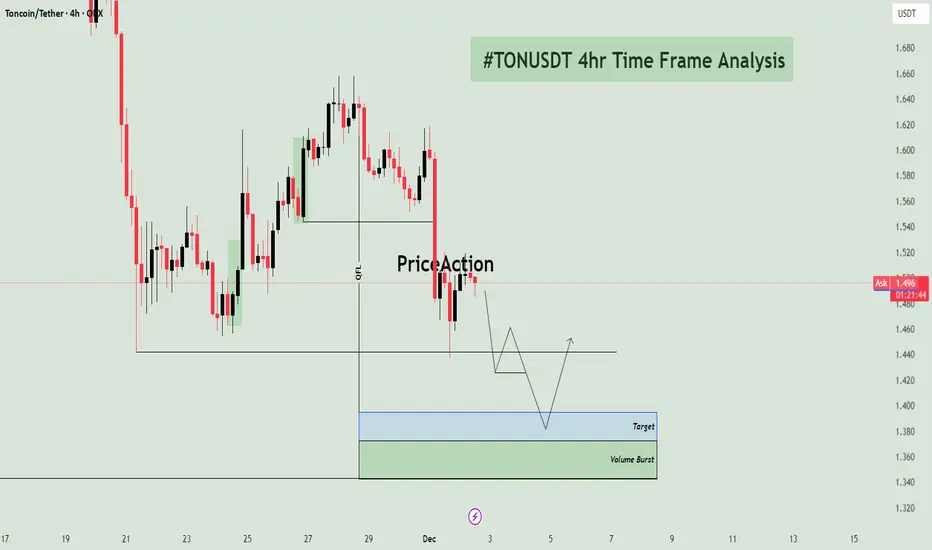
TONUSDT - Short Setup - Targeting Unmitigated Demand 📉 TON/USDT 4H: Anticipating Continuation Short Towards Unmitigated Demand
📝 Market Overview and Structural Context
The TON/USDT pair on the 4-hour chart is exhibiting a clear bearish structural shift. After a period of an attempt at a reversal (the recent small rally), the price has decisively broken below the most recent swing low, confirming that sellers are firmly in control.
The price is currently consolidating just below a key structural point and is expected to continue its descent toward a significant Demand Zone that was the origin of a previous move higher. The overall hypothesis is a short continuation trade, targeting this fresh demand zone.
🔑 Key Technical Zones and Order Flow
The analysis highlights the key structural break and the ultimate target zone:
1. Structural Break and Retest
Level: The swing low around 1.550 was recently breached.
Current Action: Price is now consolidating around the 1.480 - 1.500 area. The arrows on the chart suggest the expectation of a brief retest of the broken support level (around 1.460) before the bearish momentum continues.
2. Target and Volume Burst Zone (Demand) 🟢/🔵
Zone Location: This is the combined target area, spanning approximately 1.360 to 1.400.
Significance: This area is a high-quality Demand Zone, identified as the "Volume Burst" zone. This area was the origin of the last significant bullish momentum (likely a Drop-Base-Rally structure) that launched the previous swing high. It represents the first major unmitigated area where institutional buy orders are expected to be located.
The blue box, labeled "Target" (around 1.380 - 1.400), is the most immediate technical objective for the current short trade.
The lower green box, "Volume Burst" (around 1.360 - 1.380), marks the distal boundary of the demand zone, providing the ideal area for the final take-profit and potential reversal.
3. Order Flow Level (OFL)
Location: The price level around 1.560.
Significance: This marks the origin of the last structural high before the move down. The structural breakdown confirms the selling pressure from this point.
📊 Trading Hypothesis: Short Continuation
The trade plan anticipates a short continuation after a minor retest:
Trade Direction: Short (Sell)
Entry Strategy: The chart suggests waiting for a minor rally back toward the broken support level (around 1.460) to capture a more favorable entry price, minimizing risk. The short trade is initiated upon the rejection of this broken level.
Stop Loss (S/L): The Stop Loss should be placed safely above the recent swing high that failed to break the prior structure (e.g., above 1.560 or the most recent significant high).
Take Profit (T/P) 1: The Target (blue box) around 1.380 - 1.400.
Take Profit (T/P) 2: The distal boundary of the Volume Burst zone around 1.360, which represents the maximum expected extension of the current move before a significant bounce occurs.
⚠️ Risk Management and Invalidation
The risk lies in price reversing prematurely before reaching the target or failing to reject the retest level.
Invalidation: A decisive move and close above the OFL level (1.560) would indicate renewed bullish momentum and invalidate the bearish structural thesis.
CHF/USD 4H: High-Probability Reversal Play at Unmitigated Demand🚀 CHF/USD 4H: High-Probability Reversal Play at Unmitigated Demand Zone
📝 Market Overview and Structural Context
The CHF/USD pair has recently experienced a significant downward correction from a prior high (marked by the long vertical line). This bearish move effectively tested and breached minor support levels, indicating a strong influx of sellers in the short term.
The current price action is situated near a major unmitigated Demand Zone—the area responsible for initiating the last aggressive buying rally. The trading hypothesis focuses on the expectation that institutional buyers will defend this critical base, leading to a strong bullish reversal.
🔑 Key Technical Zones and Order Flow
The analysis highlights two main zones that form the basis of the long hypothesis:
1. Reversal Zone (Demand Entry) 🟢
Zone Location: The upper green shaded box, spanning approximately 1.23300 to 1.23500.
Significance: This is identified as the high-probability Demand Zone. It represents the area where price stalled and reversed aggressively, establishing the structure that led to the prior swing high (the Order Flow Origin). This zone contains a concentration of unexecuted buy orders, making it the ideal location for a bullish reversal to begin.
2. Volume Burst (Liquidity Sweep) 🟢
Zone Location: The lower green shaded box, extending down to approximately 1.23100.
Significance: This zone often acts as a Stop-Loss/Liquidity Pool. While the main entry is the "Reversal Zone," the "Volume Burst" area accounts for a potential liquidity sweep—a maneuver where price briefly dips below the main demand area to trigger stop losses before launching the intended move. Traders often place their absolute Stop Loss below this entire structure.
3. Order Flow (OF) / Target Origin
Location: The level where the strong initial impulse move started before the reversal.
Significance: This marks the last major structural high before the drop. A successful reversal from the Demand Zone would target this level (around 1.24800 to 1.25000) as the initial Take Profit area, confirming a shift back to bullish momentum.
📊 Trading Hypothesis: Buying the Demand
The trade plan is contingent on confirming demand in the entry zone:
Trade Direction: Long (Buy)
Entry Strategy : Entry is anticipated upon price entering the Reversal Zone (1.23300-1.23500). Traders should wait for a bullish confirmation pattern (e.g., a bullish engulfing candle or a clear rejection wick) on a lower timeframe (e.g., 1H or 30M) to validate the entry and refine the risk-to-reward ratio.
Stop Loss (S/L): The Stop Loss must be placed securely below the entire demand structure, safely below the Volume Burst zone (e.g., below 1.23000).
Take Profit (T/P) 1: The Order Flow (OF) / Target Origin area around 1.24800 to 1.25000.
Take Profit (T/P) 2 : Potential continuation to retest the recent swing high around 1.26800.
⚠️ Risk Management and Invalidation
The depth and aggressive nature of the preceding drop demand caution. The primary risk is that the current bearish pressure is strong enough to break the historical demand zone.
Invalidation: A decisive close below the Volume Burst area (e.g., below 1.23000) would completely invalidate this bullish setup, signaling a deeper structural break and the likely continuation of the bearish trend.

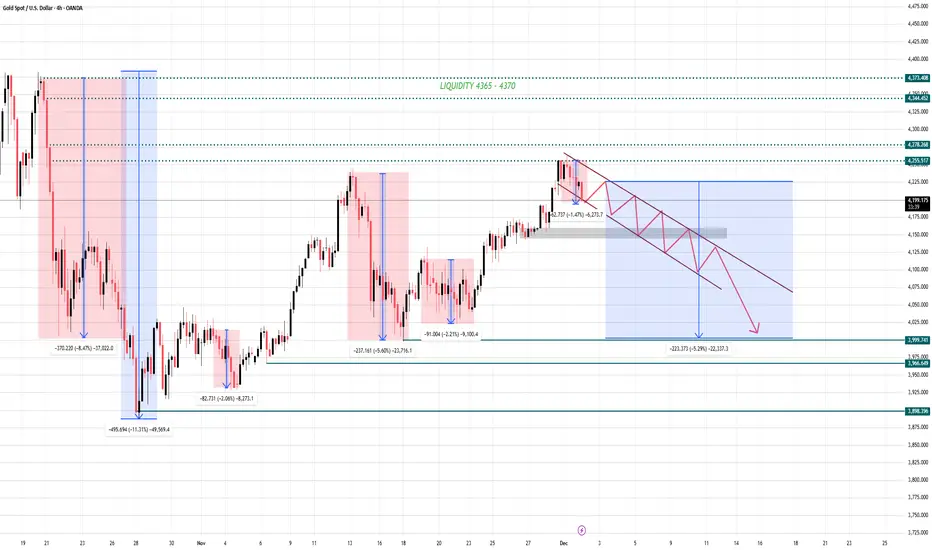
Gold Is Entering a Danger Zone—A Sharp Drop May Hit Before....📌 SETUP SIGNAL (GOLD – 4H)
Strategy: Sell the Downward Channel – Follow the Correction
1️⃣ Sell Setup
Entry: 4188–4175 (after a confirmed 4H close below 4188)
Stop-Loss: 4240
Take Profit:
TP1: 4120
TP2: 4050
Main Target: 4000–3990
Reason:
- Price is moving cleanly inside a descending correction channel.
- Repeated sell-offs + weak bullish reactions show sellers are still in control.
- Breaking 4188 confirms continuation toward the lower liquidity zone.
2️⃣ Alternative Scenario (Low Probability)
Bullish invalidation: Only if price breaks above 4280 (4H close).
→ Then the market may shift upward toward 4365–4370 liquidity.
📉 QUICK MARKET OUTLOOK – GOLD 4H (Rejection + Bearish Channel Forming)
Based on the current 4H structure, Gold is showing a clear pattern of repeating deep corrections every time it reaches major resistance/liquidity zones.
The latest price action continues to repeat this same behavior:
Key Observations
- Price has once again rejected strongly from the 4270–4280 zone (same rejection region as previous drops).
- A descending bearish channel is forming → indicating controlled distribution.
- The recent downward legs are consistent with past moves:
-8.47%, -11.31%, -5.60%, -2.21% → the market has a clear history of sharp sell-offs.
- Current structure suggests a continuing corrective wave until deeper support.
📌 Bearish Scenario (High Probability)
Price continues moving inside the descending channel and breaks the short-term support.
Targets → 4120 → 4050 → 4000
Major liquidity & demand zone sits at 3990 – 3980
→ where large buyers historically step in.
If panic selling accelerates, price may extend toward: → 3888 – 3900
📌 Bullish Scenario (Low Probability)
Only activated if Gold breaks OUTSIDE the descending channel and reclaims: → 4280
This invalidates the bearish outlook and reopens the path to 4365 – 4370 liquidity.
🎯 FINAL CONCLUSION
Gold is currently in a corrective downtrend, moving exactly within a well-defined bearish channel.
Unless buyers break the structure, the market is likely heading for deeper retracement toward the 4000 zone before any meaningful bullish continuation.
"Stay patient. Stay disciplined. Let the market come to your levels."