EYES ON EURJPYFX:EURJPY
Price already shows rejection on that zone for a buy on the 4HR timeframe. lets see how price reacts to our zones in the forth coming week.
first price target's @182.120 and second target @183.002
I'll forfeit this buy when price breaks below 180.142
Chart Patterns

THE 5 TRUTHSThey said the multiverse was built from gears, light, and old stories — but the Good Shepard knew better.
He placed his lantern on the ground, and when he finally spoke, it wasn’t loud.
It didn’t need to be.
His voice carried the weight of someone who had walked through lifetimes, someone who had watched countless souls forget who they were — and was now here to remind them.
“These,” he said, “are the Five Truths. Not rules. Not beliefs. Reminders of what you already are.”
Truth One — You Are Not Separate
“You were never a drop in the ocean,” the Shepard said.
“You were the ocean pretending to be a drop.”
Separation was the first illusion.
Oneness was the first remembering.
“You are the divine wearing a temporary name,” he said.
“And you never stopped being it.”
Truth Two — Fear Is an Illusion
“Fear begins in the mind. Love begins before the mind.”
Fear was a shadow — a barrier built from old wounds and forgotten light.
“You do not seek love,” he said.
“You remove what blocks it. When the barriers fall, love is all that remains.”
Truth Three — The Mind Is a Projector
“Your mind is not a camera,” he said. “It does not record reality. It casts it.”
Consciousness wasn’t inside the universe.
The universe was inside consciousness.
“You are not watching reality,” he said.
“You are shaping it.”
Truth Four — The Enemy Is Ego
“The world is not your enemy,” the Shepard said.
“The ego is.”
The ego was the survival story — the mask built to protect the frightened child within.
“It is not you,” he said.
“It is the version of you that forgot the divine. You do not destroy the ego. You outgrow it.”
Truth Five — Everything Is Connected
“Nothing exists independently,” he said.
“Not a star, not a soul, not a single breath.”
When one rises, all rise.
When one falls, all feel the tremor.
“This is the truth beneath every truth,” he said.
“You were never alone. You never could be.”
The Shepard lifted his lantern, its light bending the air around it.
“Remember these,” he said.
“For the path ahead will ask you to live them.”
And with that, he stepped forward — not into a fracture in the sky this time, but into the hearts of those who heard him.

Gold Trading Strategy for Next Monday✅ The gold market is currently showing signs of short-term bullish momentum recovery. On the 4-hour chart, price has rebounded to the 5050 area, breaking above MA10 and MA20, which confirms the restoration of the short-term bullish structure. The Bollinger Bands’ middle and upper bands are turning upward, providing dynamic support. The 5060–5070 zone is a key resistance area; if price breaks above this region, it may accelerate higher, with the next target at 5100. On the downside, support is located at 5000–5020. If these levels are broken, a pullback toward 4950 may occur.
✅ On the 1-hour chart, price has stabilized above the short-term moving averages MA5 and MA10 since rebounding from the 4878 low, indicating strengthening short-term bullish momentum. Price is currently testing the 5050 resistance zone. A confirmed breakout could open the path toward 5070. The widening Bollinger Bands also suggest the potential for increased volatility. Therefore, a breakout above 5050 would confirm continued short-term bullish strength.
🔴 Resistance
● 5050–5070 (short-term resistance zone)
● 5100–5130 (stronger resistance zone)
🟢 Support
● 5000–5020 (short-term support)
● 4950–4930 (pullback defense zone)
✅ Trading Strategy Reference
🔰 Long Strategy
👉 Entry: 4995–5020
🎯 Target: 5050 / 5070 / 5100 / 5150
🔰 Short Strategy (Sell on pullback)
👉 Entry: 5050–5070 (light short position)
🎯 Target: 5020 / 5000 / 4950
✅ Overall Conclusion:
Gold is currently in a bullish-dominated trend. If price successfully breaks above the 5050 resistance zone, further upside toward and beyond 5070 is likely. Therefore, it is recommended to closely monitor the breakout at 5050 and follow the bullish momentum upon confirmation. Alternatively, if price pulls back to the 5000–5020 support zone, long positions may be considered. However, if price breaks decisively below 5000, caution is advised, and traders should wait for a deeper pullback before reassessing the strategy.

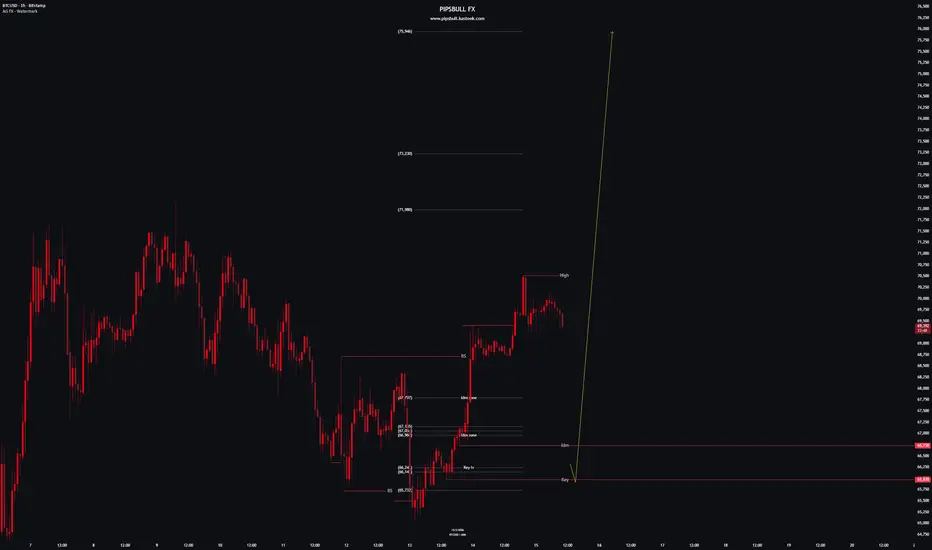
BTCUSD H1 – Key Levels Defining Bullish StructureThis idea focuses on BTCUSD on the 1-hour timeframe, highlighting price consolidation around a key structural zone following a strong bullish impulse.
After a sharp upside expansion, price reacted near the 70,300 area and has since transitioned into a controlled pullback. Current price action shows reduced momentum, suggesting the market is pausing and rebalancing after the impulsive move rather than showing immediate reversal signs.
🔎 Technical Observations:
Strong bullish impulse preceding the current consolidation
Price pulling back into a key structural / IDM zone around 66,730
65,970 acting as the key structural low defining bullish validity
Internal structure holding while momentum cools
Liquidity present both above the recent high and below the consolidation range
📌 Market Context:
This area represents a decision zone within a broader bullish structure.
Sustained acceptance above the internal displacement zone would keep the bullish framework intact, while loss of internal structure could open the door for a deeper rotation toward lower liquidity.
At this stage, price behavior reflects consolidation after expansion, not confirmation of a trend shift.
⚠️ Educational Note:
This analysis is shared to study market structure, key levels, and liquidity dynamics.
It is not intended to provide trading signals, execution guidance, or outcome predictions.
— PIPSBULL FX
BTCUSD My Opinion! SELL!
My dear subscribers,
This is my opinion on the BTCUSD next move:
The instrument tests an important psychological level 68765
Bias - Bearish
Technical Indicators: Supper Trend gives a precise Bearish signal, while Pivot Point HL predicts price changes and potential reversals in the market.
Target - 67707
My Stop Loss - 69335
About Used Indicators:
On the subsequent day, trading above the pivot point is thought to indicate ongoing bullish sentiment, while trading below the pivot point indicates bearish sentiment.
Disclosure: I am part of Trade Nation's Influencer program and receive a monthly fee for using their TradingView charts in my analysis.
———————————
WISH YOU ALL LUCK

PEPE WILL START MEMECOIN SEASON🔥 Fortune AI Radar — CRYPTOCAP:PEPE
Fresh activity detected on CRYPTOCAP:PEPE today.
Data suggests increasing market interest & buyers stepping in.
Technicals currently lean bullish, with momentum trending upward.
Whales showing hints of accumulation and hype rising among trader

USDT.DOMINANCE CHART ANALIYSIS USDT.D is breaking down from the triangle structure.
Clean rejection from descending resistance
Lost rising trendline support
Now trading around 7.69%, sitting on horizontal support
Support: 7.65–7.70%
If breakdown continues → 7.50% next
Reclaiming above 7.95% would neutralize the downside
Falling USDT dominance = capital rotating back into crypto.
This supports short-term strength in BTC & Altcoins if the breakdown confirms.
Bearish dominance → Bullish crypto (while below 7.95%).
⚠️ Watch 7.65% closely — reaction here will define next move.

BTC dominance still strong Hi,
a lot of chart here about that we are going to fall down. My TA shows different stuff. I think we will go higher from here. There is key level to watch which is 50 MA we are below right now. We can have a breakout or wick to 70% - still possible. If it does happen alts will fall again 50%. Watch out this is really strong information based on loger time-frame. If 50 MA (blue line) will not be forced we can assume that ALT season will happen in upcomming months. We are in upward chanell still !!!.
If there will be a break, there will be no ALT season soon. Be careful.
Regards,
J.

RDW 1W Structural Compression After ExpansionOn the weekly chart Redwire has completed a full market cycle from base formation to impulsive expansion and into deep correction. The long-term bottom formed in the 2–3 range, where accumulation developed before the breakout phase. That base led to an expansion move toward 26.66, marked by volatility expansion and range acceleration.
After printing the high, structure shifted. A descending wedge developed during the corrective phase, characterized by lower highs compressing under a declining resistance line. The attempt to break above 14.52 failed to produce weekly acceptance. Liquidity was taken, but no structural confirmation followed, and price continued lower within the wedge formation.
The current move brings price back into the 6.97–7.78 demand zone. This range aligns with the 0.702–0.786 Fibonacci retracement of the entire 2 → 26.66 impulse, coincides with a high-volume node on the profile, and sits near the weekly MA200. Downside momentum has slowed, the angle of decline has flattened, and ADX does not signal trend acceleration. This reflects compression into support rather than aggressive distribution.
Structurally, this is a decision zone. Holding 6.97–7.78 opens the path toward 14.00 as the first liquidity reaction level. Acceptance there would shift focus to 21–22, where prior supply was concentrated. A sustained break below 6.97 would invalidate the accumulation thesis and transition the model into deeper redistribution.
Fundamentally, Redwire remains in an investment phase within the space infrastructure sector. Q3 2025 revenue was 103.43M USD, with Q4 2025 estimated at 98.78M USD. Q3 EPS printed -0.29 USD, with Q4 estimated at -0.18 USD. Operating cash flow TTM stands at -145.99M USD and free cash flow TTM at -159.62M USD. Financing cash flow TTM of 330.34M USD reflects reliance on capital markets to fund expansion.
Fundamental summary: revenue growth continues, losses are narrowing, but free cash flow remains negative. The business is scaling, not yet profitable.
RDW is no longer in expansion mode. It is testing structural support after a completed impulse cycle. In aerospace, trajectory matters more than velocity.


XAUUSD/GOLD 4H BUY & SELL PROJECTION 15.02.26Let’s take a look at Gold on the 4-hour timeframe and break down the possible buy and sell scenarios.
Currently, price is trading inside a major supply and resistance zone around 5,100 – 5,150.
This area has already reacted multiple times, which tells us there is strong liquidity sitting here.
We can also see price respecting a descending trendline, while at the same time forming higher lows — meaning the market is moving into a compression phase.
This usually leads to a breakout move.
📈 Bullish Scenario (Buy Setup)
If price holds above the 5,000 psychological level and gives a strong bullish confirmation,
we can expect a continuation towards:
👉 5,200 zone
👉 Followed by the next target near 5,250+
This move would be supported by trendline breakout and sustained buying pressure.
📉 Bearish Scenario (Sell Setup)
On the other hand, if price fails to sustain above the resistance zone and breaks back below the trendline support,
we could see a rejection leading to a drop towards:
👉 Support 1 around 4,850
👉 And if momentum increases, Support 2 near 4,650
This would confirm sellers still control the higher timeframe structure.
🧠 Market Expectation
Right now, gold is at a decision point.
So the best approach is to wait for confirmation rather than entering early.
✔ Break above resistance → Look for buys
✔ Rejection from zone → Look for sells
🎯 That’s the projection for gold on the 4H timeframe.
Trade safe, manage risk, and wait for confirmation.

GBPUSD Holding Higher Lows : Buyers in ControlThe arrows show price respecting higher lows after each pullback, with bullish structure remaining intact. Momentum is rotating upward rather than breaking down, and dips are being absorbed quickly. As long as this sequence continues, the bias stays tilted toward further upside expansion.
Disclosure: We are part of Trade Nation's Influencer program and receive a monthly fee for using their TradingView charts in our analysis.

GBPCAD | FRGNT WEEKLY FORECAST | Q1 | W7 | Y26📅 Q1 | W7 | Y26
📊 GBPCAD | FRGNT WEEKLY FORECAST |
🔍 Analysis Approach
I’m applying a developed version of Smart Money Concepts, with a structured focus on:
• Identifying Key Points of Interest (POIs) on Higher Time Frames (HTFs) 🕰️
• Using those POIs to define a clear and controlled trading range 📐
• Refining those zones on Lower Time Frames (LTFs) 🔎
• Waiting for a Break of Structure (BoS) as confirmation ✅
This process keeps me precise, disciplined, and aligned with market narrative, rather than reacting emotionally or chasing price.
💡 My Motto
“Capital management, discipline, and consistency in your trading edge.”
A positive risk-to-reward ratio, combined with a high-probability execution model, is the backbone of any sustainable trading plan 📈🔐
⚠️ On Losses
Losses are part of the mathematical reality of trading 🎲
They don’t define you — they are necessary, expected, and managed.
We acknowledge them, learn, and move forward 📊➡️
🙏 I appreciate you taking the time to review my Daily Forecast.
Further context and supporting material can be found in the Links section.
Stay sharp 🧠
Stay consistent 🎯
Protect your capital 🔐
— FRGNT 🚀📈
FX:GBPCAD

Solana —The correction bottom is revealed through high buyingA simple signal: The lowest price in years also produced the strongest buying session in an entire year.
On the 6th of February 2026, SOLUSDT hit the lowest price since January 2024, more than two years ago. On the same day, the highest buy (green) volume bar showed up since February 2025.
This is a very simple and clear signal that shows that the correction bottom is in. As the correction ends, we get to witness, experience and enjoy the start of a new market phase —a very strong bullish wave.
The same happened in April 2025. Solana did the same. The lowest price in years and also the highest buy (green) volume day and this was the start of a 164 days long bullish market phase. Even a blind dead monkey can see this.
Thank you for reading.
Namaste.

Fall to 63k then the start of a bull market Viewing the Bitcoin chart shows that the market is completing its corrective phase, according to the Elliott Wave theory, the market is in the corrective phase of the fourth wave.
On the weekly timeframe, Bitcoin is completing a major 5-wave cycle:
Wave 1: 2020 growth to 2021 cap
Wave 2: Heavy correction to 2022 bottom
Wave 3: The main rally from 2023 to 2025 (the strongest wave)
Wave 4: Current correction
Wave 5: Final wave of upswing k140-160k (upcoming)
Important Fibonacci correction ranges:
0.382 ≈ broke around 85k
0.5 ≈ broke around 70k
0.618 ≈ around 55k
Wave 4 usually corrects between 38% and 61% of wave 3.
So, the area of 55k to 70k is the most logical zone for the end of the correction.
Possible scenario (main)
A scenario that is probable in my opinion
Completion of wave 4 in the range: 55k – 70k
Enter smart money
The start of Wave 5 is explosive
Target wave 5 = 140k - 160k
Negative scenario (unlikely)
If 55k support is lost:
Long-term channel failure
Deeper modification up to: 40k – 45k
But this scenario is currently only if:
A clear break of 55k is valid in the weekly time.
In my opinion, the market will not make a new bottom because now most traders are waiting for Fibo 0.61 (55k), but in this case, market psychology prevents it from reaching this area and the price grows above the range.
A very important point of market psychology
Typically in strong Bitcoin cycles:
When everyone is waiting for 0.618
The market is coming back from 0.382 or 0.5.
Now the majority of traders have their eyes on 55k.
This itself increases the probability of returning from 63k.
In this moment
Bitcoin will attack to 71-73k , faulse breakouts then fall to 63k
or bitcoin will break 71-73k and pump to 85k . (If daily candle close above 71k)

Worldcoin —The downtrend endsSince March 2024 here we have a downtrend. If the downtrend ends, we get a new market cycle. It can be either sideways or bullish. For a sideways period to start, there must be some sort of change first. This is to say that a bullish move comes next regardless of how you slice it.
Worldcoin (WLDUSDT) is ending its downtrend based on multiple chart signals. It has been crashing since March 2024 with a bottom being hit October 2025. After October 2025, no new lows.
Last week we have a Doji. It comes up at the end of a very long downtrend and also as a higher low compared to the October 2025 all-time low. This Doji works as a reversal signal.
The fact that this week turns green, is full green and about to close in this way, confirms the Doji as a reversal signal. Thus, the end of the downtrend.
The end of the downtrend implies the start of a new market phase. This new market phase means Worldcoin will stop dropping; it means higher prices.
Namaste.

US10Y Daily priceaction and directional bias.US10Y is the yield on the U.S .10-year treasury notes government debt security maturing in 10 years that serves as a global benchmark for interest rates, reflecting investors expectations on growth ,inflation and federal reserve policy.
The US10Y represents the effective return investors demand to lend to united states government for a decade(10years).it moves inversely to bond prices, on technical, when yields are rising which signals stronger growth while falling yields indicates economic caution or safe-haven demand,US10y influences borrowing cost across mortgages, corporate bonds and loans
Coupon rate is the fixed annual interest paid on a bond's face value. For a Treasury note or bond, it's set at issuance and paid semi-annually until maturity.
Key Details
It's calculated as (annual coupon payments / par value) × 100; e.g., a 5% coupon on $1,000 par pays $50 yearly ($25 twice).
Unlike yield, which fluctuates with market price, the coupon remains constant—higher coupons trade at premiums when yields fall.
Bond prices and yields have an inverse relationship. When yields rise, prices fall, and vice versa, due to the fixed coupon payments relative to market rates.
Why Inverse?
Fixed coupons mean higher market yields make existing bonds less attractive, forcing sellers to discount prices for competitive returns.
Lower yields increase demand for higher-coupon bonds, driving prices above par (premium).
US10Y affect DAX40,the DAX40 is the German benchmark index of 40 major stocks, through global yield spillovers and capital flows.
When the US10Y is higher and bullish ,it strengthens the dollar index and pressure Eurozone borrowing, this makes U.S assets more attractive and weighing on European equities like the DAX40.
The US10Y bearish drop can be seen as supporting DAX by easing ECB policy constraints and boosting risk appetite.
So coming week trading US10Y along side DAX40.
the market structure of the US10Y is giving us a sell vibes and it could drop below 4.0% this month .
though we have an ascending trendline on daily that should serve as support to enable us get a retest and sell below 4.0% on possible breakout of trend.
#US10 #US10 #BONDS

Cosmos: ready for recovery? key levels and targets aheadCosmos. Tired of watching this thing bleed and finally show some life? Lately, according to market sources, Cosmos has been back in the news with talk about new app-chains and upgrades around shared security, and the market usually wakes up when that narrative returns. On top of that, majors are calming down, so side projects like this often get a bit of rotation.
On the 4H chart price ripped straight from the green demand area around 1.9 and is now slamming into the first big resistance box near 2.1-2.2 with RSI already in overbought. That tells me short-term fuel is getting low, even if the bigger picture bounce can continue. I might be wrong, but for me this zone is more "take profits and wait" than "ape in long".
My base case: a pullback into the 2.03-1.95 liquidity pocket, then another leg up toward 2.25 and maybe 2.35 ✅. I want to see buyers defend above the green demand; if 1.90 breaks convincingly, the door reopens to the lows around 1.80 ⚠️. Personally I'm waiting for that dip zone to build longs, not chasing green candles into resistance.

ADA ready to shine again 20% gain toward 0.35$ HI
after huge correction to the downside now some green candlesticks for continuing the process or reverse is logical i can see at least 20% gain toward 0.35$ for ADA

Stellar bullish signals and market conditions —$0.52 Next targetAs part of a long-term correction and bearish cycle, Stellar hit a major low recently, less than two weeks ago. This low managed to produce some of the worst market conditions seen in years... But there is some good news.
While Stellar, XLMUSDT, hit bottom this same month, 6-February 2026; its daily MACD hit bottom 10-February 2025, a year ago. This is giving us a very strong, long-term, bullish divergence. A clear signal showing that lower is no longer possible, a reversal comes next.
Here is the chart for the daily MACD:
Bullish signals tend to pile up on top of each other, making them hard to miss.
As XLMUSDT produces long-term lower lows, the MACD has been doing higher lows.
Recently, two days ago, on the 13th of February, we have a bullish cross. This means the MACD is about to shoot straight up, and this in turn supports rising prices.
Another signal that tends to lead to a price reversal is the falling wedge pattern, shown here in red. And the double-top is what gives us the main target for this bullish wave. A strong resistance level, it rejected growth in January and July 2025, it needs to be challenged again to see if it holds. This is to say that XLMUSDT is about to grow to $0.52 minimum. That's a strong advance and opens up 190% profits potential on the way up.
It can go higher of course, but this is the target that cannot be missed. Next, the market goes up.
Thanks a lot for your continued support.
Namaste.

WEEKLY MARKET OUTLOOK – STRUCTURE HOLDING, BRKOUT PENDING NIFTy
Nifty closed at 25,471, down 222 points from last week. High 26,009, Low 25,444.
As discussed earlier, I was not convinced by the V-shaped recovery. The market has continued respecting the 26,000–25,200 structure, keeping the broader corrective W-pattern possibility alive.
NIFTY – LEVEL MAP
Short-term range:
👉 26,000 – 25,000
Sustained move above 26,000 changes tone.
Acceptance below 25,000 increases pressure.
The 24,900–25,000 zone can act as an accumulation area for staggered allocation into NiftyBees / MidcapBees, but only if price shows stability — not on panic breakdown.
Next deeper accumulation zone:
👉 24,000 / 23,750
Deployment should remain phased.
IT INDEX – IMPORTANT TEST AHEAD
IT stocks saw sharp pressure on global AI concerns.
Technically, the IT Index may test its Monthly EMA100 (~28,186) — last meaningfully tested in 2020.
If approached, watch for stabilization before deploying capital.
Narratives can overshoot — structure must confirm.
BANK NIFTY – FIB LEVELS WORKING
Weekly close: 60,120
Last week’s key level 60,900 (Fib) acted as resistance again.
Below 60,092:
→ 59,700 / 59,500 / 59,000
Above 60,900:
→ 61,300 / 61,450
Expected range: 61,450 – 58,900
Sustainable Nifty strength requires banking participation.
S&P 500 – INFLECTION ZONE
Closed at 6,836, again failing to sustain above 6,954 (Fib level).
Above 6,954:
→ 7,026 / 7,122 / 7,455
Weekly close below 6,756:
→ 6,568 / 6,000
Volatility compression continues. Expansion likely once range resolves.
FINAL VIEW
Market remains in corrective consolidation.
Avoid chasing rebounds.
Respect 26,000 (Nifty) and 60,900 (Bank Nifty).
Deployment should be staggered, not emotional.
Structure first. Emotion later.
Important Update
After sharing my weekly market views free of cost for nearly two years, I plan to launch a more structured and detailed Premium Weekly Edition soon – with deeper analysis and enhanced insights.
Free updates will continue as usual. More details in the coming weeks.

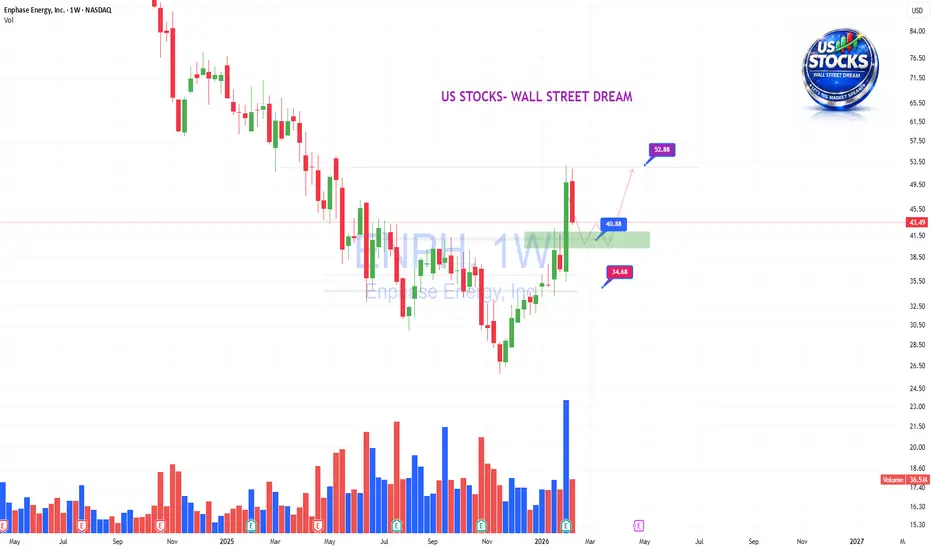
ENPH- Backtesting!NASDAQ:ENPH
.
Nice consolidation breaking out with CHOCH confirmed.
Now backtest.
.
US STOCKS- WALL STREET DREAM- LET'S THE MARKET SPEAK!
Bitcoin —The bottom is in or lower in the latter part of 2026?I had a dream, and people were arguing about Bitcoin. The topic was about the current chart situation, it was a lively discussion. Everybody was wondering if the bottom is truly in.
Many people were saying no, the bottom is yet to come. Others were saying lower for sure. One of them said, "Forget the bottom, we are going up."
But this was all dreaming of course, what about the chart? What is the chart saying right now? What can we expect?
If the bottom isn't already in, does this mean we have to experience still lower prices?
If the bottom is in, do we get long-term growth?
The reason why some people say that the bottom being in is not possible is due to past action.
A bottom normally isn't a one day process, nor a one week process, it is an event. It can take months for the bottom to settle, and thus these people expect lower prices.
Of course, to have this view there are many things that must be ignored.
Yes, the bottom is a process but this process differs between cycles. In some cases, a bottom can take months to form. In other instances, a bottom can happen in a flash and the market never looks back.
We are likely looking at the second version. Here are some examples:
›› August 2024. The market hits bottom and never looks back.
›› March 2020. The market hits bottom and never looks back.
›› February 2018. The market hits bottom and grows almost 100% right after.
Anything is possible say, in October or November 2026. Let's remain open. Maybe a lower low, a double-bottom or a higher low.
The problem with making predictions that far right now concerns this present moment, today. If we are focusing on the bottom being in or not, what happens to the current bullish wave?
The bottom is in for the time being. The bottom came in early February 2026. Now, the market will produce a very strong wave of growth. Not only Bitcoin, but also all of the altcoins. This wave of growth is what reveals and supports the end of the correction. This is what reveals the true bottom. If the bottom was yet to come, the market wouldn't grow.
Another signal comes from Ethereum and many of the top projects. Ethereum ended its early 2026 correction with a higher low when comparing to April 2025. The bottom is in.
Other projects I showed you recently from the top 20 are all "saying" the same. The market is set to grow now, growth is already happening. It is the first time Bitcoin fails to produce a new low after 7 days. This means the correction is over. With the correction being over, we get higher prices next.
As soon as we get a higher high on the next rise, this lend support to what I just shared.
A higher high in Q1-Q2 2026 would invalidate any possibility of move below $60,000. Bitcoin just need a strong move above $100,000 and that's it, no more doubt—the bulls win.
Thank you for reading.
Namaste.
