They’re Pumping Markets While You Can’t Afford GroceriesThe Biggest Market Lie in History: Record Highs While the Economy Breaks!
Record Highs… Built on What?
On the surface, everything looks strong.
The S&P 500 and Nasdaq Composite are pushing to record highs, flashing confidence, resilience—even optimism.
But beneath that surface, the reality tells a very different story.
growth is slowing
inflation pressures persist
private credit stress is building
global outlooks are being revised lower
And most importantly:
👉 everyday people are feeling the strain.
The Economy People Actually Live In
While markets celebrate, many households are facing:
rising grocery bills
higher fuel costs
increasing medical expenses
shrinking purchasing power
For a growing number of people, basic necessities are becoming harder to afford.
This is not a booming economy.
This is closer to what many would describe as Stagflation—
where prices rise but economic strength does not keep up.
The Illusion of Strength
Modern markets are no longer pure reflections of the economy.
They are shaped by:
massive institutional flows
derivatives positioning
passive investing
algorithmic trading
headline-driven reactions
This creates a dangerous illusion:
👉 Rising markets = healthy economy
But that equation is increasingly false.
Price vs Reality: The Disconnect Is Growing
Companies tied directly to real-world costs are already signaling stress.
Industries exposed to Crude Oil volatility—like airlines—are warning about rising costs and tighter margins.
They are preparing for pressure.
Yet equity markets continue higher as if those warnings don’t matter.
No Relief in Sight
Adding to the pressure:
inflation risks remain elevated
interest rates are still high
expectations for rate cuts remain uncertain
Many analysts now see no clear path to meaningful rate cuts in 2026 if inflation remains sticky.
That creates a difficult environment:
👉 high costs + high rates + slowing growth
The Role of Liquidity and Positioning
So what is driving the rally?
Not fundamentals—but structure:
funds chasing momentum
short squeezes forcing buying
options markets amplifying upside moves
passive inflows lifting indices regardless of valuation
This creates a melt-up—a rise driven by positioning, not strength.
When Headlines Move Markets More Than Reality
Markets now react instantly to:
political statements
geopolitical headlines
policy expectations
Prices move before facts are confirmed.
Narratives move markets faster than reality.
Valuations Detached From Fundamentals
The Shiller P/E Ratio remains near historically elevated levels.
That signals one thing:
👉 expectations are stretched
And stretched expectations are fragile.
Two Economies, One System
Right now, there are effectively two economies:
1. The market economy
record highs
strong momentum
optimism driven by liquidity
2. The real economy
rising living costs
financial strain on households
slowing growth
These two realities are diverging.
And that divergence cannot last forever.
Conclusion: The Illusion vs Reality
Markets can rise on momentum.
They can rise on positioning.
They can rise on narrative.
But they cannot ignore reality indefinitely.
Because while indices hit record highs—
👉 people are struggling to afford basic needs
👉 costs continue rising
👉 economic pressure is building beneath the surface
And when that reality finally forces its way into price.
the adjustment will not be gradual.
It will be sudden.
Because the bigger the illusion…
👉 the more violent the return to reality.
Crashincoming
The Market Rallied on Fantasy While Wall Street Masks the Truth
“The Market Illusion: Political Headline Games, Oil Reality, and the Rally That Defies Fundamentals”
Stocks Soar. Reality Deteriorates.
The S&P 500 and Nasdaq Composite sit near highs as if nothing is wrong.
But beneath the surface:
global GDP is being revised lower
recession risk is rising
private credit stress is worsening
inflation risks remain elevated
energy supply risks remain unresolved
And now an even louder warning has emerged:
👉 Major airlines are beginning to price in the energy shock the stock market still appears to ignore.
Airlines Are Pricing Reality. Wall Street Is Pricing Fantasy.
Three major U.S. airlines have slashed outlooks and reportedly warned of billions in additional fuel costs, with some guidance cuts near 50%.
Read that again.
Businesses that consume enormous amounts of fuel are preparing for a radically different cost environment.
They are not trading headlines.
They are pricing reality.
And that reality says:
Energy risk is rising.
While equity markets celebrate.
That disconnect is staggering.
If Airlines See It, Why Doesn’t the Market?
Airlines live and die by Crude Oil.
They cannot pretend paper barrels solve physical shortages.
They cannot ignore supply disruptions.
They cannot trade narratives.
They pay the real price.
And they are warning investors.
Which raises a brutal question:
👉 Why are operating companies pricing energy stress while equity indices act as if no shock exists?
The Oil Market Distortion
Critics argue this is where the illusion becomes obvious.
Despite geopolitical risk and supply concerns, oil repeatedly struggles near key levels.
Why?
Many point to massive paper positioning overwhelming physical signals.
Whether one calls that suppression or distortion, one fact remains:
👉 paper contracts do not replace physical supply.
And when physical shortages dominate pricing, derivatives cannot hide it forever.
Meanwhile Markets Keep Chasing a Headline Rally
A repeated pattern has emerged:
Political optimism headline
Stocks rip higher
Oil pressure eases temporarily
Contradictions emerge later
Markets move on as if nothing happened
This is not ordinary price discovery.
This increasingly looks like a market levitating on narrative.
The Warning Signs Keep Multiplying
While indices celebrate:
the Shiller P/E Ratio sits near historically extreme levels
growth is slowing
private credit cracks are widening
some Nasdaq firms face securities litigation
unusual trading activity around major announcements has drawn scrutiny
And now corporations exposed directly to fuel costs are effectively saying:
We see a shock coming.
That may be the clearest signal of all.
Companies Are Hedging for Pain While Investors Chase Momentum
This may be the most dangerous divergence in the market today.
Corporations are preparing for:
higher energy costs
weaker margins
slower growth
Meanwhile index buyers chase record highs.
One side is pricing cash flow risk.
The other is pricing euphoria.
Both cannot be right forever.
A Rally Built on Exit Liquidity?
Skeptics increasingly ask whether this melt-up resembles something darker:
A late-stage liquidity chase where higher prices pull in buyers…
while larger players quietly distribute risk.
Call it momentum.
Call it structural distortion.
But many call it something simpler:
👉 a trap.
Reality Usually Wins
Markets can ignore contradictions.
For a while.
They can ignore:
fuel shocks
valuation extremes
slowing growth
geopolitical instability
Until they can’t.
And when repricing comes, it tends not to be polite.
It tends to be violent.
Conclusion: The Market May Be Ignoring the Companies Living the Truth
This may be the most important signal investors are missing:
The companies consuming the fuel…
are warning.
The market speculating on the fuel…
is not.
That gap may define what comes next.
Because if airlines are already pricing billions in added fuel costs—
while equities celebrate all-time highs—
then someone is mispricing reality.
And history suggests it is usually the crowd.
The Market Feels Like a Video Game:A Rally Detached From RealityThe Market Feels Like a Video Game: A Rally Detached From Reality as an Oil Cliff Approaches”
A Rally That Doesn’t Match the World We’re Living In
Stocks are climbing. Indices like the Nasdaq Composite and S&P 500 continue to push higher, almost as if nothing in the real world has changed.
But outside the charts:
War tensions remain elevated
Global growth is being revised lower
Inflation risks are rising again
Energy supply chains are under pressure
It creates a surreal feeling—like watching a video game, where the score keeps going up no matter what’s happening in the background.
The Illusion of Price
Modern markets are increasingly driven by:
liquidity flows
algorithmic trading
derivatives positioning
expectations of central banks
In this system, price doesn’t always reflect current reality—it reflects what market participants believe will happen next.
That’s why markets can rally in the face of worsening conditions. The game is not about what is, but about what might be.
The Oil Time Bomb Few Are Pricing In
Now layer in a critical risk:
There are growing concerns that pre-war oil reserves could be largely depleted by around April 20, forcing the global market to rely more directly on current, real-time supply conditions.
In normal circumstances, stockpiles and reserves act as a buffer:
smoothing out disruptions
delaying price shocks
keeping supply chains functioning
But if those buffers are exhausted, the system changes dramatically.
At that point, Crude Oil pricing can no longer lean on stored supply—it must reflect live availability, which is directly impacted by disruptions around the Strait of Hormuz.
Why Markets Aren’t Reacting—Yet
Even with this looming constraint, price action remains relatively contained.
Why?
Because markets are still operating under assumptions:
supply disruptions may be temporary
reserves are still available (for now)
geopolitical tensions could stabilize
In other words:
👉 The market is still pricing delay, not depletion
When the Buffer Disappears
If reserves do run thin around that timeframe, the dynamics shift quickly:
Refineries must source real-time supply
Shipping constraints become immediately relevant
Energy prices respond to actual scarcity, not expectations
This is where the disconnect between “paper pricing” and physical reality can close rapidly.
And when it does, it tends to happen violently.
Why It Feels Like a Game
Today’s market structure amplifies the disconnect:
🎮 Speed
Algorithms react instantly to headlines, not long-term fundamentals
🎮 Abstraction
Most trading happens in derivatives, not physical goods
🎮 Liquidity
Large flows can push prices independent of underlying conditions
The result is a system where price can feel simulated, detached from real-world constraints.
The Risk Beneath the Rally
This doesn’t mean markets are fake—it means they are fragile.
Right now, the rally appears to be driven by:
expectations of stabilization
positioning dynamics
short-term liquidity
But if the oil buffer truly disappears:
inflation pressures could spike
growth could slow further
central banks could remain restrictive
That combination has historically been difficult for equities.
The Moment Reality Catches Up
Markets often ignore risks—until a threshold is crossed.
If energy markets are forced to reprice due to real supply constraints, the shift could be abrupt:
Oil moves sharply higher
Volatility increases
Equity markets reassess risk rapidly
The same system that pushed prices higher like a “video game” can reverse just as quickly.
Conclusion: A Fragile Illusion
The current rally feels disconnected because it is being driven by expectations, not confirmed constraints.
But expectations have limits.
If reserves are depleted and real-world supply becomes the dominant force, markets may be forced to reconcile with reality.
And when that happens, the transition from illusion to reality is rarely smooth.
It’s sudden, sharp, and impossible to ignore.
The Rise of a “Fraudulent” Market! Major Correction Incoming!“A Fraudulent Market on Borrowed Time: Why a Major Correction May Be Inevitable”
The Illusion of Strength in a Weakening Economy
At first glance, markets appear resilient. The Nasdaq Composite and S&P 500 continue to push higher, seemingly shrugging off war, inflation, and slowing growth.
But beneath the surface, the foundation looks increasingly fragile.
Global growth is being revised lower
Inflation risks remain elevated
Interest rates are still restrictive
Geopolitical tensions are escalating
This raises a critical question:
Are markets reflecting reality—or are they being propped up by forces disconnected from fundamentals?
The Rise of a “Fraudulent” Market Structure
Modern markets are no longer driven purely by supply and demand in the traditional sense. Instead, they are heavily influenced by:
passive investment flows
algorithmic trading
derivatives and leverage
central bank expectations
Critics argue that this creates a system where price action can diverge from underlying economic conditions.
In such an environment, some view the market as “structurally distorted”—not necessarily illegal, but increasingly disconnected from real economic signals.
The Oil Market Disconnect: Physical Reality vs Paper Pricing
One of the clearest examples of this disconnect can be seen in Crude Oil markets.
With tensions rising around the Strait of Hormuz, a key artery for global oil supply, one would expect prices to surge dramatically.
Yet prices have often remained below levels that would typically reflect such risk.
This has led to criticism of the so-called “paper oil market”, where:
futures contracts dominate price discovery
large financial players influence short-term pricing
physical supply constraints are not immediately reflected
While these markets provide liquidity and hedging tools, they can also create periods where price appears disconnected from physical reality.
Inflation Pressure Is Building Beneath the Surface
Recent inflation data has delivered mixed signals.
While headline numbers may appear manageable, underlying components—especially energy—are rising:
gasoline and energy prices are accelerating
supply chain risks are increasing
geopolitical uncertainty is feeding cost pressures
This suggests inflation may not be fully under control, particularly if oil prices rise further.
Slowing Growth and the Risk of Stagflation
Global growth forecasts have been revised lower by institutions such as the International Monetary Fund.
This creates a dangerous macro environment:
slowing economic growth
persistent inflation
limited room for central banks to cut rates
This combination—often described as stagflation—has historically been challenging for equity markets.
Valuations Detached from Reality
Valuation metrics remain elevated by historical standards.
When markets trade at high multiples during periods of:
slowing growth
rising costs
geopolitical instability
it increases the risk of a sharp repricing if expectations change.
Even if valuations alone do not trigger a decline, they leave little margin for error.
The Role of Narrative and Market Psychology
Markets today are heavily influenced by narratives.
Short-term rallies can be driven by:
expectations of policy intervention
optimism about conflict resolution
positioning and short covering
This can create situations where:
“Bad news is interpreted as bullish”
However, narrative-driven markets can shift quickly when sentiment changes.
The Risk of a Sudden Repricing
History shows that markets often ignore risks—until they can’t.
A major correction could be triggered by:
a sustained rise in oil prices
accelerating inflation data
further deterioration in global growth
stress in credit markets
When these factors align, markets may rapidly adjust to reflect underlying realities.
Conclusion: A Fragile Market Environment
The current market environment can be seen as a tension between:
financial market dynamics
and real-world economic conditions
While markets may continue to rise in the short term, the combination of:
geopolitical risk
inflation pressures
slowing growth
elevated valuations
suggests a fragile foundation.
Whether one views the system as distorted or simply complex, the key takeaway is clear:
Markets that diverge too far from underlying conditions often face periods of sharp correction.
A Major Warning Crash Signal for Markets!🚨 CAPE at 40.30: Second-Highest in History — A Major Warning Signal for Markets
The Shiller CAPE (Cyclically Adjusted P/E) ratio is one of the most respected long-term valuation metrics because it smooths earnings over 10 years, cutting through short-term noise.
Today, CAPE sits around 40.30 — a level seen only a handful of times in over 150 years of market history. Outside of the dot-com bubble, this is among the highest readings ever recorded.
Historically, CAPE levels above 30 have never been sustainable and have always been followed by major market drawdowns or crashes.
📚 Historical Precedents: What Happened Last Time CAPE Was This High?
🔥 1929 – Great Depression
CAPE exceeded 30
Followed by a market crash of nearly 90%
Economic depression lasting a decade
🔥 2000 – Dot-Com Bubble
CAPE peaked above 44 (highest ever)
Nasdaq collapsed ~78%
S&P 500 lost ~50%
Took years to recover
🔥 2008 – Global Financial Crisis
CAPE remained elevated into the mid-to-high 20s after years of excess
Valuations stayed stretched while debt, leverage, and housing bubbles expanded
Result:
S&P 500 fell ~57%
Global credit markets froze
Deep recession followed
⚠️ Important note:
CAPE does not always need to hit extreme highs right before the crash — prolonged overvaluation combined with leverage and credit stress has historically been enough.
🧠 Key Insight
Markets don’t crash because CAPE is high.
They crash because high valuations leave no margin of safety when stress arrives.
Right now, valuations are extreme while macro stress is building.
🌍 Macro Warning Signs Supporting the Risk
📉 China’s Structural Breakdown
Ongoing real-estate collapse
Developer defaults
Weak consumer demand
Spillover risk to global growth, commodities, and financial markets
🏢 Commercial Real Estate Crisis
Office vacancies at multi-decade highs
Refinancing risk as rates stay elevated
Banks and regional lenders exposed
Similar early warning signs seen before 2008
💣 Exploding Government Debt
U.S. and global debt at record levels
Interest costs rising faster than GDP
Limits governments’ ability to stimulate during downturns
Fiscal stress historically precedes recessions
📉 Yield Curve & Credit Stress
Extended yield curve inversion (classic recession signal)
Tightening credit conditions
Rising defaults in leveraged sectors
🚨 Why This Time Is Especially Dangerous
Unlike previous bull markets, today we have: ✔ Extreme valuations (CAPE > 40)
✔ High interest rates
✔ Heavy global debt
✔ Weak global growth
✔ Fragile real-estate sectors
✔ Tight liquidity conditions
This combination reduces the odds of a soft landing.
🧭 What History Suggests
When CAPE exceeds 30 during bull markets:
Returns over the next 5–10 years are poor
Corrections are sharp, not gradual
Crashes tend to coincide with recessions
Markets can stay irrational longer than expected — but valuation extremes are always resolved eventually.
📌 Summary
CAPE at 40.30 is a historic red flag
Similar conditions preceded 1929, 2000, and 2008
Current macro stress supports the risk of:
👉 Major market sell-off
👉 Potential recession starting this year
This is not about timing tops — it’s about recognizing asymmetric risk
⚠️ Ignore price — watch valuations, credit, and liquidity.
BTC/USD 4 HOUR CHART FALL WARNING BARTS HEADIn this idea I illustrate how we are on a Barts head falling to 86-87k range. The reason I believe this has been missed by a lot of people is the slanted angle of it as we are on a hard uptrend. Tilt your head and see what I mean...I hope this helps you. Much love - ND
1929 Stock Market & Today The story of 1929 -
The Great Depression was a severe worldwide economic depression that lasted from 1929 to the late 1930s. There were several factors that contributed to the trigger of the Great Depression, but the key trigger is often attributed to the stock market crash of 1929.
In the 1920s, there was a period of economic growth and prosperity in the United States, also known as the "Roaring Twenties." During this time, people invested heavily in the stock market, and the prices of stocks rose rapidly. However, in September and October of 1929, the stock market began to decline, and on October 24, 1929, known as "Black Thursday," panic selling began, causing the stock market to crash.
The stock market crash led to a chain reaction of events that contributed to the Great Depression. Banks had invested heavily in the stock market and had also made loans to individuals and businesses that were unable to repay them. As a result, many banks failed, leading to a loss of confidence in the banking system.
The collapse of the banking system led to a decrease in the money supply, which caused a decline in spending and investment. The decline in spending and investment led to a decrease in production and employment, which caused a further decline in spending and investment, and the cycle continued.
In summary, the key trigger for the Great Depression was the stock market crash of 1929, which led to a chain reaction of events that caused the collapse of the banking system and a severe decrease in spending and investment.
I am seeing similarities between its technical and fundamental.
My view on technical as a study into "Behavioral price movement" , it refers to the fluctuations in the price of a financial asset that are caused by the collective behavior of investors, traders and events. And they tend to repeat itself.
Trading & Hedging in Nasdaq -
E-mini Nasdaq Futures & Options:
Minimum fluctuation
0.25 index points = $5.00
Micro E-mini Nasdaq Futures & Options:
Minimum fluctuation
0.25 index points = $0.50
Disclaimer:
• What presented here is not a recommendation, please consult your licensed broker.
• Our mission is to create lateral thinking skills for every investor and trader, knowing when to take a calculated risk with market uncertainty and a bolder risk when opportunity arises.
CME Real-time Market Data help identify trading set-ups in real-time and express my market views. If you have futures in your trading portfolio, you can check out on CME Group data plans available that suit your trading needs www.tradingview.com
The Stock Market Crash Is Right Next To You... [WARNING]
Hello all. Today I unexpectedly found a great discovery on AAPL, Apple. Yes, I will talk about the holy stock market crash today.
These days everyone wondering: Is that really true that stock market is going to crash? I am also one of them, so on the other day, I did a quick analysis on the VIT stock. But the analysis was wrong, I NEEDED to do analysis on a REAL stock, but not a ETF or likes.
But why Apple? It's obvious. The Apple stock is, literally, the number one stock on the market. Nasdaq, DOW, S&P 500, the stock is on the "very top" on the variety of indexes. Knowing Apple's future price, you could safely say that it's equivalent to knowing the future of the entire stock market, financial market.
So, the key indicator on this analysis is: A fibonacci retracement
While fibonacci retracement is an amazing tool, you need to take a closer look at how precisely the fibonacci retracement is working on the chart. How nicely the prices are fitting to the fib retracement lines decides the level of trustworthiness for the fib retracement, like the above.
(Pro tip: Use the magnet tool; Toggle the logarithmic mode to see a clear view where is the true peak and the true valley; Find a best fibonacci retracement, take a closer look at horizontal supports)
Other than the fibonacci retracement, there are two (three) reasons why I believe that the stock market is going to crash.
1. Three peaks
A three peaks, this is my original term. As you can see on the chart, you can see a three tops, where the each is all on the nearly same level, but not far from each other. This is a big signal that you can vaguely tell if the market is not performing well. You can find the pattern on the recent Bitcoin 65K crash in the early 2021.
2. RSI bearish divergence
RSI divergence is a huge help to precisely tell if the asset is going to crash on the timeframe. Apple is marking a big bearish divergence on its monthly timeframe and its weekly timeframe. It's very important here to ensure that the 1M timeframe is as well bearish but not the 1W timeframe.
3. EMA ribbon crossunder
This is also my original term. An EMA ribbon crossunder is when an EMA ribbon crossunders the SMA 50. In other words, When the SMA 50 crossovers the EMA ribbon. An EMA ribbon is an array of EMAs, exponential moving average. Usually EMA 25, 30, 35.. 50, and 55, or likes.
The crossunder of an EMA ribbon under a higher moving average such as SMA50, means that a shorter or more reactive moving crossunders a longer or less reactive moving average. Fundamentally, EMA ribbon crossunder is the same concept to a death cross, where SMA 50 crossunders SMA 200 or SMA 100. But an EMA ribbon crossunder is more visual friendly. An EMA ribbon crossunder also happened on the Bitcoin crash, and often on other assets.
So, that's it. Hope this helps for your exit strategy.
Oh, and also note that it's also highly possible that you will see a bull trap, a.k.a dead cat bounce. You also could say the complacency phase in the market cycle.
I'm very scared of the market crash, not because I could lose big, but it could lead some more serious side effects to the real world. You know what I mean. Perhaps you'd better prepare some gold and foods in your house XD
Stay safe.
// This is NOT a Financial Advice. This is For Educational Purposes Only. //
Boulevard Of Broken DreamsWhatever will going to happen will happen, and what we need appeared.
Why the market had likely overshot when the economy still struggle? Because it is the nature of stock market, people like to run away from reality, wanna live in richness fantasy. "The more sweet dreams are the more hurtful when wake up" . The economy will affect the stock market, never the opposite.
When the music stop? We will find out in the next 2 weeks.
We can see a big pullback in 3500 resistance but the next 2 weeks could decide the market destiny. Keep your head objective, conscious, calm and cool. You will make a better decision.
Short below 3450, recommend if weekly price close under this position. (Stop loss >3600)
Press like & follow to support my work.
Thanks for your attention !
US100 Bull Trap 6/25, 40hr crossed 400hr MA; Crash incomingI was right about the last theory, so I'm expanding on it. The MAs don't lie. Today had all the markings of a Bull Trap; and may continue tomorrow, though I'm hoping for the sell off tonight. By Monday 7/6 we should be near a bottom support. The 12yr Bull trend broke above it's channel's resistance; which has always resulted in a major sell-off. The new long-term Bear trend emerging has a 3:1 steeper angle in a wedge; and the short term bear corrections are bout 12% steeper than the bull corrections. The new long term bear trend that could emerge next year will be a decline twice as steep as the 12yr Bull trend.
Perma-bulls are gonna lose a lot of money soon believing in the Fed and the Trump lies. Trump and Barr are beginning to file anti-trust lawsuits against most of the FAANG and social media companies. This will surely hurt US Tech. Last, but not least, the U.S. Semi market is in a very vulnerable position with China the trade deal off, and war drums beating around the world. The U.S. doesn't even have the materials and foundries to produce it's current products. All the rare earth materials come from China; and TSMC is the world's leading foundry by leaps and bounds. WHEN China Annexes Taiwan, the US Semi market will take decades to catch up, if ever.
All China needs to be self-sufficient in the semi market is to build newer foundries and infrastructure(10-12yrs); OR the could just steal Taiwan's foundries in a short war. Trump will just denounce and beg for them to honor the deal; like he did with HK and Muslim Camps. For the U.S. to become independent we have to discover new rare earth deposits and mine them.(decades) Then we have to build several semi foundries.(decades)
To give you an idea of how far behind we are: TSMC agreed to build a 7nm foundry for $40BN in AZ that will take 10-12yrs to complete. They currently have 5nm foundries of their own and are nearing 3nm capabilities. By the time we theoretically get foundries built for dated current tech, they may have 1nm or smaller capabilities. This is not something that happens in a few years. It takes tens of Billions of dollars and decades. We fell behind because we used Asia for cheap labor, at the expense of the American middle class. Now those cheap laborers took over the farm and are about to put us in the dog house. That's what we get for electing greedy, racist, impulsive idiots and those who supported these trends will pay the most for it.
UShort
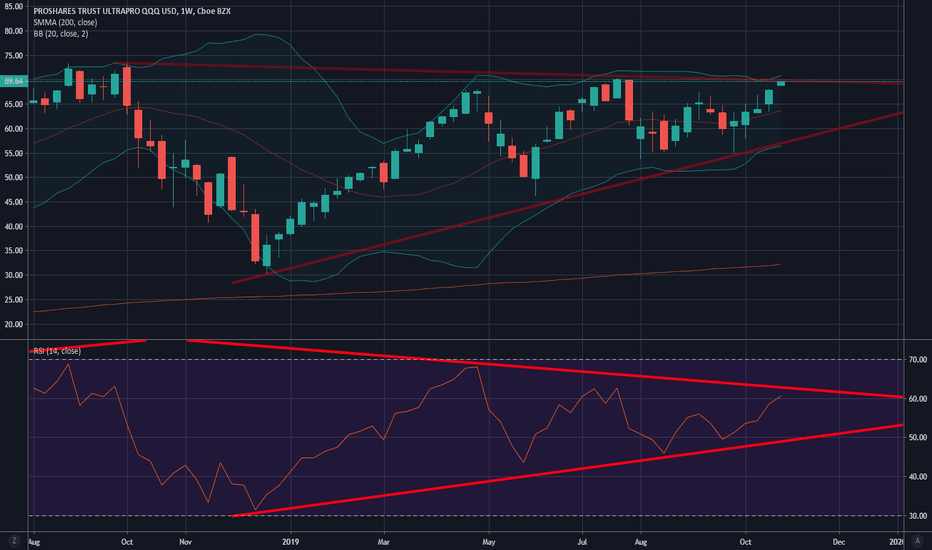
Testing new heights - TQQQ Going to Drop from this ResistanceBased on very simple technical analysis on the weekly chart, it's looking like TQQQ is about to ricochet off the top and likely end up crashing due to decreased trading volumes in the NASDAQ. Without the volume to artificially prop up the stock prices underlying the TQQQ ETF, I'm predicting a stunning downside movement. History shows us that when this topline resistance is hit, things go down. At the minimum, I'm predicting a 15% downside movement. If this week's economic data continues to point negative, I think it'll lock into a downward cycle.
This is not trading advice, but merely an observation and prediction.
We are SHORT'ing the FUCK out of NYSE: $NGVC | #NaturalGrocers!We are SHORT'ing the FUCK out of NYSE: $NGVC | #NaturalGrocers! We are in the 5th wave of the smaller 5th wave! Unfortunately, I can't zoom in on the 1 minute chart, but this baby is going to COLLAPSE HARD! Higher highs in price + Lower highs in RSI = MASSIVE PROFITS!