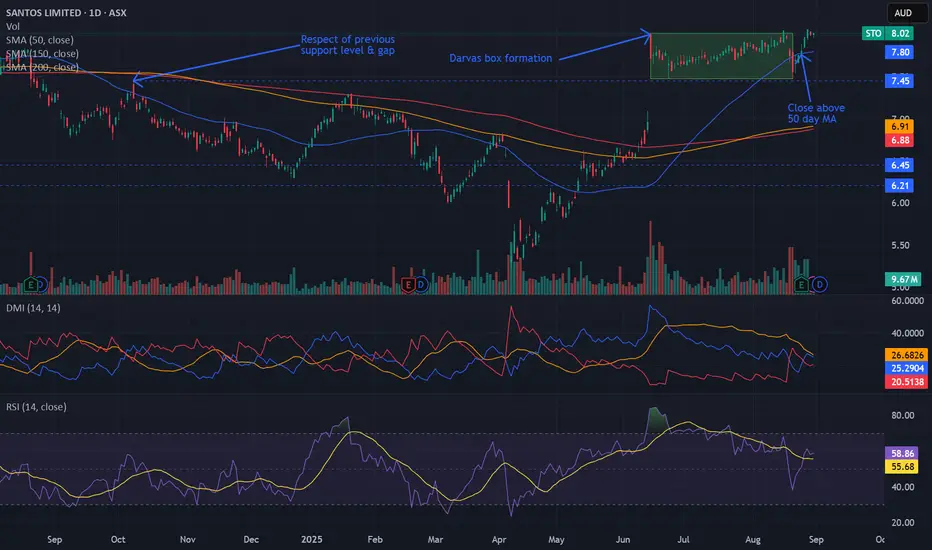
Bullish potential detected for STOEntry conditions:
(i) breach of the upper confines of the Darvas box formation for $ASX:STO.
- i.e.: above high of $8.02 of 16th June (most conservative entry), and
(ii) swing up of indicators such as DMI/RSI.
Stop loss for the trade (based upon the Darvas box formation) would be:
(i) below the support level from the low of 20th August (i.e.: below $7.48).
Darvas
Bearish potential detected for AGLEntry conditions:
(i) breach of the lower confines of the Darvas box formation for ASX:AGL
- i.e.: below low of $9.84 of 7th April, and
(ii) swing increased bearishness of indicators such as DMI/RSI along with a test of prior level of support of $10.02 from 11th March.
Stop loss for the trade (based upon the Darvas box formation) would be:
(i) above the high of 10th April (i.e.: above $10.89), or
(ii) above the prior support level from the open of 10th January (i.e.: above $11.15), depending
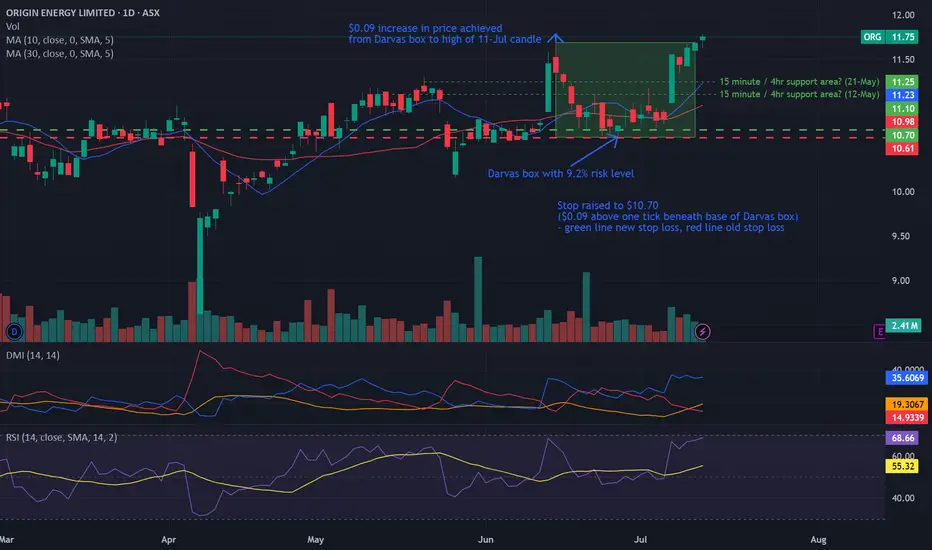
Bullish potential detected for ORGEntry conditions:
(i) breach of the upper confines of the Darvas box formation for ASX:ORG
- i.e.: above high of $11.69 of 16th June (most conservative entry), and
(ii) swing up of indicators such as DMI/RSI.
Stop loss for the trade (based upon the Darvas box formation) would be:
(i) below the support level from the low of 26th June (i.e.: below $10.62).
Bullish potential detected for QUBEntry conditions:
(i) breach of the upper confines of the Darvas box formation for ASX:QUB
- i.e.: above high of $4.04 of 28th November (most conservative entry), or
(ii) swing up of indicators such as DMI/RSI along with a test of prior level of $4.00 from 25th November.
Stop loss for the trade (based upon the Darvas box formation) would be:
(i) below the support level from the low of 13th December (i.e.: below $3.80).
QLong
Bullish potential detected for SDREntry conditions:
(i) breach of the upper confines of the Darvas box formation for ASX:SDR - i.e.: above high of $6.91 of 17th October (most conservative entry), or
(ii) swing up of indicators such as DMI/RSI along with a test of prior level of $6.84 from 18th October.
Stop loss for the trade (based upon the Darvas box formation) would be:
(i) below the support level from the low of 24th October (i.e.: below $6.36).
Bullish potential detected for RZIEntry conditions:
(i) breach of the upper confines of the Darvas box formation for ASX:RZI - i.e.: above high of $0.45 of 11th September (most conservative entry), or
(ii) swing up of indicators such as DMI/RSI along with a test of prior level of $0.425 from 9th September.
Stop loss for the trade (based upon the Darvas box formation) would be:
(i) below the support level from the low of 24th September (i.e.: below $0.405).
Bullish potential detected for SGPEntry conditions:
(i) breach of the upper confines of the Darvas box formation for ASX:SGP - i.e.: above high of $5.10 of 27th August (most conservative entry), or
(ii) swing up of indicators such as DMI/RSI along with a test of prior level of $5.05 from 27th August.
Stop loss for the trade (based upon the Darvas box formation) would be:
(i) below the support level from the low of 28th August (i.e.: below $4.92).
Ryan Specialty Holdings (RYAN): Super Stock!Fundamentals:
RYAN (Ryan Specialty Holdings) is a super stock in my book. The balance sheet is booming off the charts with accelerating earnings and sales. It is in a healthy industry and has great cashflow. Some off-loading of funds for a quarter, but that is probably temporary. 73% return on equity.
Technicals:
Daily:
Technically, on the daily chart, there is a cup-with-handle pattern to boot within a larger weekly cup-with-handle pattern.
Weekly:
Comment:
I already bought it arou
Bullish potential detected for WFCNYSE:WFC represents a potential bullish opportunity should momentum continue and newer highs be made.
Entry condition:
(i) breach of the upper confines of the Darvas box formation - i.e.: above high of $61.76 of 23rd April.
Stop loss for the trade (based upon the Darvas box formation) would be:
(i) below the support level from the low of 3rd May (i.e.: below $59.12) - most conservative exit, or
(ii) below congestion area composed of volume profile zone and rising 10 day moving average (i.e.:
Combined Box and Squeeze Strategy (Now includes shaded boxes)Description:
This Pine Script strategy, titled "Combined Box and Squeeze Strategy", is a unique blend of two powerful trading concepts: "The Box Percent Strat" and "Squeeze Box ". The strategy is designed to work on the TradingView platform and can be applied to a wide range of financial instruments across various timeframes.
Key Features:
Box Percent Strategy: This part of the strategy creates dynamic boxes based on percentage movements. These boxes adjust their size depending on the price
Box and Squeeze Strategy - Darvas InspiredDescription
The "Combined Box and Squeeze Strategy" is a comprehensive trading script developed for the TradingView platform. It merges two distinct analytical approaches: "The Box Percent Strat" and "Squeeze Box ," offering traders a multifaceted tool for market analysis.
Key Features
Box Percent Strat: This component of the strategy dynamically adjusts trading boxes based on price movements. The top and bottom of the box are recalculated as the market evolves, providing visual cues for sig
How to find Darvas Stocks using TradingView's Stock Screener 2.0🔷 Introduction
Nicolas Darvas, a dancer by profession and a self-taught trader, managed to turn a mere $36,000 into a whopping $2 million within an 18-month timeframe during the late 1950s. His approach to trading, now famously known as the Darvas Box Theory, primarily focused on trading stocks that were making new highs. But why was Darvas so fixated on these particular stocks?
Darvas believed that stocks hitting new highs were driven by fundamental factors that had caught the attention of ma
HOW-TO: Navigate the Market with the Darvas Box Strategy
🚀 Introduction to the Darvas Box Strategy
Nicolas Darvas, a dancer by trade, crafted a unique and potent trading strategy during his global tours, famously turning $36,000 into $2 million within an 18-month timeframe during the 1950s. His approach, detailed in his book "How I Made $2,000,000 in the Stock Market," revolves around the concept of the "Darvas Box" - a method that encapsulates price movements and leverages breakout patterns, all while keeping a keen eye on volume.
Darvas sought
DAR/USDT - LONG SCALPING-- Support me with numbers and follow up on my account for other deals in the future. Thank you for coming to this part.
---------------------------------------------------------
⚡️⚡️ DAR/USDT ⚡️⚡️
Exchange: ByBit USDT
Trade Type: Breakout (Long)
Leverage: Cross (5.0X)
Entry Orders:
1) 0.2009 - 100.0%
Take-Profit Orders:
1) 0.2089 - 65.0%
2) 0.2117 - 25.0%
3) 0.2165 - 9.998%
Stop-loss Orders:
1) 0.1966 - 100.0%
Trailing Configuration:
Stop: Breakeven -
Trigger: Target (1)
DLong
NEVDF Long-term reversalHello everyone.
V-Bottom happened on the weakly.
Volume Increase on rallies and decrease on corrections.
Darvas box pattern - you have a shoot up and then the price consolidates within a box range...
The stock was in a very long downtrend without any signals of reversal until now.
Checked also the weakly chart.
Basic materials are advancing.
NLong
Average Up as a Trading StrategyThe average up strategy provides Huge wins, Small losses and Risk minimized.
Use RANGE-CHART for this, so you could see the Buy setups more easily with less noise or time distortion.
First
You look for a buy setup, one that you believe that price should move rapidly from your starting buy point (you expect ab big relative move).
Second
You add up position. Every trader should use his own risk management based on his account size and what he is comfortable with,
BUT...
The position u
#NIFTY .... A Story in one hour boxesIndia's main index, NIFTY 50, hasn't broken down though these one hour boxes, on a closing basis, since the massive selling on December 21, 2020.
A case for long NIFTY continues till the boxes keep getting marked up.
It can't be gainsaid that this is a market, in which one should move with Stop losses on a progressive basis.
V
FSLY Cup and Handle Break Out of Darvas Box NYSE:FSLY On the hourly Fastly Inc formed a Cup and Handle pattern and broke out of a Darvas box with a volume above the average. Now it looks like it is forming a Bull Flag
FLong
Darvas Volume Screening on Weekly VolumeAs you all know the book written by nicholas darvas in 1959, emphisized on the volume and price action on weekly magazine called Barton. This weekly magazine contains information about price action and volume and also about company business and important fundamental indicator.
This screener on weekly data and hopefully could some how functioned as Darvas Barton on screening the price action and volume of certain stock, especially stock in Indonesia. Here I used the 1 week data, relative volu