Breaking: Planet Labs PBC (NYSE: PL) Spike 25% Today The price of Planet Labs PBC (NYSE: PL) broke out of a bullish flag pattern surging 25% today albeit market turmoil. The stock is eyeing the $20 resistant amidst bullish sentiment.
However, with RSI at 76 the stock might experience a respite before picking liquidity up.
In another news, Planet Reports Financial Results for Third Quarter of Fiscal Year 2026
Earnings Highlight
Delivered Record Revenue in Q3 of $81 Million, Up +33% YoY
Increased RPOs +361% YoY to $672 Million; Backlog +216% YoY to $734 Million
Generated $114 Million of Year-to-Date Net Cash Provided by Operating Activities
End of Period Cash, Cash Equivalents, and Short-Term Investments Increased 180% YoY to $677 Million
Successfully Launched 2 High Resolution Pelican Satellites & 36 SuperDove Satellites
About PL
Planet Labs PBC engages in the design, construction, and launch constellations of satellites with the intent of providing high cadence geospatial data delivered to customers through an online platform the United States and internationally. The company’s platform offers planet monitoring, tasking, archive, apps, application programming interfaces (APIs), basemaps, and fusion, as well as analytic feeds and planetary variables.
Earningsanalysis

QS V3 Earnings Alert: SYM Oversold Bounce SetupSYM (Earnings Signal, QS V3 | 11/24)
Ticker: SYM
Strategy: Buy Call Options
Confidence: 58% (Medium)
Expiry: 2025-11-28
Strike Price: $52.00
Entry Range: $6.90 (ideally between ~$6.90)
Target 1: $10.35
Target 2: $13.80
Stop Loss: $4.83
Implied Move Ahead of Earnings: ~$10.45 (≈ 18.9%)
24h Price Move: +2.35%
Flow Context: Bullish (Put/Call Ratio ~ 0.54)
Risk Level: High — Use only small position size
📌 Technical & Fundamental Notes
Current Price (pre-earnings): ~$55.27
RSI: ~20.4 → Oversold condition
Range: Intraday range ~$48.58–$59.45
Support Level: ~$52.00
Resistance Level: ~$59.45
IV (Implied Volatility): ~225% → Very high
Catalyst: Earnings today, estimate ~$0.11
Volume: Light (0.1× average) → Low conviction
Fundamental Note: +618% revenue growth but historical average earnings miss ~-15.3%.
Bias Conflict: AI (Katy) is NEUTRAL/BEARISH (target ~$52.99) but we’re recommending CALLS due to technical / flow / fundamental contrarian setup.
🧮 Charting Considerations (TradingView)
Draw support line around $52.00.
Draw resistance line at ~$59.45.
Mark entry band for the option price ~$6.90.
Mark stop loss at ~$4.83 and targets at ~$10.35 / ~$13.80.
Plot RSI indicator to monitor oversold bounce.
Add IV Rank/IV Percentile indicator to show elevated volatility (~225%).
Use Annotation Text: “High IV + earnings catalyst. Contrarian bullish call setup. Small size only.”

QuantSignals V3 | HIVE Pre-Earnings Bearish TradeHIVE Earnings Signal | 2025-11-14
Ticker: HIVE
Current Price: $3.38
Trend: Bearish / Oversold
Confidence: 65%
Expiry: 2025-11-21 (7D)
Strike: $3.50
Position Size: 2% of portfolio
📊 AI & Technical Forecast
Katy AI Trajectory: $3.39 → $3.28 (–3.2%)
RSI: 11.1 → extreme oversold
MACD: –0.0617 → negative momentum
ROC: –35% → strong bearish pressure
24h Move: –11.05% → accelerated decline
Insights:
Earnings today → high expected volatility
Recent news: Bitcoin mining expansion & AI data centers, but poor historical earnings performance (0% beat rate, –130.9% surprise)
Options Flow: PCR 1.09 → slight put bias, neutral overall
IV: 148% → high implied volatility, amplifying moves
🎯 Trade Setup
Parameter Value
Direction PUT
Strike $3.50
Entry $0.35
Target 1 $0.60 (+100%)
Target 2 $0.75 (+150%)
Stop Loss $0.15 (–50%)
Expiry 2025-11-21
Position Size 2% portfolio
Confidence 65%
⚡ Key Advantages
Katy AI bearish trajectory + oversold RSI → asymmetric risk/reward
Earnings volatility provides potential for fast downside gains
Strike at $3.50 → moderate delta, intrinsic value cushion
Tight stop loss & small size mitigate earnings risk
Timing Edge:
Pre-earnings close entry captures potential post-announcement downside
Oversold conditions may prevent extreme spikes but favor put buying
🚨 Risk Notes
High beta (4.4x) → amplified moves
Earnings date uncertainty → timing risk
Extreme IV → expensive options; consider scaling entry
Potential for short-term bounce due to oversold RSI
Summary
HIVE presents a medium-conviction earnings put setup, combining Katy AI bearish signals, oversold technicals, and poor earnings history. Ideal for short-term traders targeting downside during earnings volatility.

Tencent Music Entertainment Group (TME) Set to Report Q4 EarningThe price of Tencent Music Entertainment Group (NYSE: NYSE:TME ) is up 3% in Wednesday's premarket trading as the company is set to release Q4 earnings results today before the bell.
Should a favourable news submerged, NYSE:TME will be gearing for a 60% breakout eyeing the $30 resistant point. However, in the event of a drawback, the 38.2% Fib retracement level is the suitable level for cool-off before picking liquidity up.
Financial Performance
In 2024, TME's revenue was 28.40 billion, an increase of 2.34% compared to the previous year's 27.75 billion. Earnings were 6.64 billion, an increase of 35.04%.
About TME
Tencent Music Entertainment Group operates online music entertainment platforms that provides music streaming, online karaoke, and live streaming services in the People’s Republic of China. It offers QQ Music, Kugou Music, and Kuwo Music that enable users to discover, enjoy, and share music in personalized ways; long-form audio content, including audiobooks, podcasts and talk shows, as well as music-oriented video content comprising music videos, live performances, and short videos.

CCL Earnings Setup — 200% Gain or Miss the Boat?# QS V3 CCL Earnings Elite Scalper - 2025-09-28
🎯 **TRADE RECOMMENDATION**
* Direction: **BUY CALLS**
* Confidence: **60%** (High earnings surprise history despite Katy AI neutrality)
* Conviction Level: **MEDIUM**
---
🧠 **ANALYSIS SUMMARY**
* Katy AI Signal: **Neutral**, low volatility, 50% confidence
* Avg. Historical Earnings Surprise: **166.3%** 🚀
* Analyst Sentiment: **Positive, Outperform maintained**
* Beta: **2.708 → High volatility = amplified earnings moves**
⚠️ Risk: **Moderate** (Neutral AI signal = subdued short-term action; watch news flow)
---
💰 **TRADE SETUP**
* Expiry: **2025-10-03 (5 days)**
* Strike: **$31.00 (0.4 Δ, balanced risk/reward)**
* Entry: **$0.80–$1.20**
* Target 1: **$2.40 (+100%)**
* Target 2: **$3.60 (+200%)**
* Stop Loss: **$0.40 (-50%)**
* Size: **3% of portfolio**
---
⚡ **COMPETITIVE EDGE**
* Neutral AI 📊 + **High earnings surprise potential** = asymmetric risk/reward
* Short expiry → leverage pre-earnings news catalysts
* Risk mitigation: scale out at T1, respect SL, monitor volume
---
🚨 **NOTES**
* Lower conviction ⚖️ → Risk mgmt is key.
* Macro & news flow could sway outcome. Stay sharp.
#CCL #Earnings #Options #TradingView #Scalper #AI

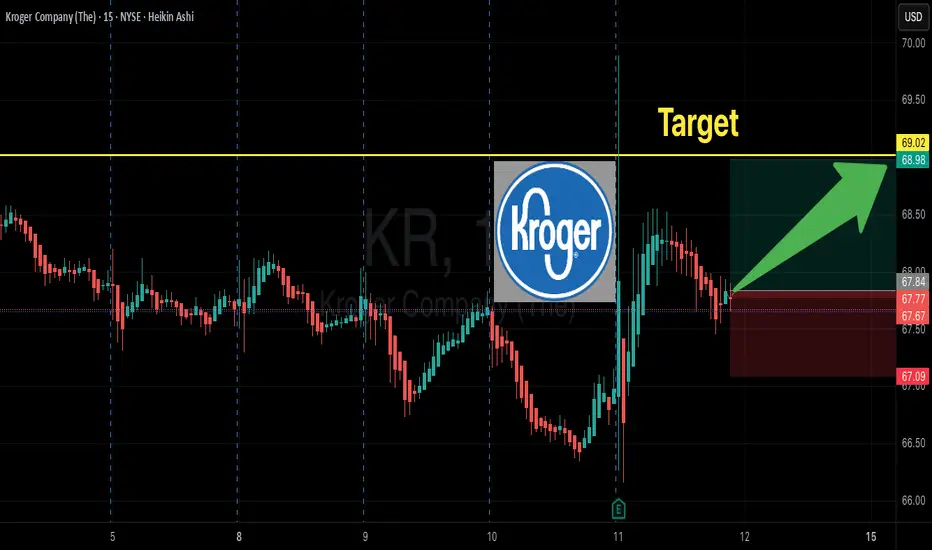
KR Earnings Jackpot: 68C Could Explode Post-Print”
🚀 **KR Earnings Play: \$68 Calls Loaded!**
📅 **Expiry:** 2025-09-12 (Weekly)
💵 **Entry:** \$0.70 (Ask)
🎯 **Profit Target:** \$2.10 → 300%+ potential
🛑 **Stop Loss:** \$0.35 → risk \$70 per contract
📈 **Confidence:** 74% (Moderate Bullish)
⏰ **Entry Timing:** Pre-earnings close (2025-09-11)
💡 **Setup Edge:** Heavy call flow at \$68 + oversold RSI → asymmetric upside vs defined loss
💎 **Why Trade This:**
* Options OI/volume confirms institutional positioning
* Technicals oversold → potential mean-reversion
* Historical earnings beat streak supports upside
⚡ **Risk Management:**
* Stop 50% premium
* Scale out 50–100% profit within 2 hours post-open
* Small sizing: 2% max portfolio risk
🎯 **Quick Take:** Cheap, asymmetric earnings swing. \$68C = potential 4:1 reward\:risk if momentum hits.
RH Earnings Lotto: 250C Targeting 200%+ Overnight”
⚡ **RH Earnings Lotto (AMC 9/11)** ⚡
📊 **Setup:**
* 🎯 Strike: **250C**
* 💵 Entry: **8.90**
* 📅 Expiry: **2025-09-12**
* 📈 Confidence: **75% (Moderate Bullish)**
🎯 **Targets & Risk**
* 🛑 Stop: **4.45** (-50%)
* 🎯 Profit: **26.70** (+200%)
* 📏 Size: 1 contract (≈2% port)
* ⏰ Timing: **Pre-earnings close**
🔥 **Why this trade?**
* Options market pricing a **12.7% move**
* Heavy **call OI at 250 (853 contracts)**
* Positive narrative: European expansion + bullish analysts
* Low VIX environment supports luxury/growth names
💡 **Play Idea:** Buy RH 250C @ 8.90 → Stop 4.45 / PT 26.70.
Risk/Reward ≈ **1 : 2+** 🎯
---

Adobe Earnings Lotto: 365C Targeting 200%+”
🚨 **ADBE Earnings Trade Setup (2025-09-11)** 🚨
🔥 **Play of the Day: Calls**
* 🎯 Strike: **365C**
* 💵 Entry: **11.65**
* 📅 Expiry: **2025-09-12**
* 📈 Confidence: **78% (Moderate Bullish)**
📊 **Targets & Risk**
* 🛑 Stop Loss: **5.83** (-50%)
* 🎯 Profit Target: **34.95** (+200%)
* 📏 Size: 1 contract (≈2% port)
* ⏰ Timing: **Pre-earnings close**
⚡ **Rationale:**
Adobe’s **AI catalysts + flawless 8-quarter beat streak** stack the odds for upside. Fundamentals (margins, FCF, growth) are 🔥, options chain shows liquidity at **365C**, and breakeven only needs \~6.4% move. Quick exit strategy to dodge IV crush.
📊 **Expected Move:** \~8.8%
📈 **IV Rank:** 0.75
💡 **Trade Idea:** Buy 365C @ 11.65 → Stop 5.83 / PT 34.95. Risk\:Reward \~1:4.

RBRK $97.50 CALL — Earnings Beat Setup You Can’t Miss!
# 💻🔥 RBRK Earnings Play: 200%+ Upside Setup!
📊 **Earnings Analysis Summary (2025-09-08)**
💡 **Trade Idea:**
👉 Buy **1x RBRK \$97.50 CALL** (exp. 2025-09-19) at **\$7.60** (pre-earnings close).
This is a **single-leg naked call** designed for a tactical earnings pop.
---
### 🧩 Why This Trade?
* 📈 **Revenue Growth:** +48.7% TTM 🚀 (SaaS momentum).
* 💰 **Gross Margin:** 76.4% → world-class unit economics.
* ✅ **Beat Machine:** 100% beat rate last 5Q, avg surprise +37%.
* 🛡 **Balance Sheet:** \$762M cash + FCF positive → de-risked growth.
* 📊 **Technical Setup:** Price \$90.93 > 20d/50d/200d MAs, RSI 65 (bullish).
* 🌎 **Macro Tailwinds:** Low VIX (15.4) + risk-on environment.
---
### 📊 Scores (1–10)
🔻 Fundamentals: 9
📈 Options Flow: 6
📊 Technicals: 8
🌎 Macro: 8
✅ Overall Conviction: **78% MODERATE BULLISH**
---
### 📌 Trade Plan
🎯 Entry: \$7.60 limit (pre-earnings close)
🛑 Stop Loss: \$3.80 (–50%)
💰 Profit Targets:
* +100% = \$15.20
* +200% = \$22.80
📆 Exit: within 2 hrs post-earnings to avoid IV crush
---
### ⚖️ Risk/Reward
* Max Loss: **\$760**
* Breakeven: \$105.10 (needs +15.6% move)
* Upside: +200% possible if earnings beat + guidance pop
---
📊 **TRADE DETAILS**
* 🟢 Instrument: RBRK
* 🟢 Direction: CALL
* 🎯 Strike: 97.50
* 💵 Entry: 7.60
* 🛑 Stop: 3.80
* 📅 Expiry: 2025-09-19
* 📈 Confidence: 78%
* ⏰ Earnings Entry: Pre-close
---
🚀💎🙌 This is a **high-conviction growth SaaS earnings bet**: risk \$760, aim for \$1,520–\$2,280 upside if history repeats with another big beat.

ORCL Earnings Put Play $205 Puts – Are You In?
# 🔥 ORCL Earnings Play – Bearish Tail Hedge 🚨
**📊 Setup:** Oracle (ORCL) – Earnings 09/09 AMC
**🎯 Direction:** PUT (Short Bias)
**💵 Entry:** \$0.93 (205 Put)
**🛑 Stop:** \$0.47 (−50%)
**🎯 Target:** \$2.79 (+300%)
**📅 Expiry:** 2025-09-12
**📈 Confidence:** 66%
---
### ⚡ Why this trade?
* 📉 Weak technicals → price < 20d & 50d MAs, RSI \~42
* 🏦 Institutional flow → heavy OI/volume at \$205 puts
* 💣 Leverage risk (Debt/Equity > 500%)
* 🎯 Cheap asymmetric bet → defined premium risk vs. big payoff
---
### ⚠️ Risks to watch
* ❌ Small move + IV crush = full premium loss
* 🚀 Big beat → upside squeeze
* 📰 Macro (Fed/inflation data) could override stock move
---
### ✅ Trade Plan
* Enter: **Pre-earnings close (09/09 AMC)**
* Position size: ≤2% portfolio
* Profit scale: +100% / +200% / +300%
* Exit rule: If stop hit OR 2 hrs after open post-earnings
---
🔥 **ORCL = High-quality biz but high expectations. This setup = cheap downside hedge with asymmetric payoff.*

ASAN Earnings Bull Play --Call \$14.50 Setup
## 🚀 ASAN Earnings Bull Play 🎯 | Call \$14.50 Setup (Sep 5 Expiry)
### 📊 Quick Summary
* **Beat History:** ✅ 8/8 beats with big surprises → strongest bull datapoint.
* **Fundamentals:** 89% gross margin 💎 but still unprofitable (–31% net).
* **Options Flow:** Put-heavy at \$13–13.50 (hedging), but calls active at \$14.50–15.00.
* **Technicals:** Neutral, trading below 50/200-MA.
* **Macro:** Mixed, but AI/productivity tailwind possible.
**Net View:** 🟢 **Moderate Bullish (70% confidence)**.
---
### 📝 Trade Plan
* 🎯 **Instrument:** ASAN
* 🔀 **Direction:** Call
* 🎯 **Strike:** \$14.50
* 💵 **Entry:** \$0.85 (ask)
* 📅 **Expiry:** 2025-09-05
* 🎯 **Profit Target:** \$2.55 (+200%)
* 🛑 **Stop Loss:** \$0.42 (–50%)
* ⏰ **Timing:** Pre-earnings close
⚠️ **Exit Rule:** Close within 1–2 hours post-earnings to avoid IV crush.
---
### 🚀 Hashtags for Virality
\#ASAN #EarningsPlay #OptionsTrading #CallOptions #WeeklyOptions #BullishSetup #EarningsTrade #HighRiskHighReward #StocksToWatch #OptionsFlow #TradeSetup #TechnicalAnalysis

TGT Earnings Play: Strong Bearish Setup – $100 Put🛒💥 TGT Earnings Alert – $100 Put (Aug 22, 2025) 🚨🔥
Earnings Snapshot
📉 Revenue Momentum: -2.8% TTM ❌
📊 Margins: Profit margin 4.0%, Gross margin 28.1% ⚠️
📈 Forward EPS Growth: 15.5% (aggressive) 💡
💵 Debt-to-Equity: 130.21 ⚖️
🏬 Sector Context: Discretionary retail under pressure, consumers shifting to essentials 🛒
Technical & Market Context
Price: $104.95, above 20-day MA ($103.40) but below 200-day MA ($115.47) ⚖️
RSI: 58.35 → neutral momentum
Volume: 3.8M, below average 📉
Options Flow: Expected bearish put skew 📉
Macro: Inflation & rising costs = headwinds 🚨
💥 Trade Recommendation
🎯 Strategy: Earnings Put
🏦 Instrument: TGT
💵 Strike: $100 Put
🗓️ Expiry: Aug 22, 2025
💰 Entry Price: $1.85
🎯 Profit Target: $5.50 (200%+)
🛑 Stop Loss: $0.92 (50% of premium)
⏰ Entry Timing: Pre-earnings close
📈 Confidence: 90% 🔥
⚠️ Key Risks:
Rapid IV crush post-earnings ⏳
Unexpected upside surprise 🚀
High leverage; manage sizing carefully ⚖️
Multiple Exit Scenarios
Profit Target Hit: Exit at $5.50 💰
Stop Loss: Exit at $0.92 ❌
Time-Based: Close within 90 mins post-earnings ⏱️
Trade JSON
{
"instrument": "TGT",
"direction": "put",
"strike": 100.0,
"expiry": "2025-08-22",
"confidence": 90,
"profit_target": 5.50,
"stop_loss": 0.92,
"size": 1,
"entry_price": 1.85,
"entry_timing": "pre_earnings_close",
"earnings_date": "2025-08-21",
"earnings_time": "BMO",
"expected_move": 5.0,
"iv_rank": 0.85,
"signal_publish_time": "2025-08-19 15:20:01 UTC-04:00"
}
📊 Quick Trade Recap:
🎯 PUT $100 | 💵 $1.85 → 🎯 $5.50 | 🛑 $0.92 | 📅 Aug 22 | 📈 90% Confidence
⏰ Entry: Pre-Earnings Close | 📆 Earnings: Aug 21 BMO | 📊 Expected Move: 5%

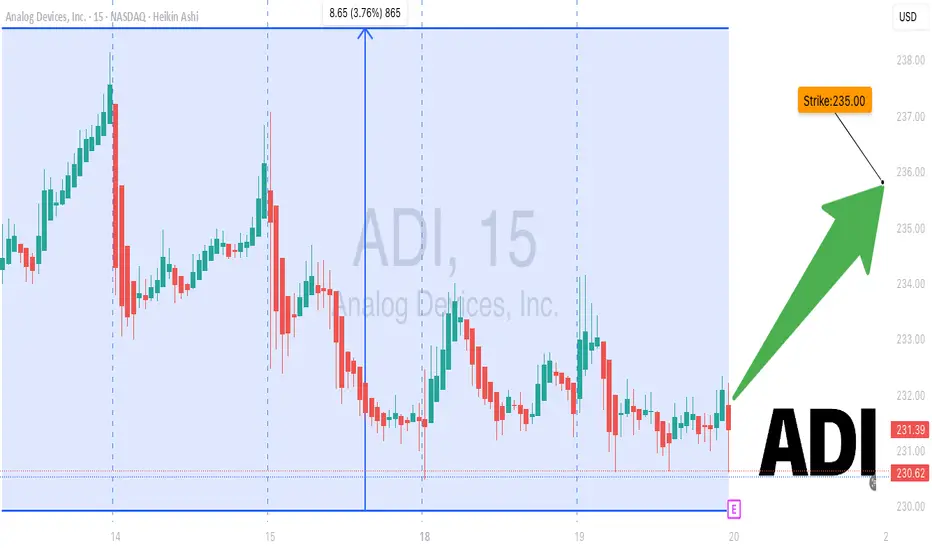
ADI Earnings Options: Long $235 Call⚡💎 ADI Earnings Alert – $235 Call (Aug 23, 2025) 🚀🔥
Earnings Snapshot
📊 Revenue Momentum: +22.3% TTM ✅
💵 Revenue per Share: $19.79
📈 Profit Margin: 18.7%, Operating Margin 25.7%, Gross Margin 58.8% 💎
🏦 Forward EPS: $7.54, Avg Target Price $254.16 📈
💡 Sector Context: Semiconductors benefiting from automotive & industrial recovery 🚗🏭
Technical & Market Context
Price: $231.55, near 50-day MA ($233.25) ⚖️
RSI: 50.37 → neutral
Volume: 2.12M, below 10-day & 3-month averages 📉
Key Levels: Support $227.83, Resistance $234.22
Macro: Low VIX (14.84) supports growth/low-volatility environment 🌈
💥 Trade Recommendation
🎯 Strategy: Long Call
🏦 Instrument: ADI
💵 Strike: $235 Call
🗓️ Expiry: Aug 23, 2025
💰 Entry Price: $5.50
🎯 Profit Target: $22.50 (200–300%+) 💎
🛑 Stop Loss: $2.75 (50% of premium) ❌
⏰ Entry Timing: Pre-earnings close
📈 Confidence: 75%
⚠️ Key Risks:
Absent detailed options flow 📊
Pre-earnings technical neutrality ⚖️
Potential premium spike → IV crush post-announcement ⏳
Trade JSON
{
"instrument": "ADI",
"direction": "call",
"strike": 235.0,
"expiry": "2025-08-23",
"confidence": 75,
"profit_target": 22.50,
"stop_loss": 2.75,
"size": 1,
"entry_price": 5.50,
"entry_timing": "pre_earnings_close",
"earnings_date": "2025-08-22",
"earnings_time": "AMC",
"expected_move": 5.0,
"iv_rank": 0.75,
"signal_publish_time": "2025-08-19 14:52:26 UTC-04:00"
}
📊 Quick Trade Recap:
🎯 CALL $235 | 💵 $5.50 → 🎯 $22.50 | 🛑 $2.75 | 📅 Aug 23 | 📈 75% Confidence
⏰ Entry: Pre-Earnings Close | 📆 Earnings: Aug 22 AMC | 📊 Expected Move: 5%
AMD will soar and POP $200. Analyst bang big on rival productAMD datacenter products are better than during 2023-24. It can now rival NVDA to grab global datacenter and entreprise datacenter market share. Analysts are upgrading to 200-210 target.
Trump recent lifting chip restrictions for export to china, boost AMD and NVDA market reach
AMD recent 800million inventory write off suddenly became instant cash as ban is lifted.
AMD is of the number 2 after NVDA to grab Trump's mega American datacenter plan, in the medium term, long players will see AMD break 200 to 350 easily.
AMD is like the younger NVDA few years back, going to 1 trillion is a set on course.
Are you really for the opportunity to grasp ?

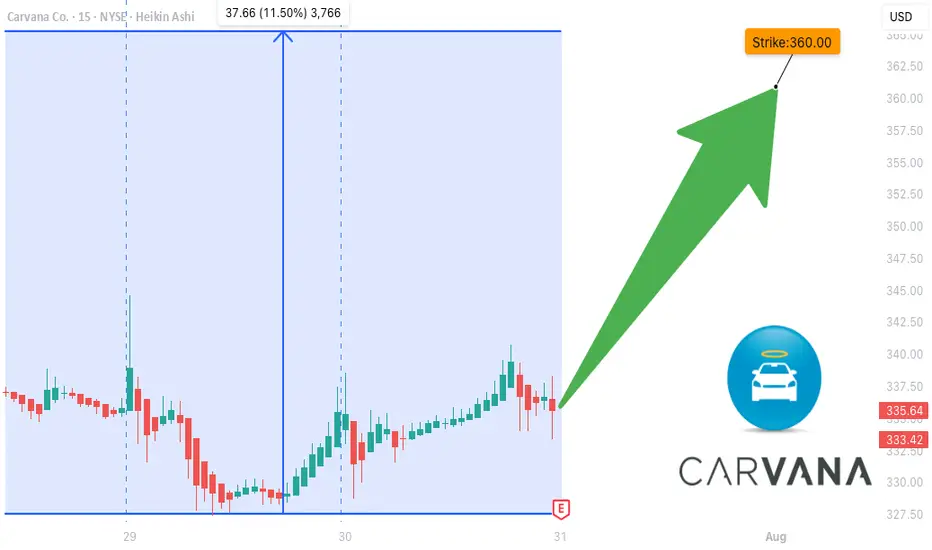
CVNA EARNINGS TRADE IDEA — July 30 (AMC)
## 🚗 CVNA EARNINGS TRADE IDEA — July 30 (AMC)
**Carvana (CVNA)**
📊 **Bullish Confidence**: 85%
📈 **Earnings Play Setup**
💣 Big Volatility + Strong History = Explosive Potential
---
### ⚙️ FUNDAMENTALS SNAPSHOT
✅ **Revenue Growth**: +38.3% YoY
🔁 **8/8 EPS Beats** (114.5% avg surprise)
🟡 **Profit Margin**: 2.7% (Thin but improving)
⚠️ **Debt-to-Equity**: 344.78 (High leverage risk)
💬 **Sector Rotation**: Growth favors high-beta names
💡 **Beta**: 3.60 → Big post-earnings swings likely
---
### 📊 OPTIONS FLOW HEATMAP
🔥 Heavy Call Volume @ \$360–\$370
🟢 Bullish OI Stack
📉 Put/Call Skew: CALL DOMINANT
💥 IV Elevated = Lotto ticket pricing
---
### 📈 TECHNICALS
💵 Price: \$336.50
🧱 Resistance: \$343.68
📉 RSI: 44.5 (Neutral – Room to Run)
📊 200D MA: \$252.21 → Long-term bullish positioning
---
### 🔥 TRADE IDEA:
**CVNA 08/01 \$360 CALL**
🎯 **Entry**: \$11.25
🚀 **Target**: \$33.75 (200% ROI)
🛑 **Stop**: \$5.60
📊 **Size**: 1 contract
⏰ **Entry Timing**: Pre-Earnings Close (AMC play)
---
### 📉 RISK / REWARD
* 🟥 Max Loss: \$11.25
* 🟩 Profit Target: \$33.75
* ⚖️ RR Ratio: 1:3
* 💼 Portfolio Risk: 2–3%
---
### 🧠 STRATEGY INSIGHTS
✅ Historical beat rate = STRONG
✅ Bullish options skew = CONFIRMED
⚠️ High debt = risk, but momentum > fear
📌 Tip: If IV crushes post-earnings, exit fast. This is a *structured speculative play* — not a hold-and-hope.
---
📢 "Speculation is fine. Structure it."
💬 Tag a trader who *YOLOs with stop losses* 👇
\#CVNA #EarningsPlay #OptionsTrading #TradingView #HighBeta #LottoPlay #RiskManaged #CallOptions #BullishSetup #IVCrushProof #EcommerceStocks #EarningsSeason
SPX 6300 Highs to 6200 Lows - Watch Key LevelsThis week earnings season kicks off
-Notables include JPM, GS, BAC, WFC, NFLX, KMI, PEP and others
US Inflation (CPI and PPI) this week
-forecasts are showing HIGHER inflation
-consumers care, but markets may not
6300-6350 key resistance area for SPX
6200 key support area for SPX
If we break the 6200 floor, there's room to fall to 6000-5700 to find stronger support
I discuss the 50 day moving averarages on the S&P and Nasdaq as levels to watch
For the remainder of the month...
7/18 July Monthly Expiration
7/30 US FOMC (with Press Conference)
8/1 US Non-Farm
8/1 US Tariff Deadline (per Trump)
Markets will have to really love a slew of good earnings and good news to see more highs and melt-ups through this typically bumpy season (Aug-Sep)
Thanks for watching!!!

How We’ll Trade Earnings This Season Earnings season is almost here — and if you're with QS, you’re already holding the most powerful edge in the market.
Let me walk you through how QS trades earnings, why we built 💸earning-signal, and how you can use it most effectively this quarter.
---
📜 A Little History: The Birth of 💸earning-signal
When QS launched in early April, we started with just two short-term signals:
⏰0dte
📅weekly-options
Both focused on short-term options trades.
Then came TSLA earnings in late April. That’s when we launched our very first 💸earning-signal — and nailed the prediction.
Since then?
We’ve had one of the best earnings win streaks on the internet. Period.
📌 Don’t take my word for it — check:
#✅signal-recap for the track record
#🤑profits and #🤩member-testimonials for real wins from members
---
🤖 Why We Built a Separate Earnings Signal
Earnings are not regular trading days. The dynamics are completely different.
On normal days, a stock might move <1%
On earnings? 10–20% swings are common
This is what we call a “pivot event” — and it requires a different engine to predict.
That’s why we separated:
📅 #weekly-options → normal day-to-day setups
💸 #earning-signal → high-volatility earnings plays
---
🧠 How a Human Would Trade Earnings...
If you wanted to manually trade an earnings report, you’d need to analyze:
Past earnings reactions
Analyst expectations
Earnings call language
Financial statement surprises
Options IV & skew
Post-earnings stock behavior
This would take hours (or days) — and most retail traders don’t have time.
---
⚙️ How QS AI Does It Instead
We built 💸earning-signal to do all that work for you — and more.
✅ It pulls in all the data above
✅ Runs it through 5 top LLM models (each acts as an independent analyst)
✅ Aggregates their insights + calculates probability-weighted direction & strategy
✅ Uses fine-tuning to learn from its past prediction success/failures
This means: faster decisions, deeper insights, and better accuracy — every week.
We don’t just run predictions. We let the AI learn from past mistakes and self-improve each quarter.
---
💥 Results Speak for Themselves
Last season, we nailed:
TSLA
MSFT (10x–20x winners!)
NVDA
AAPL
And many more...
All based on this unique AI-driven earnings analysis stack.
This season?
We’re going harder, faster, and even smarter. 📈
🎯 The goal is clear:
Make 💸earning-signal the #1 earnings prediction system in the world.
---
🧩 Final Notes
Earnings are 10x harder to trade than regular days
But with QS, you’re equipped with 500x the speed and insight of an average trader
Upgrade if you haven’t yet: #💰upgrade-instructions
Earnings season kicks off next week
Let’s get it.
Let’s win big.
Let’s make season 2 of 💸earning-signal our most legendary yet. 🚀💸

Netweb-a breakout stock to watchNetweb has recorded stellar quarterly results- double digit earnings and revenue growth YoY. But stock has not performed since market was unfavorable and it has stored pent up energy of strong earnings backing. Now stock has reached a resistance zone on daily chart that too with a humungous volume. Today its quarterly earnings were announced and yet again stock has delivered very good results. It's a good breakout stock to watch.

TSLA Drill Team is Back
Against the background of everything that is happening, from a fundamental point of view, Tesla is facing significant headwinds as we approach its Q1 2025 earnings.
A 13% year-over-year decline in deliveries, ongoing margin pressures from price cuts, and negative consumer sentiment tied to Elon Musk’s political involvement are weighing on the company.
While the energy segment and potential updates on the affordable vehicle could provide some upside, the risk of a disappointing earnings report looms large, potentially exacerbating Tesla’s challenges in a competitive EV market.
Technically
We see that the price is consolidating near the lower boundary of the golden pocket on the FIBO channel on the 1-hour chart. For a few days now, the price has been holding just above the 240.00 support level, but the bearish trend remains dominant with 23 out of 26 technical indicators signaling bearish sentiment as of April 20, 2025.
Entry SHORT around 240$ targeting 220$
Post-earnings, we could see a breakdown below 220.00, targeting the next support at 216.00, from which the future prospects will depend.
Resistance levels: 270, 250, 240
Support levels: 220, 216, 210
The price is struggling to break above the resistance, consolidating over days. With earnings on Tuesday, there’s a high probability of a breakdown if the report misses expectations or lacks clear guidance on growth initiatives.
A break and consolidation below 230.00 could lead to a decline toward 220.00 or even 210.00 in the coming week.
However, if Tesla surprises positively—particularly with strong energy segment growth or clarity on the affordable vehicle—we might see a reversal. Still, the current setup suggests caution, and we’ll need to monitor the price reaction closely post-earnings.
Keep your long term vision NASDAQ:TSLA

A Long-term Bullish Trend ?With an upcoming Earnings report we can observe rather uncertain future behavior.
But since the trend has been bearish for a longer period of time and the price is "nearly" at the same position which was achieved for the first time in early April in 2019, we can, mostly based only on the technical analysis and Earnings report, determine quite confidently that the price is ready to rise.
Important data:
EPS Estimate: -$3.12
Revenue Estimate: $106 million to $166.7 million
Notable developments:
Cost-cutting initiative = Targeting $1.1B in reductions by 2027
By the end of 2024 $9.5 billion allocated in investments

IBM Earnings PlayTechnical Analysis NYSE:IBM
On the 4-hour chart, IBM’s stock price is currently trading at approximately $260.50. Applying Bollinger Bands, the price is hovering near the 20-period moving average, with the bands moderately contracted, indicating relatively low volatility. The stock has shown resilience above the lower Bollinger Band, suggesting potential for an upward move if bullish momentum builds post-earnings. A recent green candle indicates buying interest, but the stock remains below the upper band, which sits near $270.00, signaling room for upside if catalysts align.
Target
Wait for bullish confirmation post-earnings.
Entry LONG : Around $262.00, Targeting $270.00.
Secondary Target: $275.00.
Resistance Levels: $265.00, $270.00, $275.00.
Support Levels: $255.00, $250.00, $245.00.
The price is testing the 20-period moving average, and a strong earnings report—particularly with positive AI or cloud revenue updates—could push the stock toward the upper Bollinger Band at $270.00 or higher. Conversely, a disappointing earnings report or weak guidance could see the price drop toward $255.00 or lower, especially if broader market conditions weaken.
QuantSignals
Best AI news analysis and signals

Breaking: nCino, Inc. (NASDAQ: $NCNO) Tanks 33% In Premarket nCino, Inc., (NASDAQ: NASDAQ:NCNO ) a software-as-a-service company, that provides cloud-based software applications to financial institutions in the United States and internationally saw its shares plummet 32.93% in Wednesday's Premarket trading amid slowing growth in cloud banking and mortgage markets.
nCino shares slumped in after hours trading Tuesday (April 1) extending the loss to Wednesday's (April 2) premarket trading in the wake of guidance that anticipates slowing growth in the core cloud banking segments and mortgage markets, though a reacceleration is envisioned for fiscal year 2027.
in the current fiscal year (2026) first quarter, top-line growth should be in the high single-digits year over year, to a range of roughly $139 million to $140.7 million, which would be a slowdown from the 14% growth rate notched in the most recent quarter. Fiscal year guidance also disappointed investors, who sent the shares down by 28%.
The company also announced the appointment of Sean Desmond as CEO, succeeding Pierre Naudé, who becomes executive chairman.
Financial Performance
In 2024, nCino's revenue was $540.66 million, an increase of 13.45% compared to the previous year's $476.54 million. Losses were -$37.88 million, -10.55% less than in 2023.
Analyst Forecast
According to 13 analysts, the average rating for NCNO stock is "Buy." The 12-month stock price forecast is $40.38, which is an increase of 43.60% from the latest price.
Technical Outlook
As of the time of writing, NASDAQ:NCNO is down 32.93% in Wednesday's premarket trading. the asset's daily price chart depicts a bearish pennant or a bearish symmetrical triangle that resorted to the 33% dip. NASDAQ:NCNO shares close Tuesday's session with a RSI of 39.77 which is weaker for a trend reversal and also potent for a continuous trend.
There is a possible chance of a gap down pattern evolving which is a very strong bearish pattern. For now investors will have to wait for a favourable grounds mostly likely the 25 RSI pivot to capitalize on the dip.

General Mills, Inc (NYSE: $GIS) Set to Report Q3 Earnings TodayGeneral Mills, Inc. (NYSE: NYSE:GIS ) manufactures and markets branded consumer foods worldwide is set to report Third Quarter Earnings results today before market opens. With shares moderately up 0.85% in Wednesday's premarket trading.
Founded in 1866 and headquartered in Minneapolis, Minnesota. The company operates through four segments: North America Retail; International; Pet; and North America Foodservice.
Financial Performance
In 2024, General Mills's revenue was $19.86 billion, a decrease of -1.18% compared to the previous year's $20.09 billion. Earnings were $2.50 billion, a decrease of -3.75%. As investors awaits for the earnings reports NYSE:GIS shares are also waiting for build up momentum to surge breaking above the 1-month high acting as resistant point.
Similarly, should NYSE:GIS faced selling pressure, the 65% Fibonacci retracement level acting as support point would broken leading to consolidatory move to the 1-month low albeit the stock is still bearish at the moment with only Gold surging to new All time high yesterday.
Analyst Forecast
According to 17 analysts, the average rating for GIS stock is "Hold." The 12-month stock price forecast is $66.13, which is an increase of 9.41% from the latest price.
