Bitcoin below 200‑day: Buy the dip or more downside?Bitcoin slid with US risk assets, and a clean break below its 200‑day average puts the 100K support in play right now.
October’s Challenger report showed the biggest monthly job cuts in over two decades, souring sentiment and knocking cryptos alongside equities as traders reassessed near‑term Fed risks.
Weak risk tone plus key technical breaks drove a second wave of selling after the early‑October crypto drawdown, keeping focus on whether 100K holds for Bitcoin.
Key drivers:
Macro shock: October layoffs surged to a 20‑year high, fuelling risk‑off and trimming rate‑cut confidence into year‑end.
BTC technical break: price slipped under the 200‑day, and 50‑day momentum is fading; 100K is the first line of defence, then 92–94K if it fails.
Moving averages are lagging: watch daily closes around these levels rather than one intraday pierce; breadth below long MAs warns of weak trend strength.
Trade the levels, not the noise: defend 100K on BTC for bounce attempts. A daily close below turns focus to 92–94K on BTC before stronger supports.
This content is not directed to residents of the EU or UK. Any opinions, news, research, analyses, prices or other information contained on this website is provided as general market commentary and does not constitute investment advice. ThinkMarkets will not accept liability for any loss or damage including, without limitation, to any loss of profit which may arise directly or indirectly from use of or reliance on such information.
Elliott Wave

$BTCUSD: Inside an ending diagonalBITSTAMP:BTCUSD : I believe this is an expanded flat correction for a Wave ii since the July 2025 high. The expanded flat has completed Wave A down to the August 2025 low, Wave B up to the Oct 6 high and we have been in an ending diagonal for Wave C of this ending diagonal since Oct 6.
The ending diagonal has completed 3 waves at the $98K-ish low. We're now in Wave 4 to the trendline (probably above $107K). Afterwards, I expect a Wave 5 down as the very last leg of this correction since the July 2025 high. Wave 5 in an ending diagonal can be truncated. So I'm guessing, after reaching the down-sloping trendline to complete Wave 4, a pullback to between 50% retracement (between $104K to slightly exceeding $98K) would end the entire correction and start Wave III up to new ATHs.

$BTC/USD looking for this bullish harmonic to finishBITSTAMP:BTCUSD : Bitcoin is close to the trendline touch. It would also correspond to NASDAQ:MSTR completing an ABC flat correction.
If the BTC bull market is to continue, this trendline needs to hold. The Elliot Wave count would be having completed Waves i, ii of Wave IV, completed wave (i) of Wave iii of Wave V and we're in wave (ii) correction of Wave iii of Wave V.
Wave (ii) have retraced 50% of Wave (i), which is pretty standard. It is an expanded flat.
Things do line up and I expect BTC to bounce from the trendline. And NASDAQ:MSTR may also have bottomed from sub $230 spiking down.

NZDCHF; lower than higher for a long timeMy interpretation of Elliot Waves for NZDCHF on a weekly chart.
Around October'23 I lost hope of NZDCHF going lower due to price closing at the 50% fib retracement. In my observation when price closes at a 50% fib retracement - that is the reversal point. I thought Aug'23 was wave 3 and Oct'23 wave 5...I thought I missed the low. But the sideways move for wave gave me hope.
I'm expecting a lower low for NZDCHF to complete wave (5) of (V) or V which is in line at the 1.618 area

Mad bullsPotential wave 3 move
From the characteristics of wave theory wave 3 are always swift and strong
Let's watch and try not to miss out if this is a wave 3 move

Potential ETH rallyWith a clear break and retest of weekly trend line.
A possible potential wave C or wave 3 rally
We might be heading for a strong bull move across all alt coins

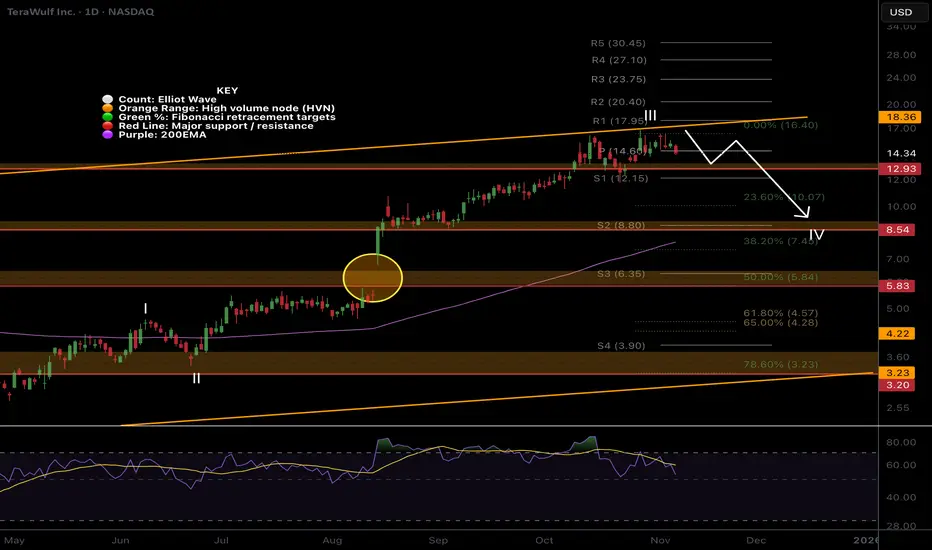
WULF pullback on the cards!Price is struggling at the trend-line boundary on bearish divergence suggesting wave III is complete and wave IV is soon underway.
Due to the size of the rally wave IV could be deep. The usual 0.382 target is down at $8 where it would meet the daily 200EMA.
Daily RSI has printed bearish divergence in overbought.
breaking out above the trend-line could be extremely bullish.
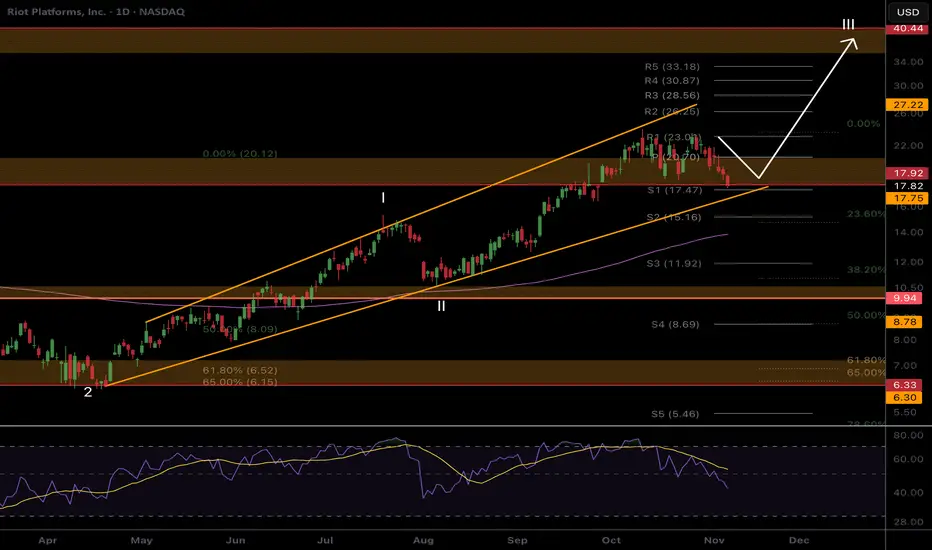
RIOT Respecting the boundariesPrice remains in its uptrend channel demonstrating shallow pullbacks as is characteristic of wave III.
Price is consolidating above support which could lead to a break down below but still within the boundaries of the channel. Daily 200EMA is ascending to meet price and support lines.
Daily RSI has printed unconfirmed bullish divergence at the EQ.
Continued upside has a $40 target at the next High Volume Node.
MSTR further downside but looking exhaustedNASDAQ:MSTR Price continues range bound in a complex wave 4 correction, notoriously hard to analyse. The trend is down but looks exhausted.
Wave Y can complete any time in this flat correction pattern but is approaching the previous swing low and the 0.236 Fibonnacci retracement.
Daily RSI has printed bullish divergence but price continues lower. IF pice breaks down further the next target is $185 where price may find a bottom.
Recovering the daily 200EMA is the first goal.

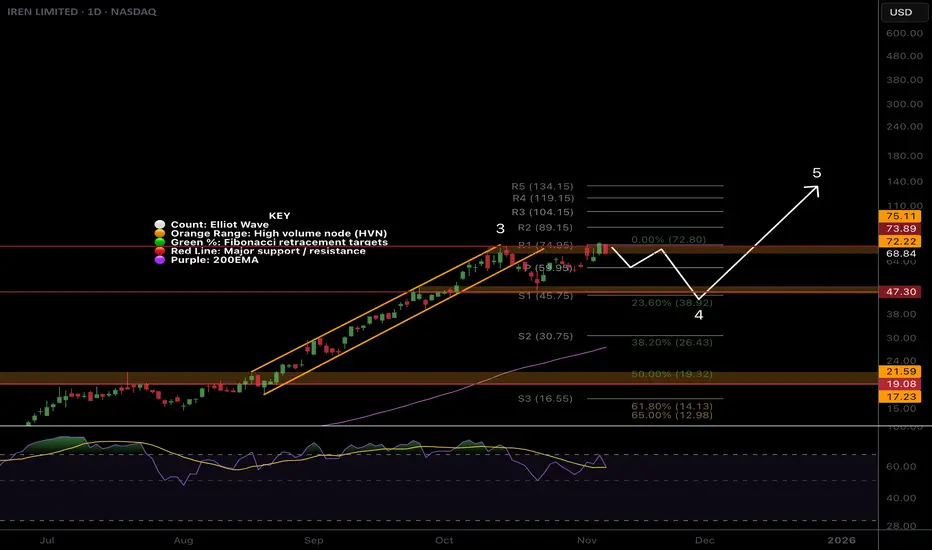
IREN pullback on the cardsNASDAQ:IREN is breaking out again on huge candle spread, though I am skeptical of continued rally from here without a pullback first. For now the trend is up.
Price has broken out of its momentum channel and formed a range so I am expecting the excitement to trap late comers and traders with a swift reversal in wave 4. Initial downside target is $47 at the High Volume Node and .0236 Fibonacci retracemenet. Stronger downside momentum could test the rising daily 200EMA at the 0.382 Fibs.
Daily RSI has printed unconfirmed bullish divergence at the EQ.
Continued upside keeps us looking at the pivot targets.
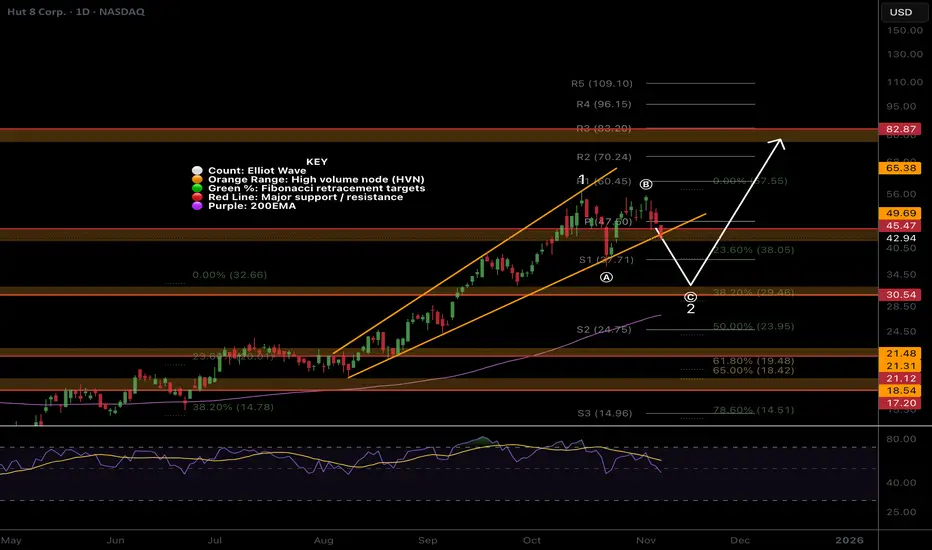
HUT Within channel boundary, all fine locallyNASDAQ:HUT Wave 1 appears complete at the channel upper boundary on bearish divergence.
For now the probability is to the upside and the trend is in tact. However, wave (B) of 2 looks complete. Wave C is expected to be strong and scary, capitulating many. Price is expected to terminate at the 0.382 Fibonacci retracement, High Volume Node support and rising daily 200EMA.
Daily RSI has printed bearish divergence from overbought but also bullish divergence at the EQ. This is ambigous.
Continued upside has a target os the $82 High Volume Node resistance.
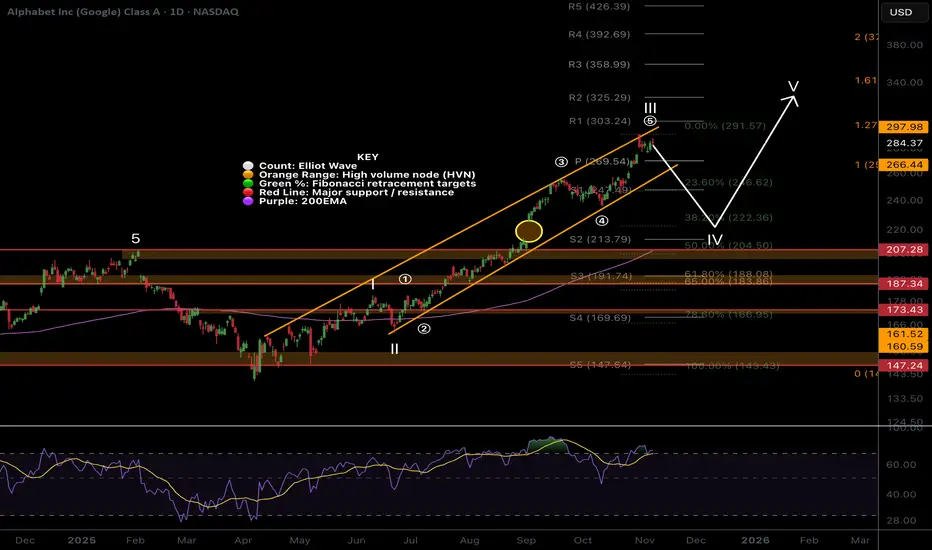
Google pullback still in play, local chartWave III continues but price looks exhausted and may trap late investors causing them to capitulate lower later.
Wave (5) of III is likely to complete with a throw-over of the upper channel boundary. Wave IV has an expected retracement target of the 0.382, $222, filling the gap left and meeting the daily 200EMA.
Daily RSI has printed bearish divergence from overbought.
Continued upside hasa target of the R3 pivot, $358.
Coinbase wave C underway NASDAQ:COIN Price appears to be completing wave C of IV, a corrective pattern to the downside expected to be shallow.
Wave IV are often shallow ending no further than the 0.5 Fibonacci retracement. This is just below the S2 pivot and High Volume Node support. 0.382 is the higher probability target for the end of the downwards move aligning with a swing below the daily 200EMA and S1 pivot.
Daily RSI has room to fall.
Breaking wave B would suggest a new bull move is underway.

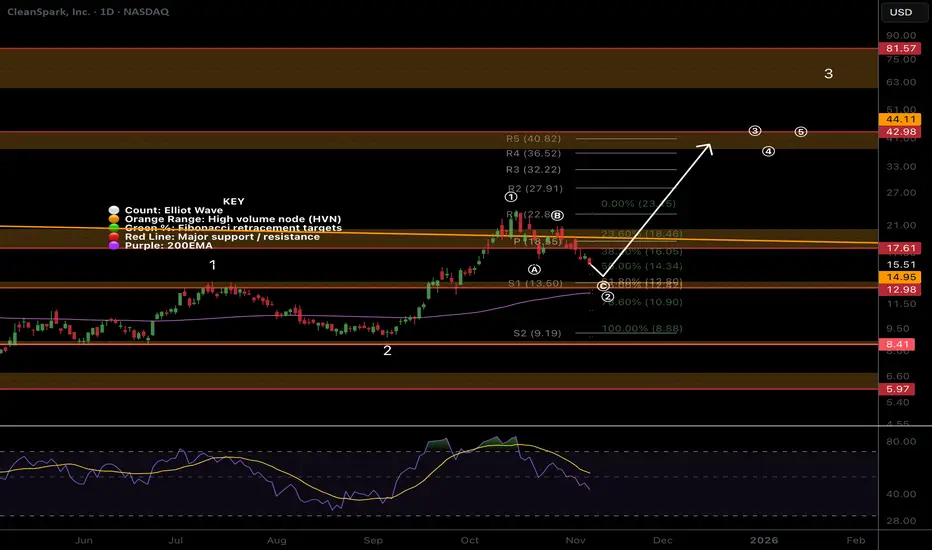
CLSK Local analysis, pullback does not violate larger trendNASDAQ:CLSK Price is pulling after a failed breakout falling back into the macro triangle. Behaviour appears to be a textbook corrective ABC which should end with one more thrust down to the S1 pivot before continuation to the upside.
Wave © can be strong and powerful, often where investors capitulate. The target is the High Volume Node support, rising daily 200EMA, Fibonacci golden pocket and S1 pivot.
Daily RSI has room to fall.
Breaking above wave (B) would suggest the correction is over.
CIFR Pullback time?NASDAQ:CIFR Locally, price continues into price discovery with big jumps suggesting wave 3 is still going Wave (5) of 3 appears to be underway which could end at any moment. I am still expecting a retracement to test the previous all time high and punish late investors who are chasing prices up, trapping them into capitulation later.
Wave 4 has a downside target of the 0.236 Fibonacci retracement, High Volume Node support + the trend-line retest, $14. This may also meet the ascending daily 200EMA.
Daily RSI has a series of bearish divergence from overbought which a strong signal for a reversal.
Continued upside could run the daily pivots to $38.

BTDR Consolidation below support often leads to a breakoutNASDAQ:BTDR Locally, price is struggling at the expected High Volume Node resistance but without a major rejection. Consolidation below resistance often leads to a breakout
Wave (3) characteristics are being followed with shallow pullbacks so far. The target for a stronger downwards move is the golden pocket and S1 pivot at $17 which would meet the rising daily 200EMA, adding confluence to a local bottom. This would be normal and should be expected.
Daily RSI has printed unconfirmed bullish divergence at the EQ.
Continued upside would flip $25 resistance into support.

GBP/USD Double Correction Nears CompletionThe Bank of England’s decision to leave rates unchanged at 4.0% may look uneventful—but beneath the surface, it’s unmistakably dovish.
Governor Andrew Bailey’s tone and the 5–4 vote split suggest a December rate cut is now firmly on the table. The key line in the statement — that inflation risks are now “more balanced” — marks a subtle but significant shift in the Bank’s stance.
With two more inflation reports and the Autumn Budget still to come, the data path likely cements that dovish tilt. We expect headline CPI to drift toward 3.5%, while fiscal tightening from the Treasury adds another easing-friendly layer.
Markets have taken note:
Gilts steepened bullishly
Sterling softened modestly
This aligns with expectations for Bank Rate to fall to 3.25% by next summer — right in line with Bailey’s recent comments.
Technical View: GBP/USD Double Correction May Be Over
On the chart, GBP/USD appears to have completed a W–X–Y double complex correction within a broad descending channel.
The final leg (wave (y)) bottomed near 1.3050, aligning with the lower channel boundary.
The RSI (14) reading around 33 shows oversold conditions, hinting that bearish momentum is fading.
A bullish turnaround could now unfold, with upside targets at 1.3350 → 1.3450 → 1.3500 if the pair holds above 1.3050.
In short, while the BoE’s dovish pivot may cap Sterling’s long-term potential, the technical setup suggests a short-term rebound is brewing.

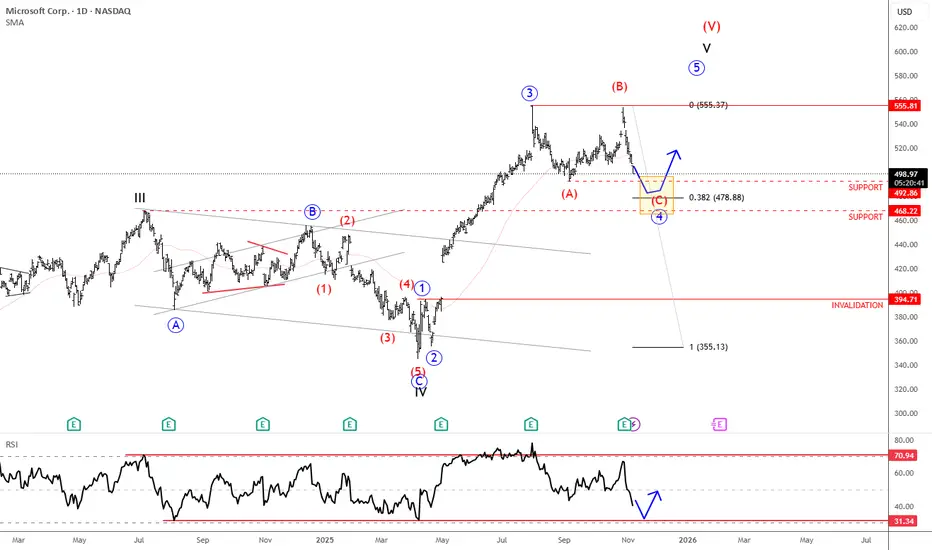
Microsoft Is Finishing Wave 4 CorrectionMicrosoft is in a wave 4 correction, and once it's fully completed, it can extend the rally within wave 5 from a technical point of view and according to Elliott wave theory.
Microsoft is a global technology company founded by Bill Gates and Paul Allen in 1975. It’s best known for its Windows operating system, Microsoft Office suite, and cloud platform Azure. Over the years, Microsoft has expanded into gaming (with Xbox), professional networking (LinkedIn), and AI (through partnerships like OpenAI). Today, it’s one of the world’s most valuable and influential companies, shaping software, hardware, and cloud computing industries.
Microsoft reported earnings last Wednesday after the close, with the price turning lower after reaching new highs. The structure still appears to be a wave four in progress — a flat correction where the current drop likely represents wave C. Wave C often stabilizes near wave A levels, suggesting support around 492 and 468 (the former 2024 high). Holding this zone could set up the next rebound into the final higher-degree wave five.
Highlights:
Trend: Corrective phase, wave C of flat in progress
Potential: Rebound toward new highs once support holds
Support: 492 / 468
Invalidation: Below 394
Note: Watch for stabilization at support before potential wave five continuation
EURUSD Technical Setup – Bullish Move Incoming?EURUSD ( FX:EURUSD ) is currently positioned near the lower line of a potential descending channel and is hovering around a Support zone($1.1542-$1.1514) . There's also a smaller descending channel that formed last week, which is something we should consider in our EURUSD analysis .
There's a Regular Divergence (RD+) between the two recent lows that EURUSD has made, which is a good sign of a possible reversal.
In terms of Elliott Wave theory , it appears that EURUSD has completed the main wave 5, with the main wave 3 being an Extended wave . A break of the upper line of the descending channel(small) could confirm the end of the main wave 5.
I expect that EURUSD could at least move up toward the next Resistance zone($1.1586-$1.1575) .
Second Target: $1.1597
Stop Loss(SL)= $1.14857
Please respect each other's ideas and express them politely if you agree or disagree.
Euro/U.S. Dollar Analyze (EURUSD), 1-hour time frame.
Be sure to follow the updated ideas.
Do not forget to put a Stop loss for your positions (For every position you want to open).
Please follow your strategy and updates; this is just my Idea, and I will gladly see your ideas in this post.
Please do not forget the ✅' like '✅ button 🙏😊 & Share it with your friends; thanks, and Trade safe.

XAUUSD outlookPossible double zig-zag with a triangle X wave. After successful completion of the triangle expect a continuation to the downside

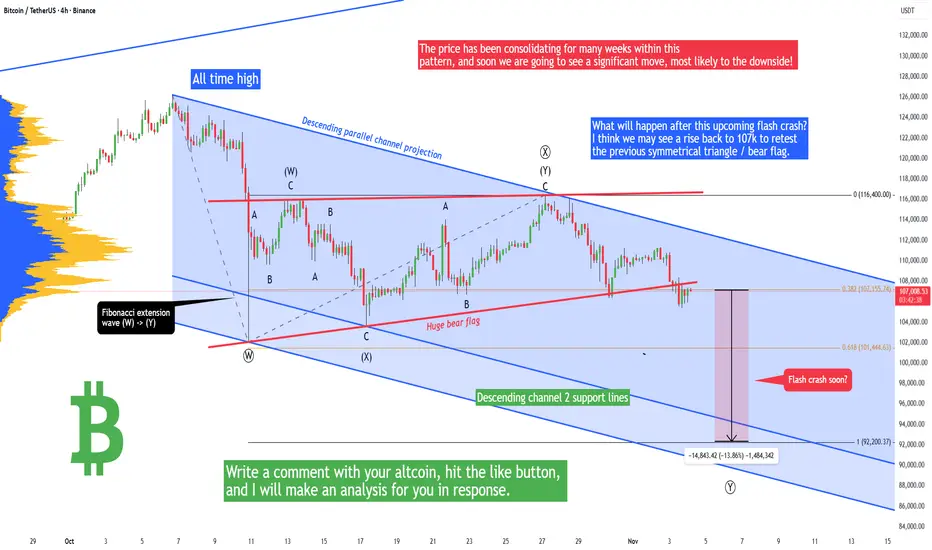
Bitcoin - Warning! Flash crash soon (BEAR FLAG)Bitcoin recently formed a symmetrical triangle, but the bulls made a false breakout above it, which is a huge problem because this symmetrical triangle pretty much transformed into a bearish flag, and that's a very bearish pattern! The price has been consolidating for many weeks within this pattern, and soon we are going to see a significant move, most likely to the downside!
This can be your last warning - otherwise, you can get liquidated in the upcoming days. You can still open a short position on futures if you want to make money on this move. What is the target of this bearish flag? To answer this question, we have to use a Fibonacci extension tool and look for the 1:1 FIB extension (92,200 USD). But what we cannot miss is this descending parallel channel projection and its support trendlines. There are pretty much 2 trendlines that act as a dynamic support (support changes with time). Support levels of these trendlines are currently around 95k and 90k. So this gives us an idea that Bitcoin should react to this zone (should be a great buying opportunity). There is also a minor support of 101,444 (0.618 FIB extension), this is indeed a weak support in this particular case, and I expect only a small bounce from this level.
What will happen after this upcoming flash crash? I think we may see a rise back to 107k to retest the previous symmetrical triangle / bear flag. Altcoins are bleeding again. If you want to know more information about your altcoin, then write a comment with your altcoin + hit the like button, and I will make an analysis for you in response. Trading is not hard if you have a good coach! This is not a trade setup, as there is no stop-loss or profit target. I share my trades privately. Thank you, and I wish you successful trades!
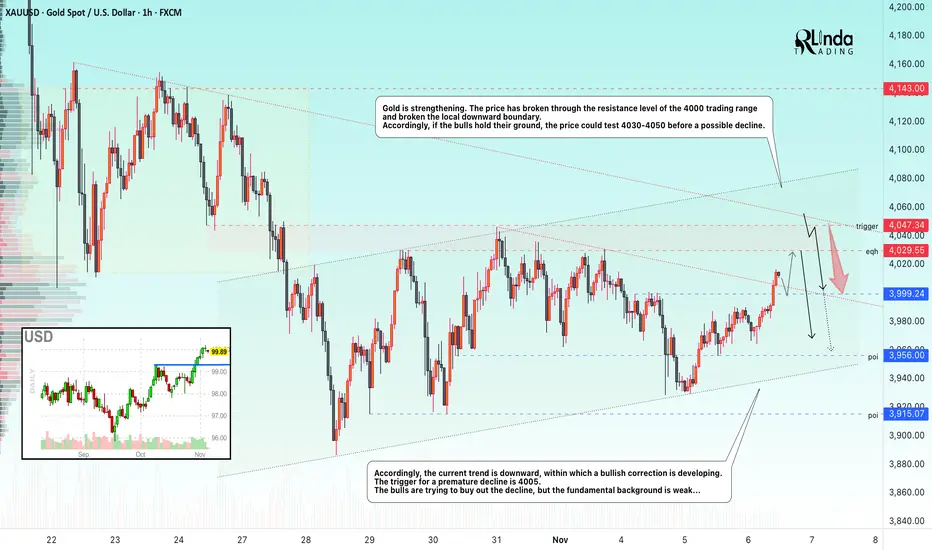
GOLD → The market is trying to buy back the decline...FX:XAUUSD continues to consolidate in the $4000 zone, failing to develop a rebound in the middle of the week. The price remains in a sideways trend for the eighth day in a row, waiting for a driver that will finally move the price forward...
Reasons for market restraint:
Strong US data: growth in ADP private employment, growth in the ISM services business activity index, lower odds of Fed easing, the probability of which has fallen to 62% for December...
However, the ongoing government shutdown and the delay in employment and inflation data are supporting the metal...
Gold is looking for new catalysts. A break above $4030-$4050 will require weak US data or an escalation of risks, which is not currently the case.
Resistance levels: 4030, 4050
Support levels: 4000, 3967, 3955
As the specified resistance is reached, the potential for further growth may be exhausted, and in this case, a false breakout could lead to a correction to 4K. However, if support does not hold the decline, this phase could last much longer. I am not yet talking about further growth beyond 4050, as the fundamental background is weak and there has been no reaction to this zone yet, since the price is still far from the level...
Best regards, R. Linda!
BITCOIN → The hunt for liquidity before the decline BINANCE:BTCUSDT is testing the 100K area and updating its local minimum to 98,900 as part of another liquidation. The market is weak, and bulls are trying to wait out the panic...
Bitcoin looks weak. After a sharp decline, a pullback is forming, during which the price may test the break-even and interest zones — previously broken support areas. Buyers are not yet showing themselves in the market...
There is an intermediate bottom at 98,900, as well as the upper limit of the local range at 105,200. The range of 105,200 - 107,200 - 108,200 is important because it hides a pool of liquidity for a downward movement. MM may reach these zones and bring the price back into the trading range.
Resistance levels: 105,182, 107,271
Support levels: 101130, 98900
A retest of resistance at 105182 and the lack of potential for continued growth may confirm the fact of a false breakout, which in turn may provoke a fall to local targets. I do not rule out the possibility that the price may go even higher, for example, to 107270 - 108200. I do not see any point in waiting for a trend reversal yet...
Best regards, R. Linda!
