EUR/USD is positioned at the top of two long-term channelsAs you can see, EUR/USD OANDA:EURUSD is currently testing the upper boundary of two major channels on both the weekly and daily timeframes.
1) Daily Timeframe Analysis
On the daily chart, the dollar completed a five-wave impulsive move into the channel’s upper resistance.
After reaching this level, price has started a correction.
Wave A has already finished with a clear five-wave structure.
Price is now forming wave B.
Based on the current structure, wave B is likely to extend:
At minimum, into the Gap Zone, and
At maximum, into the Resistance Zone
(both areas are clearly marked on the daily chart).
From either of these areas, I expect the beginning of wave C, which will likely push the pair down toward the Support Zone.
2) Weekly Timeframe Confirmation
In the weekly chart (Chart B), EUR/USD has reached:
The top of its major ascending channel, and
The 100% extension of the previous leg.
This confluence significantly strengthens the bearish scenario.
3) Additional Charts Coming
I will also upload the hourly EUR/USD chart on my TradingView page to provide a clearer and more detailed outlook.
4) Follow for More Analysis
Feel free to follow me on TradingView to catch all my analyses and live stock trades.
I’d be happy to hear your thoughts and feedback.
Elliott Wave

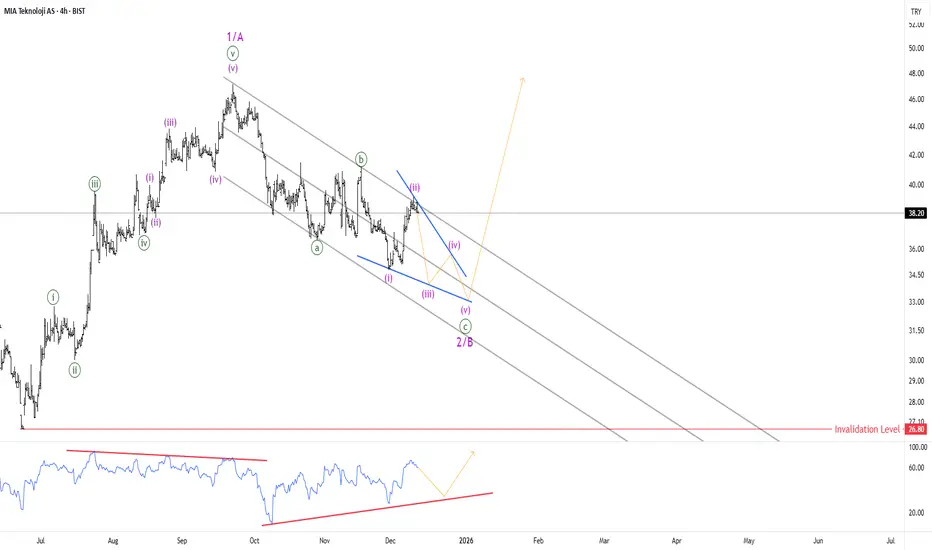
MIATK about the end abc correction after 5 waves upTurkish stock MIATK has completed 5 waves up now it's making it's correction in the shape of Zig-Zag.
WBD - Upside PotentialWe assess the situation strictly from a technical perspective and focus on what the future price action may look like.
At this stage, the current upward movement is approaching its completion.
The technical picture points to potential upside into the 35 area.

GBTC is hinting a major bottom soon on BTC!AMEX:GBTC
– Elliott Wave Update (1H Chart)
The decline from the Wave B high continues to follow a clean 5-wave impulse. Current price action suggests we are inside Wave (iv) before the final flush.
🧩 Structure so far:
🔻 Wave (i)
• Initial sharp drop
• Set the tone for the entire downtrend
🔻 Wave (ii)
• Reactive bounce into the mid-channel
• Perfect retracement behaviour for an impulse
🔻 Wave (iii)
• Long, persistent decline
• Strongest momentum segment
• Clean subdivisions visible on lower timeframes
🔵 Wave (iv) now forming:
• Grinding upward inside the corrective channel
• Should remain below upper channel resistance
• Likely forming a flat / zigzag corrective before rollover
🔻 Wave (v) expected next:
• Final leg down to complete C
• Target = lower channel + 60–62 region
• Completion of the larger corrective cycle
🟢 After Wave C completes:
• Expect a medium-term trend reversal
• First target = reclaiming broken channel lines
• Bigger target = recovery toward prior structure above 90+
📌 Summary:
Wave (iv) = corrective bounce.
Wave (v) = final drop → then macro reversal likely. ⚡
I am overall bullish on CRYPTOCAP:BTC after this drop. Please check my
BTC update here.

Ena spot planmade huge gains from this coins trading it from wave C to D
now the wave D has topped looking for wave E to hit my minimum target and then fly to moon
Entry Tp and Sl are mentioned in Chart

Ethereum short: Completed triple combinationIn this idea, I showed the following:
1. Updated Elliott Wave counts showing the triple combination as sub-wave 2 of 3
2. That sub-wave 2 of 3 ended at the resistance created by the low of wave 1.
3. 3 different prices where support for Ethereum can be found, with the last being the target for this idea.
4. Stop loss above sub-wave 2 of 3 high.
Good luck!

Gold (XAUUSD) – Possible Triangle Into Final Push HigherPrice action is developing a contracting ABCDE triangle after completing the previous corrective leg. As long as the Invalidation Level holds, the structure favors a bullish continuation.
📌 Key Elliott Wave Notes
Wave A–B–C completed
Wave D expected to retest resistance
Wave E pullback forms the final leg of the triangle
Breakout above triangle should launch Wave (v) / (5) higher
🎯 Bullish Target Zone
4,350 – 4,380 area remains the next major resistance & profit-taking zone.
❗ Invalidation
Break below the STRUCTURE LOW (marked “Invalidation Level”) negates the triangle and suggests deeper downside.
📈 RSI
Bullish divergence forming on the lows supports triangle exhaustion.
Idea Summary
While price stays above support, look for a breakout after completion of wave E targeting the higher supply zone. If support fails, reassess the wave count.

max pain in sight for the bullsgm,
i've been entertaining a few ideas on btc, and this one comes to mind today.
the possibility of 1 more leg down, to take the rest of the longs that fomoed into the rally this week, and the few who managed to survive the drop from ath by averaging down mindlessly.
---
the way we bounced is very reminiscent of a wave 4.
btc is teethering on the edge of a negative funding rate (our favorite contrarian indicator)
by creating one more low, we will for certain print a massive, multi-week negative funding reading, and that's when a proper buy could take place.
---
i have personally decided to fade the rally, and have de-risked quite substantially from the positions i managed to pick up near the lows.
---
in my opinion, the path of maximum pain is a sweep of that notorious 75k level that everyone keeps talking about.
---
---
🎯 - 75k

eth is poised to go below 2k into january.gm,
as we near the holidays, and many people begin to believe that the bottom is in,
i see a scenario that few are discussing.
all i hear these days is how qe is beginning, how rates are getting cut, and how crypto adoption is taking place globally, but the price action does not reflect this sentiment, yet.
the main reason for this, in my opinion, is i believe we're in a corrective move; specifically, the 4th wave, of this 5 waves down from the recent all time highs.
---
4th wave are categorized the moves which trap the most amount of traders. they create uncertainty, after an already long downtrend, and people start entering into a state of hopium \ complacency one final time before the last flush out takes place in the trend.
that flushout, is designed to push all of the complacency and hopium out of the market by a large institution, who preys on the stops + liquidations of the small traders for liquidity purposes.
---
which brings me to my point here;
i believe ethereum will sweep the november low one more time, before some sort of sustained uptrend begins. whether that uptrend will be corrective, or impulsive will be determined by how we begin to come up. i have a few theory-crafts about what this move down could be, and even how it could be marking the end of a flat, rather than the beginning of the highly anticipated bear market that everyone keeps talking about.
---
🎯 = low 2k region

SMH Is In Wave 5 Extension as Semiconductors Aim for 400 AreaSMH is the VanEck Semiconductor ETF, giving concentrated exposure to major global semiconductor companies like NVIDIA, TSMC, and Broadcom. It holds about 25 stocks and is known for higher volatility because a few large chipmakers dominate the fund. Investors use SMH to bet on long-term growth in chips, AI, and tech hardware, but it can swing sharply due to the cyclical nature of the semiconductor industry.
VanEck Semiconductor ETF (SMH) is trading within a five-wave bullish impulse from the April lows. Based on Elliott Wave theory, the ETF appears to be in the final Wave 5, which can still extend above the October highs toward the 400 area. Short-term pullbacks are possible, but the broader trend remains bullish. With current risk-on sentiment, semiconductor stocks could continue higher into late 2025 or even early 2026.

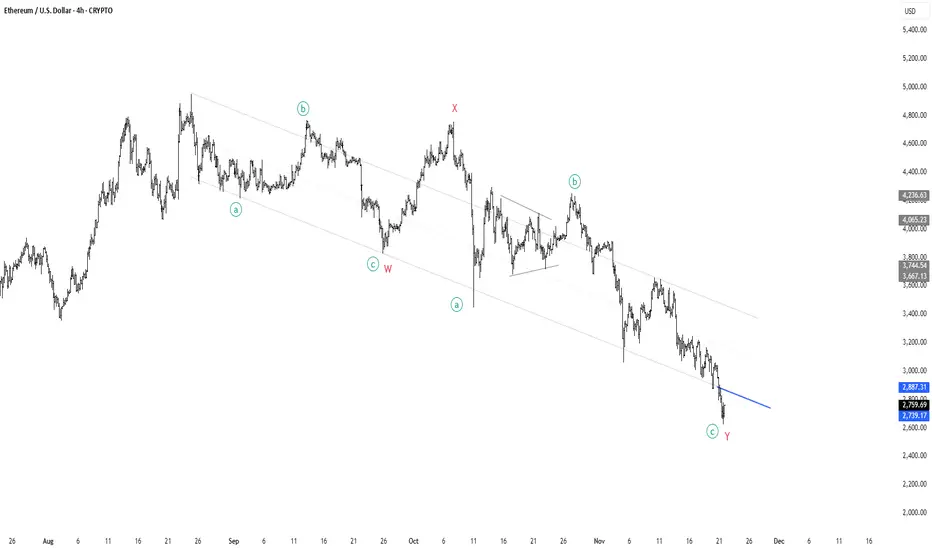
ETH to all time high! Lets go!🚨 ETH Elliott Wave Update 🚨
What we’re looking at here is a clean W-X-Y complex correction unfolding over months — a classic structure when the market wants to correct deeper without breaking the macro trend.
• Wave W completed with an ABC decline
• Wave X gave us the relief rally everyone thought was the bottom ❌
• Wave Y extended lower, subdividing into a-b-c, pulling price into the lower boundary of the corrective channel
Now we’re sitting right at the end of minor wave c of Y, the final leg of this entire structure. The pattern is mature, sellers look exhausted, and the downtrend channel is tightening — perfect conditions for a potential reversal.
🔵 The blue trendline is the key.
If ETH can punch through that level with momentum, it confirms the entire WXY correction is complete and opens the door for a major impulsive leg upward.
💥 Break the blue line → reclaim macro structure →
I believe ETH will begin the march toward new all-time highs.
This is where long-term bottoms historically form:
deep structure, clean proportions, fading downside velocity, and a clear invalidation level.
📈 Eyes on the breakout.
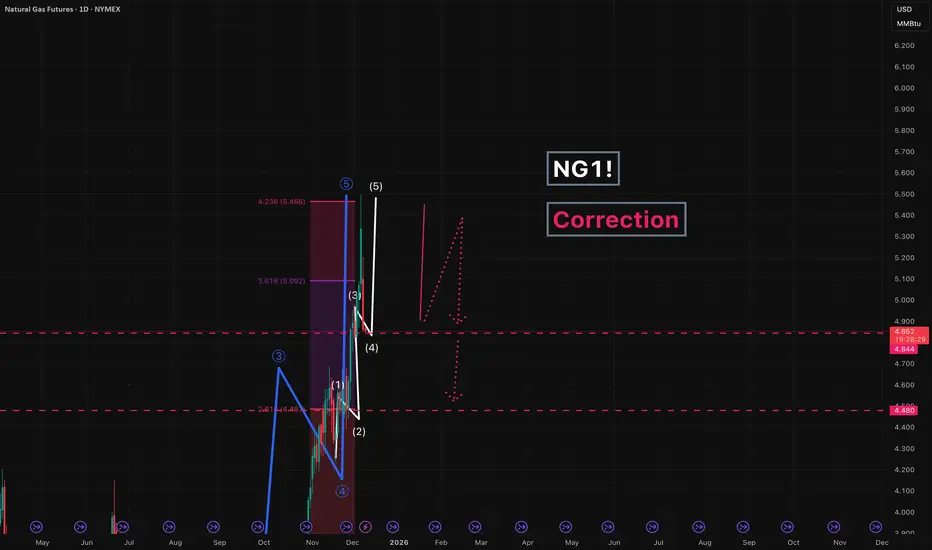
NG1! - correctionWe are currently correcting the impulsive move in Natural Gas.
First, we expect a pullback toward 4.850 (a move that is already in progress), followed by a continuation down into the 4.480 area.
---
Please subscribe and leave a comment.
You’ll get new information faster than anyone else.
---
AAL Breakout, or One More Dip to ~8$?Looks like AAL is on the verge of completing a multi-year correction

DUOL Bullish Cycle?Looks like DUOL may be bottomed hitting 0.786 fib level and TSI turning bullish on 1W
Could be in the very early stages of wave 3 that could eventually complete near $1000 level

Golden Reversal from FVG Zone [XAUUSD]OANDA:XAUUSD Golden Reversal from FVG Zone
Signal: BUYEntry: 4,189.32 (0.618 Fib + FVG zone)
TP1: 4,218.10 (0.382 Fib + VRVP node)
TP2: 4,235.00 (local supply zone)
TP3: 4,260.00 (volume gap fill)
SL: 4,168.83 (below 0.786 Fib + liquidity sweep)
Insights:
Price retraced into a Fair Value Gap near the 0.618 Fib, aligning with a high-volume node on VRVP.
RSI is neutral (~50), suggesting potential for upside momentum; MACD histogram shows early bullish crossover.
Market structure shows BOS to the upside, confirming bullish intent post-liquidity sweep.
#FVGEntry #SmartMoneyBuy #GoldScalpSetup#VolumeConfluence #FibPrecision #HunterSignals
🌟 Trade Like Hunter
✅ High-Probability Setup: Confluence of FVG, 0.618 Fib, VRVP node, and bullish MACD crossover
📊 Risk-Reward Ratio: ~1:2.8 (SL to TP3)
🔑 Liquidity Zone Confirmation: Entry sits inside imbalance zone post-sell-side liquidity sweep
🧠 Market Psychology: Accumulation phase post-BOS, prepping for bullish expansion
⚡ Probability Score: 80% High Probability📈 Scalability: Setup aligns with H1 and H4 structure for multi-timeframe robustness
🔒 Risk Disclaimer: Always use proper lot sizing and risk management. No setup guarantees success—manage trades wisely.

#Banknifty directions and levels for December 10th:What to expect today?
In the previous session, both Nifty and Bank Nifty bounced back after a gap-down start. Structurally, this is a retracement, not a reversal. However, the open interest (OI) data shows a slightly different picture. Nifty still maintains a bearish bias, while Bank Nifty’s OI suggests a slightly bullish sentiment. Usually, this kind of mixed sentiment—Nifty bearish and Bank Nifty bullish—leads to consolidation. So, the market is likely to end the day in consolidation mode.
On the other hand, If the market initially pulls back and then breaks the previous high with a strong candle structure, the bounce back is likely to continue.

#Nifty directions and levels for December 10th:Good morning, friends! 🌞
Market directions and levels for December 10th:
There are no significant changes in the global or Indian markets. The Dow Jones is maintaining a moderately bullish sentiment, while the Indian market indicates a bearish outlook. Today, the GIFT Nifty is expected to open with a neutral stance.
What to expect today?
In the previous session, both Nifty and Bank Nifty bounced back after a gap-down start. Structurally, this is a retracement, not a reversal. However, the open interest (OI) data shows a slightly different picture. Nifty still maintains a bearish bias, while Bank Nifty’s OI suggests a slightly bullish sentiment. Usually, this kind of mixed sentiment—Nifty bearish and Bank Nifty bullish—leads to consolidation. So, the market is likely to end the day in consolidation mode.
On the other hand, If the market initially pulls back and then breaks the previous high with a strong candle structure, the bounce back is likely to continue.

Nikkei Short: Completed Triple Combination (Again)In this video, I discussed the mistake in the previous video, and updated the counts for Wave Z to show the 5-waves structure together with Fibonacci extension. I explained how 1.618x of wave 1 is actually the minimum extension required in order for wave 5 of Z to make a new high.
The stop loss for this idea is above wave Z high and the TP shown is really just a place where we will review the idea. I expect Nikkei to fall to April's low.
Good luck!

$BTCUSD: immediate short term target at $98KBITSTAMP:BTCUSD : I believe CRYPTOCAP:BTC will make a new ATH in 2026. However, whether it will sweep the $80.5K low before going up to ATHs is uncertain.
In Elliot Wave terms, we have completed an abc correction. However, this can be just A of a larger degree ABC or this can be the entire ABC correction.
Either way, in the immediate short term, I see CRYPTOCAP:BTC rallying to $98K+ to complete Wave 1 up or Wave B. $98K is the 38.2% retracement of the entire correction from $126.2K to $80.5K. And there is a measured move AB = CD target of $98.1K.
I expect resistance to be very fierce at $98K.
Wave 1/Wave B can go beyond $98K of course.
But let's not get ahead of ourselves. $94K is still a very strong resistance. The two converging trendlines provided resistance to this rally so far. It took the two converging lines to actually converge for CRYPTOCAP:BTC to get above both. Once $94K is overcome, $96K, then $98K.

Gold - Counting the WavesThe gold chart is highly technical, and its structure can be broken down into both smaller and larger wave formations.
Since late October 2022, gold has completed a classic five-wave advance.
Looking ahead, this is not the full extent of the long-term move — gold still has room to grow.
However, before that, the market needs to correct the upward structure that has already been formed.
First, we need to correct the fifth wave. This process has already begun, and price should dip once more below the 3,900 level.
After that, the entire five-wave structure will also require a broader correction
---
Please subscribe and leave a comment.
You’ll get new information faster than anyone else.
---

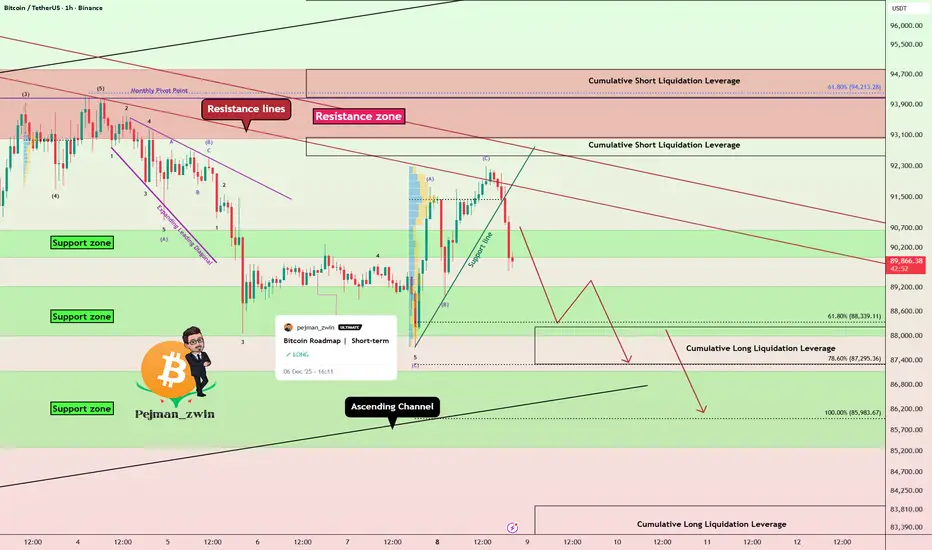
Bitcoin Breakdown After Perfect Bounce — Short Setup LoadingAs I expected , Bitcoin bounced from the support zone and reached its targets.
Right now, Bitcoin has rejected from resistance lines and successfully broke both the support line and the support zone($90,650-$90,000).
From an Elliott Wave perspective, it appears that Bitcoin has completed a ZigZag structure, and we should now anticipate the start of a bearish wave sequence.
The S&P 500 index( SP:SPX ) also shows a bearish outlook, and given Bitcoin’s correlation with SPX, further downside in BTC is not surprising.
At the same time, USDT.D%( CRYPTOCAP:USDT.D ) has turned bullish again—at least in the short term—which can add additional pressure on Bitcoin.
I expect Bitcoin to continue its downward movement, at least toward the next support zone($87,140-$85,290) and the lower line of the ascending channel.
Note: It’s better to wait for a bullish correction before entering, and then take a short position according to your own strategy.
Cumulative Short Liquidation Leverage: $98,260-$96,690
Cumulative Short Liquidation Leverage: $93,040-$92,560
Cumulative Long Liquidation Leverage: $94,840-$94,100
Cumulative Long Liquidation Leverage: $83,900-$82,400
Target: $87,733
Stop Loss(SL): $92,723(Worst)
Points may shift as the market evolves
💡 Please respect each other's opinions and express agreement or disagreement politely.
📌Bitcoin Analysis (BTCUSDT), 1-hour time frame.
🛑 Always set a Stop Loss(SL) for every position you open.
✅ This is just my idea; I’d love to see your thoughts too!
🔥 If you find it helpful, please BOOST this post and share it with your friends.
USDCAD Is Back To Bearish ModeUSDCAD is turning sharply to the downside after last week’s break out of the upward channel, following strong jobs data from Canada. What we see now is a very powerful and strong decline that looks more like a third wave rather than a wave C away from the highs, especially since the price also breached the lower trend-line support of a potential base channel. This puts us in a bearish mode and suggests more weakness in the days or even weeks ahead, as the recovery from June can finally be ending. Expect more downside until we see five waves down from the 1.4139 level. Trend is now bearish while the market trades below 1.40.

GOLD → Price within range ahead of Fed meeting FX:XAUUSD is consolidating within a wide range amid expectations of the Fed's interest rate meeting. The fact that interest rates will be lowered has most likely already been factored in by the market. There is a possibility of a long squeeze...
New threats of tariffs by Trump (on fertilizers from Canada and against Mexico) are weakening the dollar and supporting gold.
As for interest rates, the Fed is expected to cut rates by 25 basis points, but the market has most likely already priced in the cut. Accordingly, there may be countertrend movements (MM traps) to accumulate liquidity before further advances.
Today's JOLTS data on job vacancies may cause increased volatility. According to statistics, before and after interest rate cuts, gold forms a swing correction, within which it may test the support of the range against the backdrop of a bullish trend...
Resistance levels: 4219.5, 4256
Support levels: 4200, 4180, 4163
Ahead is a strong liquidity zone at 4220, and the retest may end in a decline. MM may continue to accumulate liquidity before further advancement. I expect a retest of the range support with the aim of retesting the liquidity pool at 4175-4165 before a possible rise.
Best regards, R. Linda!
