Next impulsive wave up for goldHi traders,
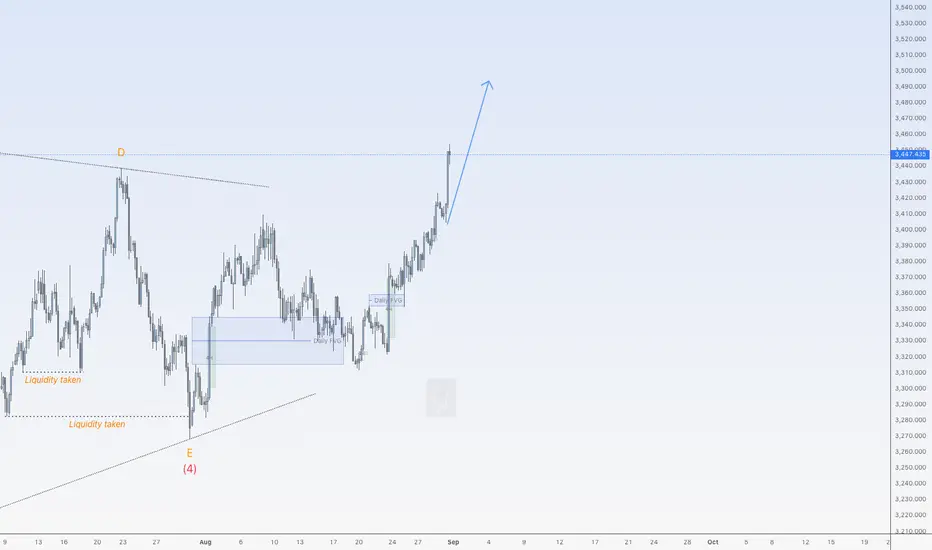
Since my last post gold made a correction up and one more move down just as I've said in my previous outlook. It turned out that wave E was quite impulsive.
After the finish of the correction in the Daily bullish FVG I knew we could see the next impulsive wave up.
So next week the upmove could continue to a new ATH.
Let's see what price does and react.
Trade idea: Wait for a small correction down on a lower timeframe and a change in orderflow to bullish to trade longs.
NOTE: The next three weeks I'm on holiday so I will not post any outlooks publicly.
If you want to learn more about trading FVG's & liquidity sweeps with wave analysis, please make sure to follow me.
This shared post is only my point of view on what could be the next move in this pair based on my technical analysis.
Don't be emotional, just trade your plan!
Eduwave
Elliott Wave
Impulse wave up for SPX500USDHi traders,
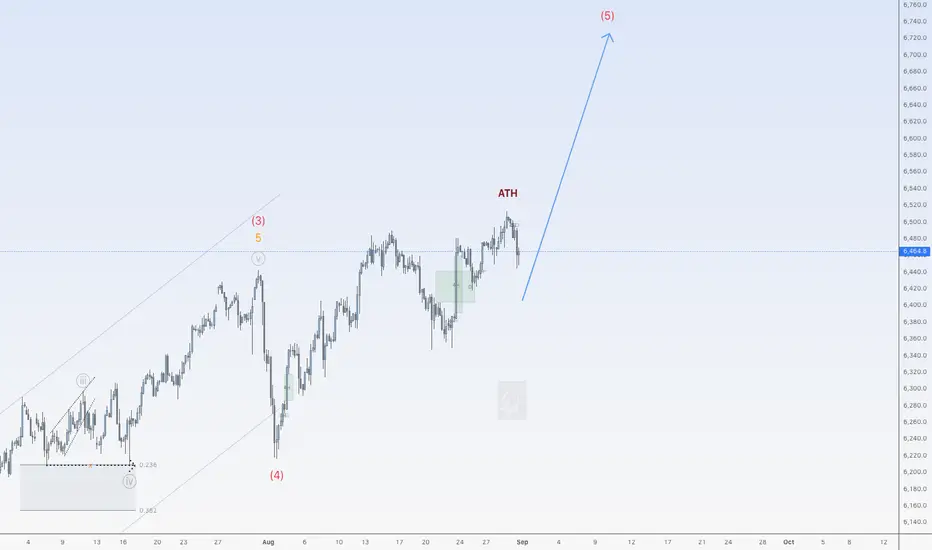
Since my last post SPX500USD made a sharp correction (wave 4) and after that it went up again making ATH's.
Last week it made a correction (Flat).
So next week after the finish of the c-wave of the correction, we could see the next impulsive wave up.
Let's see what the market does and react.
Trade idea: Wait for a small pullback and a change in orderflow to bullish on a lower timeframe to trade longs when the correction is finished.
If you want to learn more about trading FVG's & liquidity sweeps with Wave analysis, then please make sure to follow me.
This shared post is only my point of view on what could be the next move in this pair based on my technical analysis.
Don't be emotional, just trade your plan!
Eduwave
Impulse wave up for EUHi traders,
I'm back from holiday and ready to post the Weekly outlooks again.
So EU made a bigger (red) Wave 4 correction, after that it made a leading diagonal up and last week EU swept previous week low (finished the correction) and went up again.
We could see the next impulsive move up now.
So next week we could see price go higher to finish (red) wave 5.
Let's see what the market does and react.
Trade idea: Wait for the finish of a correction down and a change in orderflow to bullish on a lower time frame to trade longs.
If you want to learn more about trading with FVG's, liquidity sweeps and Wave analysis, then make sure to follow me.
This shared post is only my point of view on what could be the next move in this pair based on my technical analysis.
Don't be emotional, just trade your plan!
Eduwave

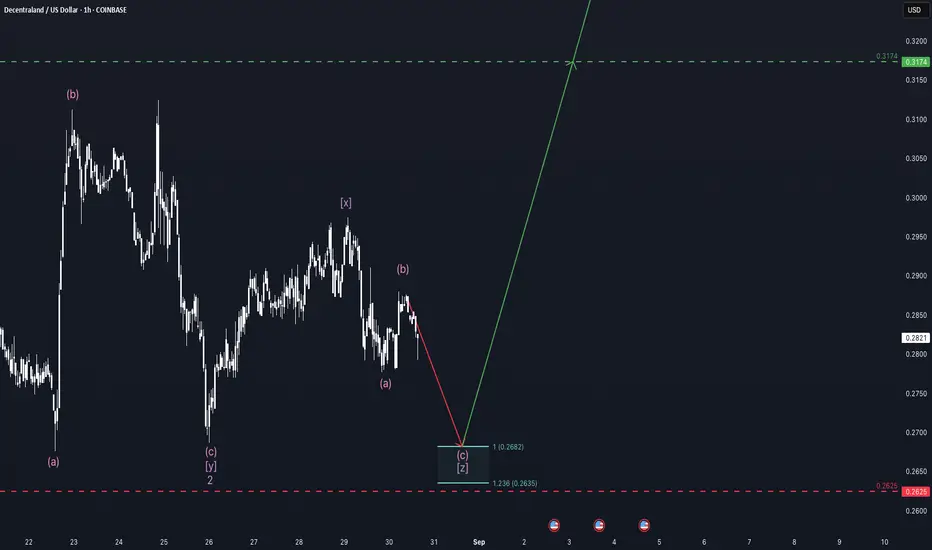
Time to decide - MANA weekly update Aug 30 - 5thDecentraland remains in Intermediate Wave 3, currently unfolding within Minor Wave 2. This corrective phase has been very complex, taking the form of a Triple Three. The overall structure consists of two Flats combined with either a Triangle or a ZigZag. While it is still too early to confirm, I consider the ZigZag scenario more likely, given the impulsive character the price has shown recently. An alternative scenario would be that we are still within Intermediate Wave 2, in which case deeper downside remains possible.
The order book is relatively thin, with only small clusters of orders visible. Meanwhile, the liquidity heatmap shows significant liquidity both above the high of the recently formed Wave b as well as above the Wave b of y.
Derivative data remains stable, with funding rates and open interest both holding at normal levels.
Taken together, the data suggests a stable base for an upcoming rally into the “third of the third of the third” — a highly dynamic phase of the Elliott cycle. It is crucial that price does not break below the low marked by the dashed line. On the upside, confirmation would come from a breakout above the high of Wave 1, as indicated by the green path.
Can PEPE make a new ATH?!PEPE came out during the APR-2023 Bear Market and was an instant hit meme in the community. PEPE has already made a +5000% gain from its inception to current price point of 0.00000991.
PEPE is currently in a ' symmetrical triangle ' which is typically regarded as a neutral pattern with price consolidation currently in process.
I believe that PEPE is in its final wave (5) count for the finale for Alt season. Once we see further liquidity come through via ETH|USD and ETH.D, we should see the likes of DOGE pump followed by other memes like Pepe to follow as well. Keep an open mind that Pepe is also presenting declining volume which is a sign that it's likely to be in its final phase of the bull market.
Key Take Profit Targets:
0.000002855 (Potential for a 'double top')
0.000003765 (Likely ending as it would be a ~275% pump from current price)
0.000005495 (moonshot)

KASPA retracement for wave 2 complete?Shown is a count for an extended wave 5 of the first impulse. wave 2 barely retraced enough to satisfy me so i included an image with an extended correction for wave 2. Main chart shows a 1,2 forming for a bullish continuation in wave 3....IF the correction is done and we continue grinding up with 1,2 structures. Could KASPA run all the way to December! Time will tell. Happy Trading

TESLA Bullish Wave C still underway...NASDAQ:TSLA is a tough count, the entire macro chart looks like a complex correction (wave 4?) with many series of 3 wave structures.
A triangle in wave B of the current wave appears complete, leading to a terminal thrust up with a target of the High Volume Node resistance at $410 followed by a poke above the swing high touching the R1 pivot at $548.
RSI remains at the EQ.
Analysis is invalidated below the wave B triangle.
Safe trading

SUI Wave (4) Still Underway?Its unclear weather CRYPTOCAP:SUI wave 4 is complete or still underway as a larger triangle of flat correction, in a ending diagonal wave 4 (defined by wave 4 falling to wave 1 at the 0.5 Fib).
Price terminated 3 waves up at the High Volume Node resistance and is now finding support at the weekly pivot, 0.236 Fibonacci retracement. Further decline brings up the the 0.382 High Volume Node support.
Weekly RSI is at the EQ.
Safe trading

MSTR Bottoming Soon?NASDAQ:MSTR continues to range while weekly RSI heads into oversold without a significant pullback, a good sign for a bullish long term outlook.
My downside target for this move remains the High Volume Node, weekly pivot and golden ratio Fibonacci retracement at $290.
The R3 weekly pivot is a solid terminal target at $1039 but could overextend in an irrational environment.
Analysis is invalidated below wave (IV)
Safe trading

MARA Holding Tight!NASDAQ:MARA continues to lag behind the small cap Miners. It is attempting to break through the weekly 200EMA once more after the rejection from the weekly pivot and High Volume Node (HVN) resistance I warned about.
My long term outlook remains up in Elliot wave 3 towards the R% weekly pivot at $66.
The golden pocket and HVN support of the local retracement has yet to be tested as resistance which acts like a magnet for price.
RSI remains at the EQ and price remains just below the channel EQ.
Safe trading

$ETH Did The Poke Above All Time High!As I said in my last update it would be unusual to complete the Elliot wave motif wave without a poke above all time high first and we got that this week adding confluence to an expected retracement ahead in wave 2. Poke above all time high shows long term strength.
Weekly RSI has bearish divergence from the wave 3 top in overbought territory.
Initial target is the (4) bottom and weekly pivot point at $3200 followed by $2800 High Volume Node and then the weekly 200EMA, S1 pivot and High Volume Node support at $2250. I will look out for longs in these areas.
Analysis is invalidated if proceed into price discovery.
Safe trading

BNB Retracement Ahead?CRYPTOCAP:BNB wave 5 looks complete at the weekly R1 pivot. RSI continues to print weekly bearish divergence from the wave 3 high.
Wave IV was a difficult count but appears to be a triangle which is a final pattern before the terminal move. Wave 2 retracement target usually ends at the bottom of wave 4 so $90 in this case which also finds confluence with 0.382 Fibonacci retracement and a swing below the weekly pivot, a good long signal.
Analysis is invalidated if we continue into price discovery.
Safe trading

GOLD → Retest 3400 before the news. Will there be a rally?FX:XAUUSD is pulling back slightly after hitting a new high of 3423. The trend is bullish, and on the D1 chart we see a breakout of a symmetrical triangle, which generally hints at bullish potential.
Gold is correcting after rising to $3423 in anticipation of US PCE inflation data.
Key factors: Doubts about the Fed's independence are limiting the USD's strengthening. Soft Fed rhetoric: Board member Waller supported a rate cut in September and further easing. The probability of a September rate cut is estimated at 87%.
Today's news: Core PCE inflation data (forecast: 2.6% y/y).
If below forecast → increased expectations for policy easing → support for gold
If above forecast → dollar strength → gold correction
Short-term gold dynamics depend on inflation data and its impact on Fed rate expectations
Support levels: 3405, 3394, 3386.5
Resistance levels: 3415, 3423, 3433
As part of the correction, the price may test liquidity zones and enter a consolidation phase ahead of the news. However, the market is one step away from distribution (exit from a symmetrical triangle). If the bulls keep the price above 3400 as part of the correction, we will have a good chance to catch the rally...
Best regards, R. Linda!

Short-term GOLD analysis
Gold appears to be completing a diametric, the last wave of which (wave-g) could end at 3308-3290.
If the post-pattern move fails to pass, a combination pattern is likely to form.
Good luck
NEoWave Chart

EUR/USD Daily (September 1st - 5th, 2025)The video shows my forecast for the EURUSD on a weekly basis, from September 1st to 5th, 2025. The analysis shows a correctional expanding diagonal after 5 Elliott waves.
Thank you all
MarketsTitan

MR.DIY Chart Check: Bullish Wave Structure with Cloud SupportMR.DIY is riding a bullish wave, supported by both Elliott Wave structure and Ichimoku signals. Price action suggests a developing Wave iii, with strong momentum above the cloud—confirming trend strength. The Tenkan-sen and Kijun-sen crossover adds bullish conviction, while the Chikou Span remains above price, reinforcing upward bias. As long as price holds above the cloud base, the bullish count remains valid. Invalidation sits below MYR 1.51. Eyes on a potential breakout if Wave iii extends.

ETH has perfect Elliot Waves Cycles.Specialists, please let me know in the comments what do you think.
My quant algo already checking hard correlations within rate cuts cycles and how they impact eth, utlimately the most sensitive.

$ETH 6,000 - 7,000 as cycle topEthereum will be looking for a big reversal in 6,000-7,000 zone, with hedge funds looking at that range as potential short opportunity.

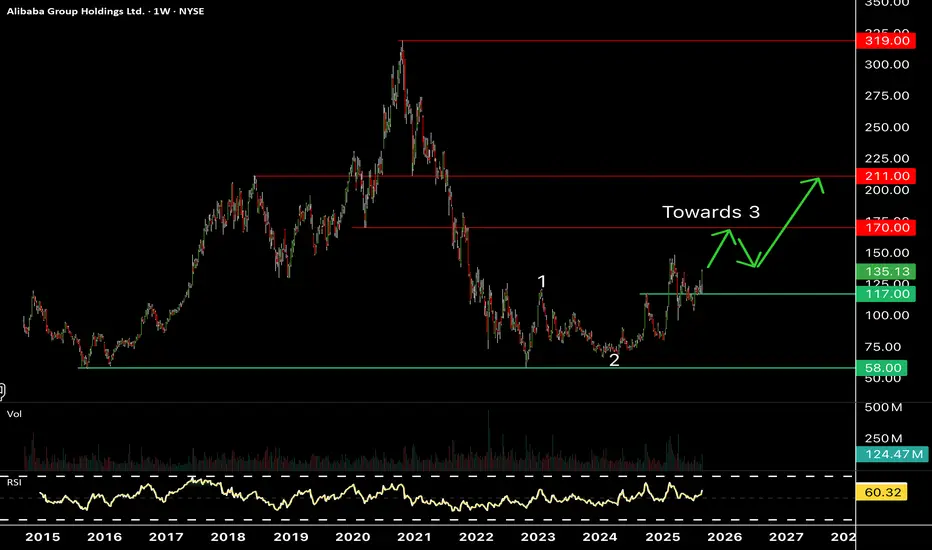
Alibaba looking to move higherToday's results seem to have trigger Alibaba for much higher levels. The market seems to have appreciated the growth of its cloud and AI business as well as its new AI chips.
Chinese big cap techs are much cheaper than US counterparts and seem to be presenting interesting opportunities.
Next resistance/target in the $170 area as long as $117 support is holding.
XAUUSD big correction is coming on September?The complex correction or consolidation is now on the edge.
Either Gold will break it and make a new range or it will retreat about $100-$150 correction.
I prefer to trade with the correction, BEARISH FOR GOLD!
LET'S GO...!!!

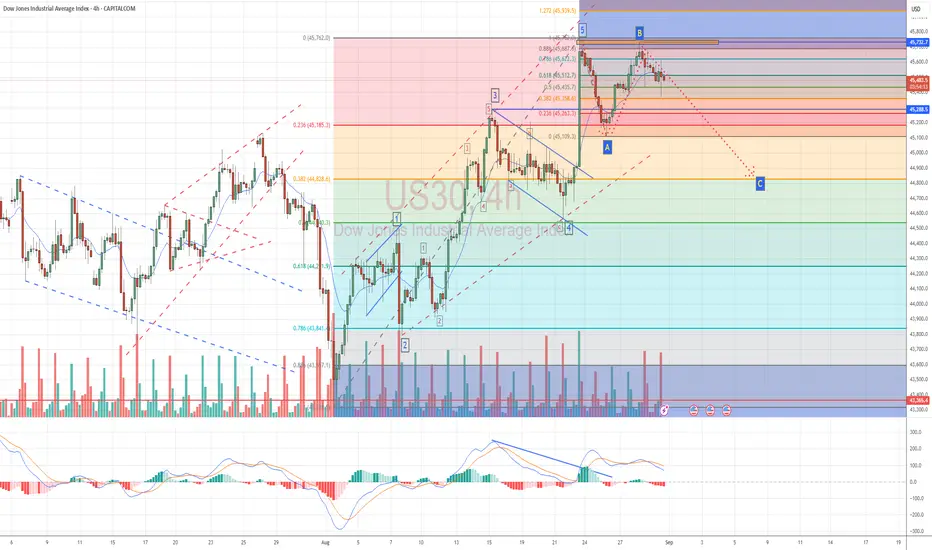
Perfect Elliot Wave on US30 The US30 has completed its 5 impulsive waves and made A and B correction, where the B making imperfect double top (as top of wave 5).
I am ready for wave C of the A-B-C correction!
Are you?
SUI – Following the Plan📉 CRYPTO:SUIUSD correction from the July peak continues to unfold within a classic Zigzag structure, and price remains on track to reach the equal legs zone at $3.00–$2.72.
No deviation from the roadmap yet. Let price complete the pattern and confirm before positioning.

Cardano – Next Buying Opportunity Setting Up📊 CRYPTO:ADAUSD bounce last week didn’t hold, and price action now points toward a double correction unfolding. The next key zone to watch is the equal legs area between $0.76–$0.72, where buyers could begin to step in again for a stronger reaction.
