ETH HTF Butterfly HarmonicAs we can see, the Elliott Wave count for wave (V) is still incomplete. Combined with the Butterfly harmonic pattern, this suggests a target price in the range of $5,900–$6,400. The invalidation level is if wave (4) overlaps with the top of wave (1).
Elliott Wave

NZDUSD → Rebound from support. Focus on 0.5800FX:NZDUSD is undergoing a correction amid a rebound in the US dollar, testing trend support and forming a reversal pattern. The fall in the dollar may support price growth.
The dollar is correcting, which gives the forex market a chance. After retesting the support of the downtrend, the New Zealand dollar is forming a rebound. A reversal pattern and a breakout of resistance at 0.58 will return the price to the trading range, confirming a false breakdown of support and potentially triggering growth.
The global trend is neutral, and locally we have the boundaries of a downward channel. However, a false breakout of trend support could shift the angle of imbalance towards the buyer, allowing the price to rise.
Resistance levels: 0.580
Support levels: 0.5771, 0.575
A breakout of resistance at 0.58 and a close above this level would be a strong signal of readiness for growth. However, before that, the price may test support at 0.5771 (break-even zone).
Best regards, R. Linda!

GBPUSD → Will the bulls be able to maintain the bullish trend?FX:GBPUSD slows down in the 1.334 zone amid a sharp decline. The market is testing trend support against the backdrop of a bullish run in the DXY due to confusing data from Powell...
The dollar continues its countertrend correction and is approaching resistance as part of the rally. A fall in the DXY will resume the growth of currency pairs.
The pound sterling is currently testing trend support and the trading range. The focus is on the 1.334 - 1.337 zone. If the bulls keep the price above this range, it will confirm the false breakdown and may trigger growth within the bullish trend.
Powell has confused the market with his statements and further policy. We have been observing the market's reaction over the past few days...
Support levels: 1.334, 1.3315
Resistance levels: 1.337, 1.346
I do not rule out the possibility of a retest of 1.3315, but a return of the price to the range and consolidation of the price above the 1.334-1.337 zone will confirm the false breakdown and may give buyers hope that this, in turn, could lead to a recovery.
Best regards, R. Linda!

NZDJPY → Consolidation amid a downtrend. What next?FX:NZDJPY is ending its correction and returning to the downward trend. The price is consolidating for a possible continuation of the downward movement...
The price breaks the support of the upward channel (countertrend correction). The movement occurs in a “step” format, which generally indicates weak demand. Clear consolidation boundaries are forming on the chart. The global trend is downward, and the local trend has also resumed its downward movement. Focus on two zones: 86.5 - 86.96. Within the framework of trading strategies, a false breakout of resistance or a breakout of support can be considered with the aim of continuing the decline.
Resistance levels: 86.96, 87.16
Support levels: 86.5
As part of consolidation, MM may form a liquidity trap on the resistance side, and a false breakout may trigger a further decline. However, if the bears increase pressure, the formation of a pre-breakdown base relative to the 86.5 support may trigger a breakout and a continuation of the downward movement.
Best regards, R. Linda!

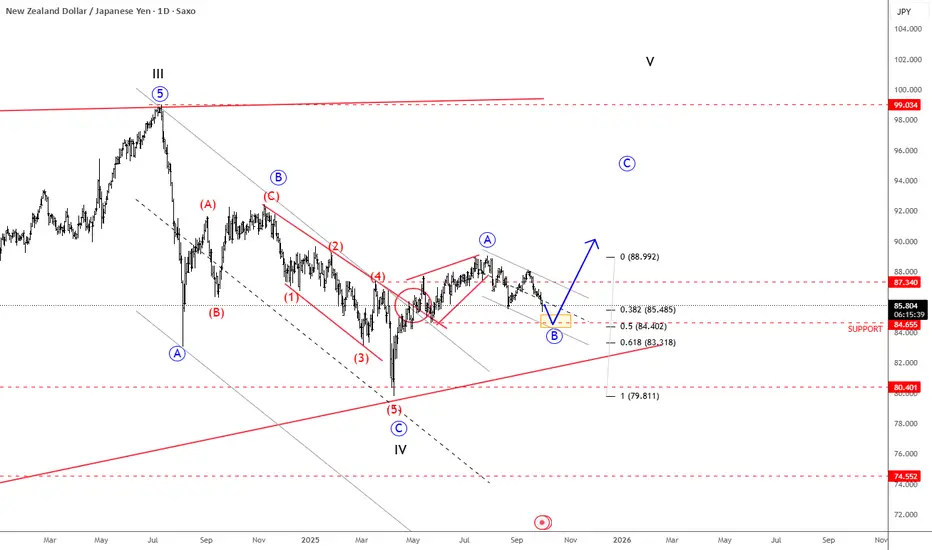
NZDJPY Is Forming A Bullish SetupNew Zealand dollar turned up against the Japanese Yen since April, when we saw a strong rebound from 80.40 support, a key level going back to March 2023. The recovery is quite strong, and it looks like a leading diagonal pattern into wave A; so it's a motive wave structure that already pushed above the 87.34 resistance, which is a strong bullish signal, suggesting more upside ahead. So if we are correct, then current retracement is a contra-trend move; possibly wave B that has a nice support at 85-84 area, which is not that far away, so we may get a new bounce in a few weeks; ideally an impulse, out of a current downward channel.
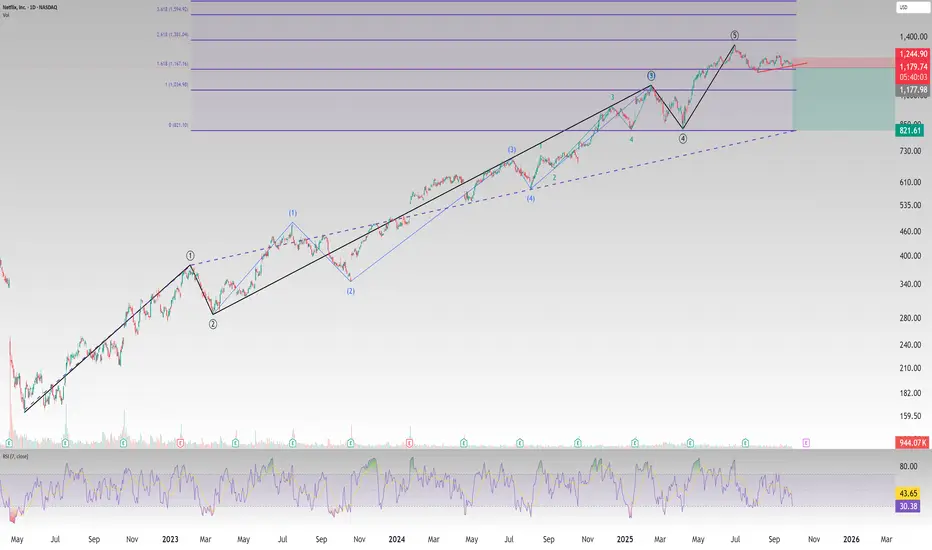
Netflix Short: Breakdown from trendlineOver in this chart, I present the big picture Elliott Wave counts and also the breakdown from a trendline that triggers this short idea.
The stop loss is set at 1245 and the take profit is set at the bottom of wave 4 around $822.
Good luck!
GBP/JPY Outlook and Elliott Wave AnalysisThe GBP/JPY currency pair is currently trading near critical levels. The Bank of England (BoE) keeps its policy rate steady at 4.00%, providing limited near-term support for the Pound. In contrast, the Bank of Japan (BoJ) maintains rates at 0.50%, but signals of potential future tightening could strengthen the Japanese Yen. This divergence creates downside pressure on GBP/JPY.
From a technical standpoint, according to the Elliott Wave Theory, the GBP/JPY pair has likely completed the final wave C of an ABC corrective structure in a diagonal pattern. This pattern suggests the Japanese Yen could gain short-term strength against the Pound, with the pair potentially pulling back towards 198.00 by 1 October.
In the short term, GBP/JPY may continue to show choppy but downward-biased moves. However, the upcoming 1 October data releases and the BoJ’s policy stance will be crucial. If the Bank of Japan refrains from action, the Pound could regain momentum and drive GBP/JPY higher towards the 201.00 resistance area.

Impulse Wave 5 Near Completion: Short Setup Ahead?The 5th wave of the current impulse structure is close to completion. Price action is showing exhaustion and the drop in volume is confirming that momentum is fading. At this stage, risk for longs is increasing and the probability of a corrective phase (A-B-C) is high.
Traders should keep an eye on bearish confirmation signals such as trendline breaks, bearish engulfing bars, or supply zone failures. A short setup could develop soon if price rejects with conviction.
Patience is key — Wave 5 can stretch, but once it’s done, downside pressure usually accelerates quickly. Manage risk carefully and adjust sizing according to your strategy.

Gold cycle analysis. 30/Sept/2025 Gold parabolic rocket launching was much difficulty to catch then falling knife. Gold medium cycle Number 15 probably Only will be due by last week of Oct 2025. at around 3500 a fibo 0.618 plus multi trendline confluence zone which "matched" tradingview Mod idea as well. A daily pin bar could be formed again on today closed daily bar.

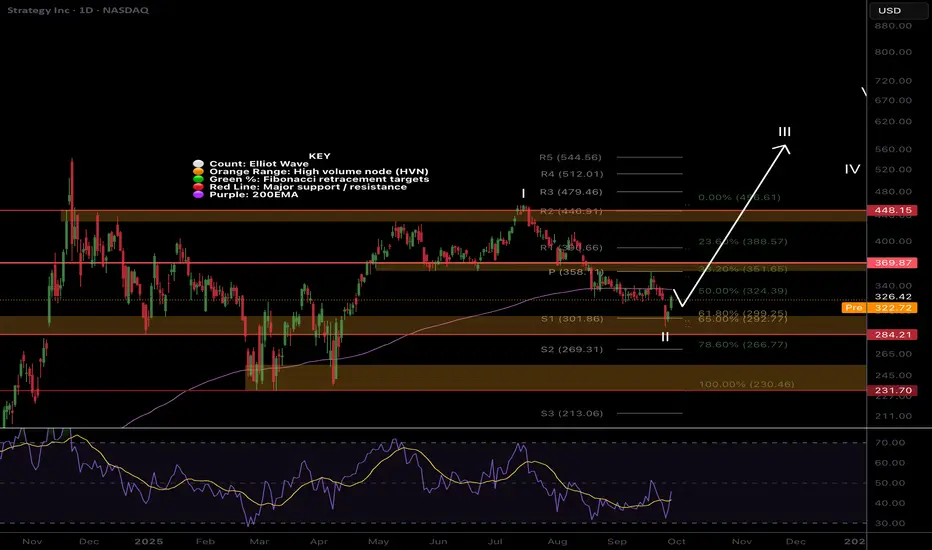
MSTR Wave II bottom?NASDAQ:MSTR is finally catching a bid from the triple support zone of the Fibonacci golden pocket, S1 pivot and High Volume Node.
It must overcome the daily 200EMA to add confidence to a reversal and wave II bottom being in.
Daily RSI has printed bullish divergence from oversold. Vanguard disclosed massive MSTR holdings ad the sentiment is awful online adding confluence to a bottom soon.
Wave III target is the R5 daily pivot $544, losing the support zone has a downside target of $232
Safe trading
COIN wave 5 Underway!NASDAQ:COIN wave 4 appears complete at the expected Fibonacci retracement 38.2 and High Volume Node support.
A local channel has formed which could be a bear pennant so bulls should watch out. A breakout of this would hit resistance at $360 High Volume Node and the first take profit area from my recent trade. Clearing this Nose will confirm wave 5 is underway to new all time highs $500+
RSI is flipping bullish from oversold and the dail 200EMA continues to rise.
Safe trading

BTDR Bounces from previous swing high support!NASDAQ:BTDR found support at the at the wave 1 high and R1 pivot and looks poised to continue to the first take profit target and all time High Volume Node tat $25! Wave (3) of 3 appears to be underway so should continue to be powerful!
Analysis is invalidated if we drop below $13 and lose the High Volume Node support which sits at the Fibonacci golden from the wave (2) bottom.
RSI did not reach overbought so has room to grow.
Safe trading

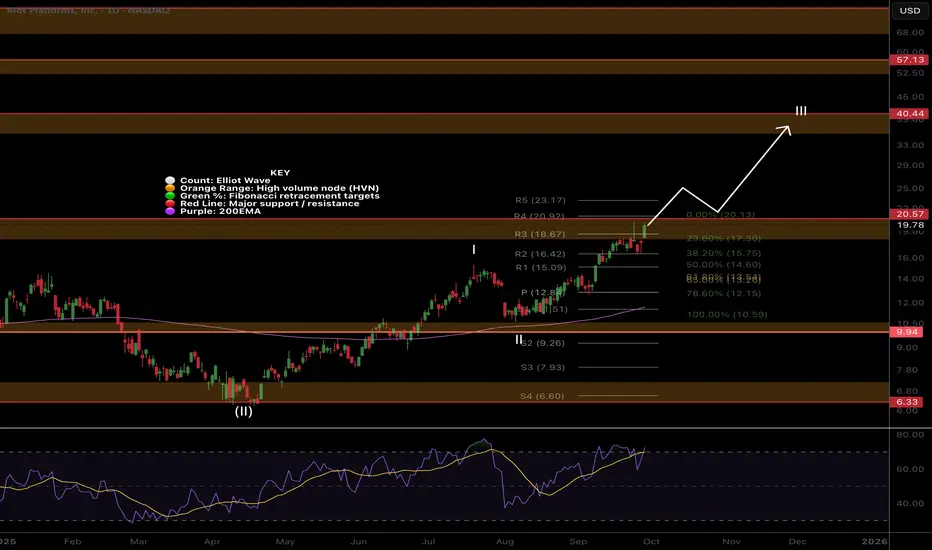
RIOT doesn't want to retrace this time!After hitting the High Volume Node and first take profit area NASDAQ:RIOT was rejected as expected but instead of a deep retracement continued to push powerfully back into the node looking poised for a breakout above!
Once the resistance is clear and tested as support RIOT should move quickly to the next High Volume Node and take profit area at $40.
Analysis is invalidated below the R2 pivot, $16, and the retracement will instead be underway!
Safe trading
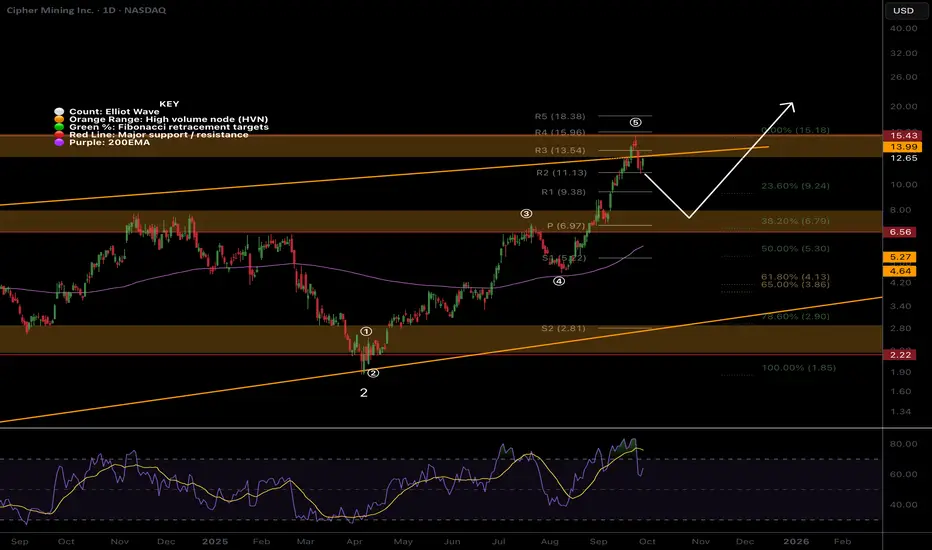
CIFR deep pullback before more upside?CIFR appears to have completed 5 waves for wave (1) of 3 completing at the previous all time High Volume Node where we expect Elliot wave 1s to complete. The orange channel boundary also had a throwover and drop back, an ending pattern!
Wave (2) has an expected shallow pullback of the 38.2 Fibonacci retracement at the daily pivot and High Volume Node support $7 where I will look out for long signals. The ascending 200EMA will also meet this point making it a quadruple support and an excellent opportunity area if price gets there!
If we continue into price discovery the analysis will be invalidated and I'll take a breakout long.
Daily RSI hit overbought but has since fell with no divergence.
Safe trading
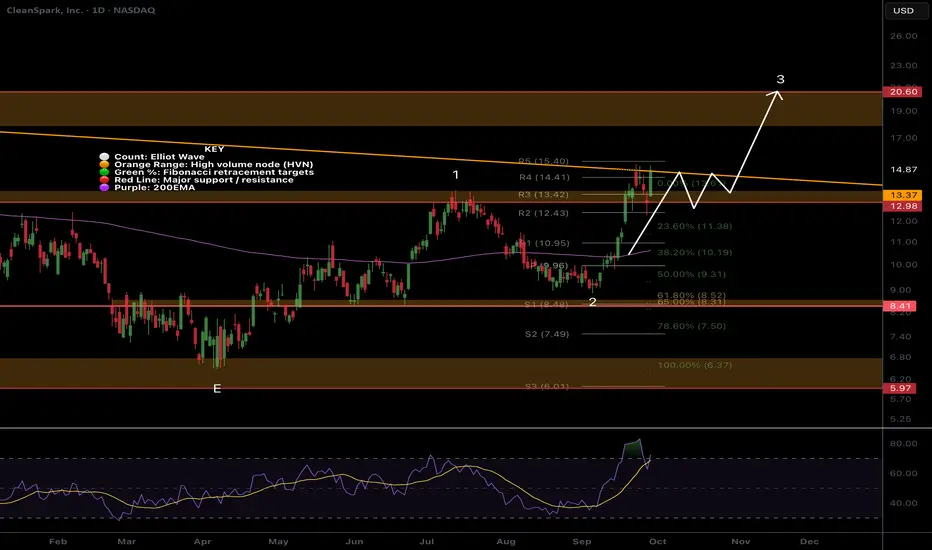
CLSK Attempting a significant resistance breakout!NASDAQ:CLSK has awoken at long last and has smashed through the wave 1 resistance High Volume Node straight into the Macro Triangle upper boundary i have been sharing in the weekly time frame posts. Breaking out above this and wave D at $20 will be a bullish signal with significant upside to come!
The High Volume Node resistance held as support in the big drop last week, quickly recovering back to highs showing strong demand.
The next local target is the wave D resistance $20 with continued upside in wave 3
Daily RSI is overbought but divergence yet and daily 200EMA has flicked positive.
Analysis is good unless we go back below wave 2 into the golden pocket.
Safe trading
AMDPrice has been trading sideways for almost a month now. Due to this we remain in limbo waiting for price to more clearly reveal its intentions. I am still of a mind that (B) is over, but we are far from confirmation.
We have breached the last two wave 4's of a lesser degree which is promising. Price also made a high on neg div. However, I anticipate that price needs to rise to the $170's again for wave b next. After that, we should continue moving lower carving out the intermediate (C) wave. Time will tell. For now, AMD is too risky of a trade for me.

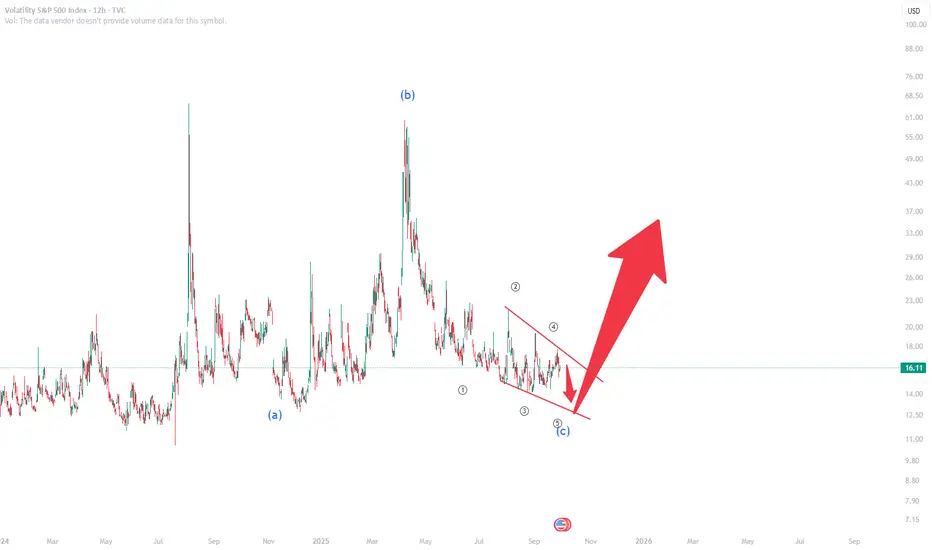
VIX Index – Elliott Wave Analysis: Diagonal C CompletionThe VIX index is finalizing an A-B-C corrective structure, with the C-leg forming as a diagonal. Price action suggests this structure is close to completion. Once the diagonal ends, the probability of a sharp upside move in volatility becomes highly likely.
Why does this matter?
A rising VIX reflects fear and risk aversion in the market.
Historically, VIX moves inversely with equities – higher volatility often coincides with S&P 500 weakness.
When VIX breaks out, it signals hedging demand and uncertainty, pushing option premiums higher and increasing market stress.
📌 Trading view: A confirmed breakout from the diagonal would mark the start of a new impulsive leg higher in volatility. This could align with risk-off flows in equities and broader corrections across risk assets.
Patience and confirmation remain key — once VIX turns, it usually accelerates quickly, not quietly.
QNT AWAKENED! Elliott Wave Analysis! Zoom into LTFs. Bullish!!4 hour TF shows QNT making good progress towards the 1st wave in teal. As shown in the image included with this post, we have recently finished a wave 4 running triangle correction to the downside. Next, wave 5 should press onwards, if my wave 5 extends beyond $106.82 / the red 1:1 fib ratio of wave 3, it will invalidate this leg of the impulse and i will have to rework the wave count on this 3rd wave in aqua green color.

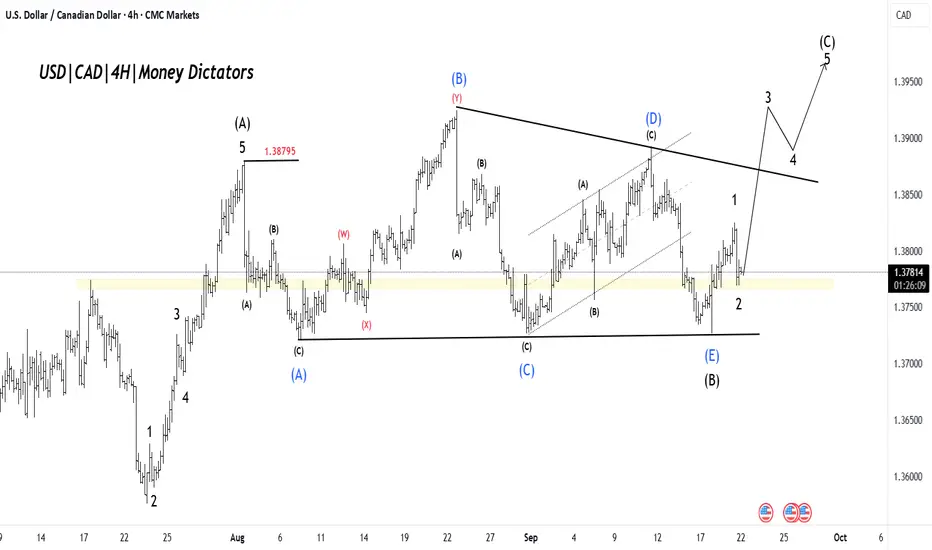
USDCAD: Impulse Wave Points to Higher LevelsUSD/CAD Price is showing the early stages of a bullish (C) leg after a large corrective sequence. The chart labels show a completed corrective (B) low at the horizontal support and an impulsive 1–2 sequence unfolding for the new upward leg. Bias: bullish while price holds above the demand zone/wave-2 low.
The market completed an ABC correction that found support on the horizontal lower boundary. That corrective phase looks finished; we should now be in wave (C) up, the final leg of the correction.
Short-term momentum has flipped, with buyers stepping in at support. This favors trend-following longs into the extension leg (wave 3 → 5)
Target 1 (T1): 1.38408
Target 2 (T2): 1.38810
Stop-Loss (SL): 1.37195
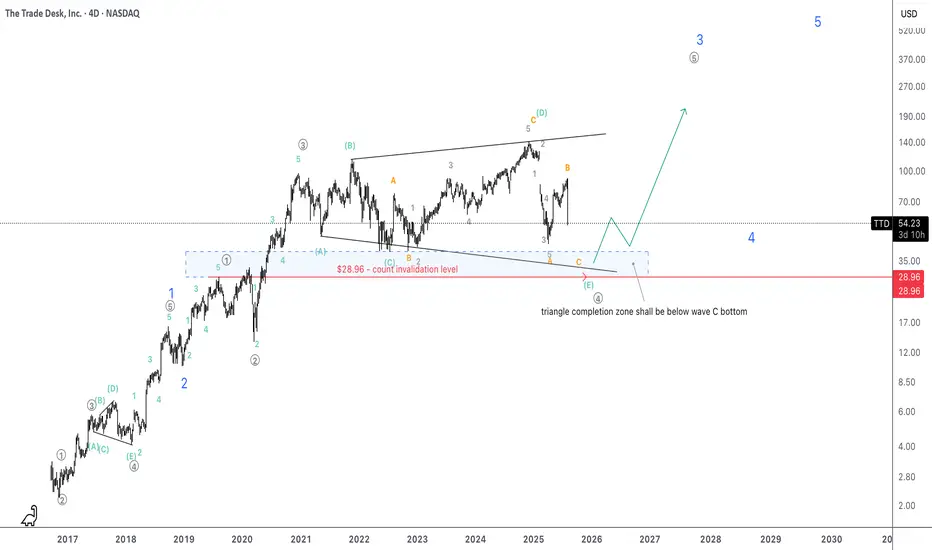
TTD poised to take off as expanding triangle completesIt is magnificent how the current triangle proves EW fractal aspect since there was an expanding triangle at the same wave degree within blue wave 1.
I'd put SL at around $29 where grey 4 (with the current triangles wave E) would overlap grey wave 1.
Magnitude of the unfolding grey wave 5 might be immense if this count is correct.
Short term, TTD, obviously goes further down to complete wave E and I will start buying in the blue area and in the mean tome will monitor 5 wave structure of C of E.
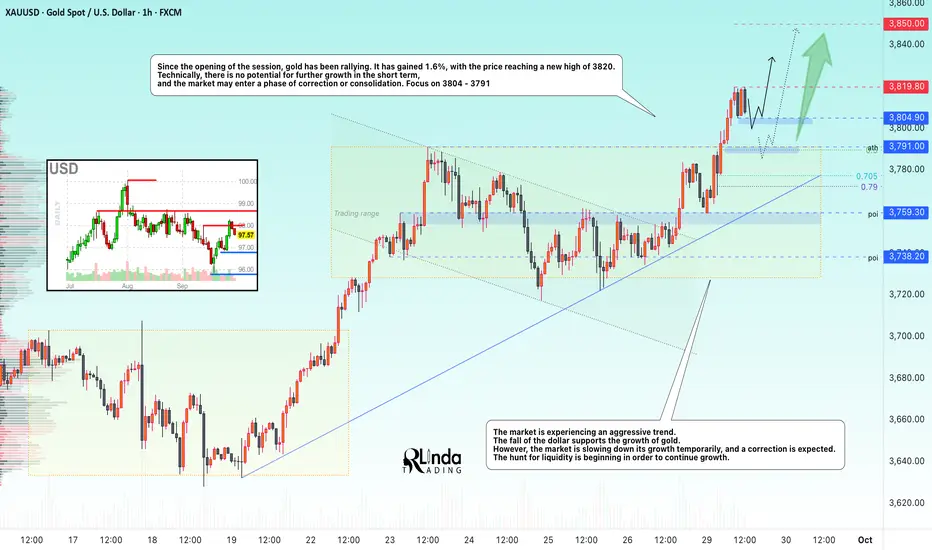
GOLD → Correction / consolidation before growth FX:XAUUSD has been rallying since the opening of the session, which we anticipated in yesterday's analysis. It has gained 1.6%, with the price reaching a new high of 3820. Technically, there is no potential for further growth in the short term, and the market may enter a phase of correction or consolidation.
Key supporting factors : Risk of a US government shutdown. Pressure on the USD is intensifying due to fiscal uncertainty. Unconfirmed reports of negotiations between Trump and Netanyahu on Gaza are not yet distracting attention from the risks.
The further dynamics of the metal this week will depend on US labour market data. This week will see JOLTS vacancies, ADP, PMI indices and the key NFP report on Friday. If they confirm the strength of the economy, expectations of a Fed rate cut (currently ~40 bps by the end of the year) may diminish, strengthening the dollar.
Resistance levels: 3819, 3825
Support levels: 3804, 3791, 3777
The market is experiencing an aggressive trend. The fall of the dollar supports the growth of gold. However, the price of the metal is slowing down temporarily, and a correction is expected. The hunt for liquidity is beginning in order to continue growth. Technically, the focus is on 3804 - 3791. A false breakdown of support could resume the bull run.
Best regards, R. Linda!
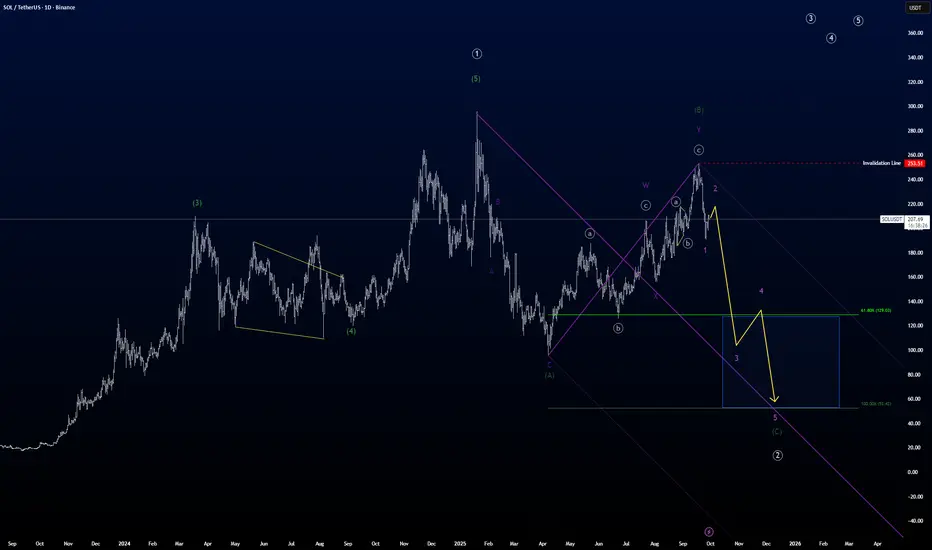
SOL is messy but is going through a correction.SOLs last move up in white primary ((1)) was not as large compared to the move up prior to that, which we can't see on the picture. So I guess we still have a large 3rd of a 3rd to come in a move up.
But first we still need to finish this correction SOL is in right now.
I believe SOL is doing a flat correction in a primary degree, so it takes some time to get through.
It looks like the green (B) wave is finally done, and now we just need the green intermediate (C) to finish. The 1st wave of that c-wave is almost over if not already, so anticipate a correction up in purple 2nd wave.
When that 2nd wave is done, SOL will move into a strong move down in wave purple 3 following the yellow path.
double (()) indicates circle on chart.
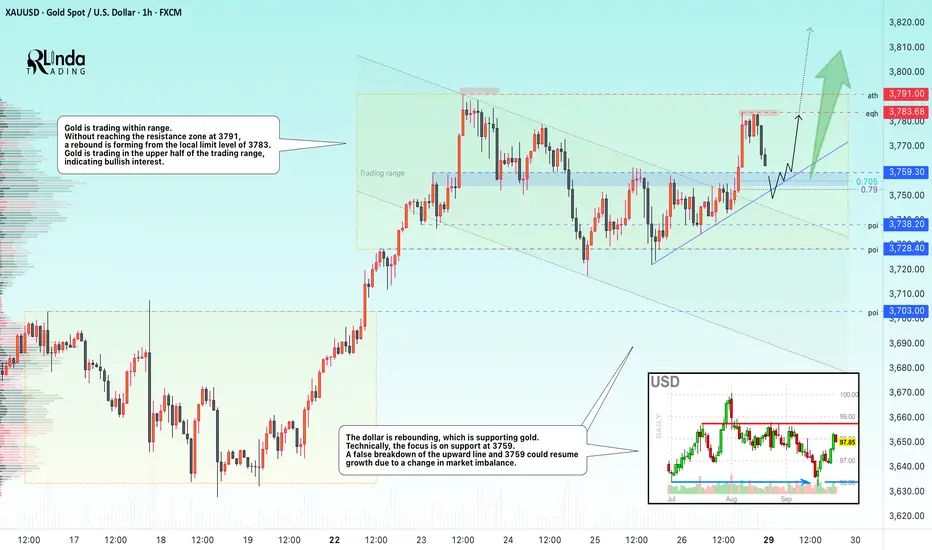
GOLD → The hunt for liquidity ahead of growth FX:XAUUSD . Technical analysis for the new trading session. On Friday, the local correction ended and there was a strong bullish impulse, which was sold off by the end of the session. What to expect next?
Gold is trading in the upper half of the current trading range of 3728-3791. The US session initiated the end of the technical correction, which ended with a breakout of the consolidation resistance at 3755. A momentum of 300 pips was formed, and the price hit the local limit resistance zone of 3783, from which the market began to sell off. However, the current correction of the bullish momentum is not so scary in the current perspective, as MM is forming a retest of the zone of interest to capture liquidity in order to continue the bullish trend. Thus, a false breakdown of the support zone 3759 - 3755 or the ascending line may shift the momentum towards the bulls, which in turn may lead to growth to 3783 - 3791.
Resistance levels: 3783, 3791, 3800, 3810
Support levels: 3759, 3755, 3743
If, during the retest of the support zone, the bulls keep the price above the blue zone at 3759, this will be a positive sign confirming the bullish structure, which could lead to a price recovery and a retest of the ATH.
Best regards, R. Linda!