GOLD Analysis - 29/8/2025 Update (Scenario 2 from 4)GOLD Analysis - 29/8/2025 Update (Scenario 1 from 4)
This is Scenario 1 from 4 Scenario
Elliott Wave

GOLD Analysis - 29/8/2025 Update (Scenario 1 from 4) GOLD Analysis - 29/8/2025 Update (Scenario 1 from 4)
This is Scenario 1 from 4 Scenario

Nikkei 225 Short: Completed 5-wave structure at Fibo ExtensionI may, or not may, go through this idea in a video but the information provided on the chart should be self-explanatory.
I am still figuring out how to label the cycle level waves (since 2009) that may potentially signal that this is the ultimate peak and we are going into a strong downturn. But primarily study doesn't show any nice Fibonacci properties although it won't technically be wrong (I just prefer to have nice Fibo extension levels). Till I can convince myself of the longer-term counts, for trading purpose, the current count is sufficient for a seriously good risk-reward trade.
Good luck!

BITCOIN → Breakthrough of the downward trend resistance... 120K?BINANCE:BTCUSDT.P formed a false breakdown of key support at 110,000 - 112,000 and returned to the whales' zone of interest. The chart shows the prerequisites for a possible end to the countertrend correction...
A false breakdown of the daily support of 110K - 112K provokes a local bearish rally, within which the price breaks through the downward resistance of the correction and tests 113.300. The growth was supported by positive signals from institutional investors, technical stability and a decrease in selling pressure.
The fundamental background is positive, the market is trending. The chart shows prerequisites for the end of the correction. However, the further outlook depends on the 112.0 - 112.5K area. if the bulls hold the price above this zone, the flagship may return to the upward movement and head towards 117K - 120K.
Support levels: 112.5, 112.0, 110.9
Resistance levels: 113.6, 114.6, 117.0
After breaking through the resistance of the descending channel, the impulse stops and most likely a fight for the 112K zone may form. If the price returns to the channel and consolidates below 112K, then Bitcoin may return to the downward movement, however, while the price is trading above this line, the bulls have a chance...
Best regards, R. Linda!

SOL — High Confluence Buy ZoneFrom 12th–14th August, SOL spiked into the 0.618/0.786 pitchfork resistance zone, where the best short entry presented itself. This rejection also marked the completion of wave 5 of the 5th Elliott Wave, confirming exhaustion in the $205–$210 zone.
After this sharp move, an imbalance has formed that typically gets retraced. When price spikes that quickly into resistance, it often gives the entire move back → meaning a return to the origin of the move. As price approaches this region, it becomes the prime zone for long re-entries.
🧩 Confluence Factors: 9
0.618 Retracement of the 5-wave impulse: $176.47
Daily level: $174.84
nPOC: $175.00
0.786 Trend-Based Fib Extension: $175.00
Anchored VWAP: ~$173.30
Sell-Side Liquidity (SSL): ~$173.50
Pitchfork 0.618 support: Aligning with this zone
Monthly Open (mOpen): $172.22 (major support)
0.786 Fib Speed Fan: Adding further structural support
🟢 Long Trade Setup
Entry Zone: $176.5 – $172
Best Entry: Around $175 (ideal ~ $173, confluence with liquidity + mOpen)
Stop-Loss: Below $167
Target: $219.21 (0.618 retracement of full move)
Potential Gain: +25%
R:R: 1:5+
Technical Insight
The 0.786 pitchfork rejection into wave 5 completion marked exhaustion at $205–$210.
Fast moves into resistance often retrace back to origin, opening the door for imbalances to be filled.
The $176.5–$172 zone clusters multiple technical supports, making it a high-probability long entry.
The mOpen at $172.22 and surrounding liquidity pocket stand out as the most ideal entry point.
With targets up to $219, the setup offers a strong +25% potential move with excellent risk-to-reward.
Key Levels to Watch
Support Zone: $176.5 – $172 (ideal entry ~$173)
Final Target: $219.21
🔍 Indicators used
DriftLine — Pivot Open Zones → For identifying key yearly/monthly/weekly/daily opens that act as major S/R reference points
➡️ Available for free. You can find it on my profile under “Scripts” and apply it directly to your charts for extra confluence when planning your trades.
_________________________________
💬 If you found this helpful, drop a like and comment!

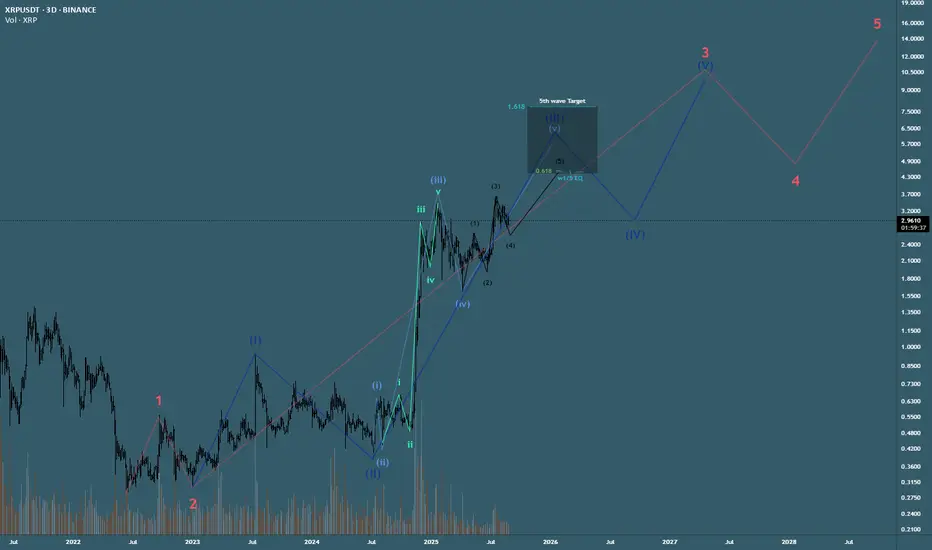
Super Bullish! HTF XRP Elliott Wave Count - Triple 1,2 ImpulseHere is my most bullish scenario for XRP, all rules followed, higher probability than the diagonal playing out. Expecting a choppy grinding 4,5 structure to finish out the pattern similar to the beginning 1,2 1,2 pattern
GOLD → Retest 3400. Readiness for a breakthroughFX:XAUUSD is "consolidating" creeping up on resistance, which generally increases the chances of a breakout, but the initial resistance test may end in a pullback. However, there is news ahead that could trigger one of two scenarios...
At the moment, gold is testing $3,400, but is ready for a correction pending new data from the US. However, further decline may be limited for the following reasons: Weak dollar: The probability of a Fed rate cut in September is estimated at 90%. Trump-Fed conflict: Pressure on Fed Chair Lisa Cook undermines confidence in the dollar. Trade wars: New US tariffs (on India) and retaliatory measures (Mexico, Canada against China) increase demand for "safe havens"
What is important: Political uncertainty and soft rhetoric of the Fed continue to play in favor of gold. Any attempts to reduce will be supported by buyers. It is also worth paying attention to the GDP and Initial Jobless Claims, which will be published today at 12:30 GMT.
Resistance levels: 3405, 3420, 3433
Support levels: 3386, 3373, 3369
Technically, the situation is ambiguous and everything depends on the reaction to 3405 and further news. Weakening of the fundamental background may lead to consolidation or correction to 3373 - 3369. However, if traders feel support, then the retest of 3405 may end with a small consolidation around the level and subsequent breakout and growth to the specified targets (I am more inclined to this scenario based on the above situation)
Best regards, R. Linda!

QQQ 5th leg down tomorrow?Normally wouldn't want to publish anything this short term, but the rally this afternoon looks like a 3-3-5 flat for wave 4. It stayed within the channel and the close for the day was under the 38% retracement of wave 3 after going over it.

LC - About to breakoutLC started moving up quietly. This is UPST's cousin brother.
all VWAPs favoring long side.
Target 1 - 24
Target 2 - 34
Stop Loss - 15

AUDUSD Bulls Wake Up | Long Setup After CPI ReportToday I want to share with you my LONG position on AUDUSD ( OANDA:AUDUSD ) on the pretext of the release of the CPI y/y index .
Let's take a look at the AUDUSD from a fundamental and technical perspective .
AUDUSD Fundamental Outlook:
Australia’s CPI surprised to the upside at 2.8% YoY (vs. 2.3% exp., 1.9% prev.), mainly boosted by higher electricity costs after rebates expired. Core inflation (trimmed mean) also rose to 2.7% , reducing the odds of a near-term RBA rate cut.
Short-term : Mildly bullish — strong CPI supports AUD as markets price out aggressive RBA easing.
Medium-term : Neutral-to-slightly bullish — sustainability of inflation is uncertain since part of the rise came from temporary energy factors.
----------------------------------------
Now let's take a look at the AUDUSD chart on the 1-hour time frame .
AUDUSD is approaching the Potential Reversal Zone(PRZ) , the Support zone($0.6450-$0.6437) , the Yearly Pivot Point , and a Heavy Support zone($0.6440-$0.6338) .
In terms of Elliott Wave theory , AUDUSD appears to be completing a corrective wave . The corrective wave on the 1-hour time frame is most likely an Expanding Flat(ABC/3-3-5) .
I expect AUDUSD to start rising to at least $0.6490 .
Second Target: $0.6514
Stop Loss(SL): $0.6425(Worst)
Please respect each other's ideas and express them politely if you agree or disagree.
Australian Dollar/U.S.Dollar Analyze (AUDUSD), 1-hour time frame.
Be sure to follow the updated ideas.
Do not forget to put a Stop loss for your positions (For every position you want to open).
Please follow your strategy and updates; this is just my Idea, and I will gladly see your ideas in this post.
Please do not forget the ✅' like '✅ button 🙏😊 & Share it with your friends; thanks, and Trade safe.

GBPUSD Long Setup: Strong Services & Weak USD in FocusToday, we will examine the long position of GBPUSD ( OANDA:GBPUSD ) together from a fundamental and technical perspective .
Please stay with me.
GBPUSD Fundamental Analysis :
GBP Strength Signals:
CPI y/y: 3.8% vs 3.7% expected → higher inflation → less likelihood of rate cuts → supports GBP.
Flash Services PMI: 53.6 vs 51.8 expected → strong service sector → positive for GBP.
GBP Weak Signals:
Flash Manufacturing PMI: 47.3 vs 48.2 expected → contraction in manufacturing → short-term pressure on GBP.
USD Weak Signals:
US Unemployment Claims: 235K vs 226K expected → weaker labor market → negative for USD.
Summary:
Overall, data favors GBP over USD. Short-term to medium-term, GBPUSD is likely to show upside momentum, driven by strong services, higher inflation, and weaker USD labor data. Watch for upcoming US data or Fed comments that could change this bias.
Note: Flash Manufacturing/Services PMI will publish soon.
Note: Tomorrow, we will have Fed Chair Powell speak.
------------------------------------------
Now let's take a technical look at the GBPUSD on the 4-hour timeframe .
GBPUSD is currently moving near the Heavy Support zone($1.343-$1.313) and Potential Reversal Zone(PRZ) .
In terms of Elliott wave theory , GBPUSD seems to have completed the corrective waves . The first signal to confirm the end of the corrective waves could be the break of the upper line of the descending channel . The corrective wave structure is most likely a Double Three Correction(WXY) .
I expect GBPUSD to rise to at least $1.357 AFTER the break of the upper line of the descending channel .
Second Target: $1.363
Note: Stop Loss(SL): 1.3326 USD = Worst Stop Loss(SL)
Please respect each other's ideas and express them politely if you agree or disagree.
British Pound / U.S Dollar Analysis (GBPUSD), 4-hour time frame.
Be sure to follow the updated ideas.
Do not forget to put a Stop loss for your positions (For every position you want to open).
Please follow your strategy and updates; this is just my Idea, and I will gladly see your ideas in this post.
Please do not forget the ✅' like '✅ button 🙏😊 & Share it with your friends; thanks, and Trade safe.

BTC - 4H Elliott Wave Analysis - 28.08.25Welcome back :)
We have finished blue Wave 1 on the 15th of August and have been working on the blue Wave 2 since. Alternatively you can put the Wave 1 on the last high which is the current ATH.
The blue Wave 2 could be finished with our last low on the 26th of August which means next we would look for a Wave 3 to the upside. We just want to point out that you can also count this as a Wave 3 and 4 on a higher timeframe. But that's just a side note which does not change the expectation on the shorter timeframes. :) The Wave 2 support area lies between the 0.5 FIB at 109994 USD and the 0.886 FIB at 100723 USD.
We do not see a strong reaction from the support area which makes us lean to another scenario where the correction is not finished yet and we only finished Wave W and X of a WXY correction and we are currently working on Wave Y. The bounce from the support area looks rather corrective displayed as small yellow ABC. This can be part of the Y Wave or alternatively it resets the Wave W but in both cases we assume another low.
The next target to the downside would be the 1.618 FIB at 106273 USD and right below that the 1 to 1 FIB at 105253 USD. Which is also around the golden pocket.
Thanks for reading.
NO FINANCIAL ADVICE.

SOLANA to make a new ATH?!My hypothesis is that Solana is on course to be one of the first alt coins to top out first as it makes its final wave 5 move in SOL|USD pair. Trump also announced that SOL is part of the US strategic reserve (2/3/25) and has a special place as an OG crypto, despite only being launched from 2020.
SOL is presenting a ' rising wedge ' pattern which is typically a bearish structure under TA principles. Given SOL has already gained +2500% from the 2022 ABC bottom, I think its cycle top is approaching.
From its bottom in NOV-22 (with the FTX crash having ~10% of the SOL supply), SOL bottomed out when it was 0.39% of the crypto market last cycle and topping out at ~3%. However, this cycle, SOL.D has gained higher crypto dominance sitting today at about ~2.98%, thanks to higher utility over the bear market (e.g. NFT usage increasing from ETH to SOL as seen with the likes of Trump coin). This cycle I expect SOL.D to top at around 6.5-7.3%.
SOL|ETH pair should top soon as its currently bottoming out (wave 4) against SOL|ETH pair and ready to make its final wave 5 move. SOL|BTC is also making its wave 5 as it gains higher dominance over BTC which is getting closer to its wave 5 top.
SOLANA USD Targets:
1. $365 Key price point to break
2. $600 Likely
3. $960 Moonshot (Raoul Paul delusional target of $1k)
4. $1500 Unlikely

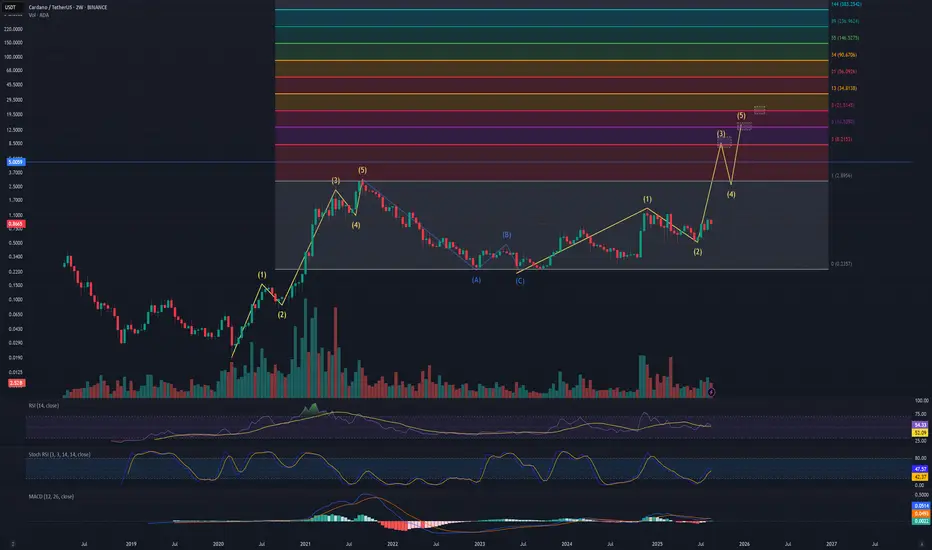
ADA Cardano to make a new ATH?!Cardano (ADA) is one of the OG cryptos from 2017 and also part of the US crypto strategic reserve as announced by Trump on 3/3/25. ADA|USD pair needs to break the key $5 level for it to make higher new ATHs. Price action on ADA is about to moon as it starts to make its wave 3 move.
ADA.D is currently at c. 0.8% dominance of the crypto market. When Alt Season kicks off, I expect ADA.D to top out around 3.4% - 4.4% of the crypto market. If ADA was to make a new ATH in dominance it would be around 5% and above. Keep an eye out on these levels as potential sell ranges. If things got 'stupidly' bullish, It could reach up to 7% as a key grand fib level.
ADA|BTC pair, currently presenting an inverse head and shoulders and getting closer to the neckline. Which is a bullish sign for ADA.D as it should make its wave 3 move in ADA|BTC pair.
Cardano (ADA) USD Targets:
Target 1: ~$5.00
Target 2: ~$8.20
Target 3: ~$13.50
Target 4: ~21.50 (Moonshot)
Bitcoin at Heavy Support Zone –Will Bulls Defend $110K or Break?Bitcoin ( BINANCE:BTCUSDT ) rose to $114,400 and even higher, as I expected in my previous idea . Of course, Powell's words also played a significant role in this increase.
Bitcoin has started to decline after the rebound and is currently trading at a Heavy Support zone($111,980-$105,820) near the Potential Reversal Zone(PRZ) , Cumulative Long Liquidation Leverage($110,157-$109,000) , 100_EMA(Daily) , and Support lines .
The question is whether Bitcoin will manage to break the Heavy Support zone($111,980-$105,820) or will it start to rise again. What do you think?
In terms of Elliott Wave theory , Bitcoin appears to be completing microwave 5 of the downtrend waves the past two days . Microwave 5 could be completed at Potential Reversal Zone(PRZ) and Cumulative Long Liquidation Leverage($110,157-$109,000) .
Also, we can see the Regular Divergence(RD+) between Consecutive Valleys.
I expect Bitcoin to rise to at least $113,500 after entering the Potential Reversal Zone(PRZ) or hitting the Support lines . Market conditions may get a little emotional with the US market opening , so please observe money management.
Second Target: $114,517
Cumulative Long Liquidation Leverage: $108,000-$106,747 =Important
Cumulative Short Liquidation Leverage: $114,246-$113,326
Cumulative Short Liquidation Leverage: $117,939-$115,500
CME Gap: $117,235-$113,800
Stop Loss(SL): $108,670 /If your long position trigger was near the lower lines of the descending channel, it could be =Stop Loss(SL)=$106,417
Please respect each other's ideas and express them politely if you agree or disagree.
Bitcoin Analyze (BTCUSDT), 1-hour time frame.
Be sure to follow the updated ideas.
Do not forget to put a Stop loss for your positions (For every position you want to open).
Please follow your strategy and updates; this is just my Idea, and I will gladly see your ideas in this post.
Please do not forget the ✅' like '✅ button 🙏😊 & Share it with your friends; thanks, and Trade safe.

US30 Pullback Toward 45,100 as DXY Weakens on Dovish Fed ToneHey Traders, in today's trading session we are monitoring US30 for a buying opportunity around the 45,100 zone. Dow Jones (US30) remains in an uptrend, with price currently correcting toward this key support/resistance level.
Structure: The broader bias is bullish, though price is retracing after recent highs.
Key level in focus: 45,100 — acting as a key zone within the ongoing trend.
Fundamentals: The US Dollar Index (DXY) faced strong rejection at 98.700 following the Fed’s dovish stance at the Jackson Hole symposium. This bearish dollar sentiment could support US equities due to their negative correlation.
Next move: Holding above 45,100 may keep US30’s bullish momentum intact, while a decisive break lower would suggest deeper retracement.
Monitoring price behavior at this level to gauge whether buyers step in.
Trade safe,
Joe.

GOLD → Bullish trend. Pullback before growthFX:XAUUSD continues to gradually storm the 3375-3405 area, paving its way to strong resistance at 3410. The fundamental background is relatively positive, with a bullish trend.
Gold has retreated slightly from its two-week peak ($3400), but retains its growth potential against the backdrop of two key factors: Pressure on Fed Chair Lisa Cook is undermining confidence in the dollar and strengthening demand for defensive assets. New tariffs on China and India are reviving fears about global growth, which is beneficial for safe havens.
But there are also restraining factors: A strong dollar could limit gold's growth. It is also worth paying attention to Friday's US inflation data (PCE), which will determine the further trend. Soft data will reinforce expectations of a Fed rate cut and push gold higher.
Resistance levels: 3386.5, 3393.5
Support levels: 3373.7, 3369.6
Movements up to 3410 may be zigzagging due to the fairly heavy zone of 3375 - 3410 (this can be seen in the volume profile). Focus on local but strong support: 3373 - 3369, the market may test this area before storming resistance 3386 - 3393 for growth to 3405 - 3410.
Best regards, R. Linda!

NZDJPY → A false breakout of resistance will trigger a declineFX:NZDJPY entered a correction phase after a sharp decline. The main trend is downward, with a countertrend movement aimed at consolidating potential before further decline.
A countertrend correction is forming against the backdrop of the main downward trend. The current movement may be aimed at hunting for liquidity before continuing its movement. Focus on the resistance zone at 86.67
The currency pair is trading below key resistance within the global downtrend. As part of the correction, the price may test 86.67 - 87.10 before continuing the main trend.
Resistance levels: 86.67, 86.97, 97.11
Support levels: 85.97, 85.6
If a false breakout of the key zone of interest forms during the correction without the possibility of continuing growth, we will receive confirmation that the market is ready to move down. Consolidation below the level may trigger a downward impulse.
Best regards, R. Linda!

BTCUSD Elliott Wave AnalysisBull and bear analysis of BTCUSD.
For simplicity, I have a completed impulse off April 2025 low to ATH.
Bulls see a zigzag correction completed (green), key support 108757.90 and break above 117439.46 providing some confirmation.
Bears see continuing impulse price action to downside, with 117439.46 holding as resistance and 108757.90 breaking as support.

Critical - DOT weekly update Aug 27 - 2ndPolkadot has developed a structure that rests on very shaky ground and could flip from bullish to bearish at any time. The main concern lies with the Minor Wave 2, which retraced exactly 100%. According to Elliott Wave rules, a Wave 2 may not retrace beyond the starting point of Wave 1, making this a near-perfect but fragile setup. Nevertheless, given the ongoing correlation with other altcoins, I have kept this scenario as my primary count.
From an Elliott Wave perspective, DOT is now positioned at the start of Minor Wave 3, which also aligns with Intermediate Wave 3 and Primary Wave 3. Altogether, this creates a technically solid setup for swing long positioning—provided that the structure holds.
The order book shows some clustering around the high of Minor Wave 1, but no significant concentrations beyond that. Similarly, the liquidation heatmap remains sparse, with only minor liquidity pockets at the high of Wave 1.
Derivative data confirms this lack of conviction, as funding rates are neither strongly positive nor negative. This reflects a market in uncertainty—neither euphoric nor fearful. Broader macro correlations may also be a factor, especially with Nvidia’s (NVDA) earnings announcement tomorrow. Tech and crypto often move in tandem, meaning the results could play an important role in shaping DOT’s next move.
For now, I will wait to see how events unfold, particularly as I am already positioned in Cardano. Positive earnings could act as a catalyst for a potential Wave 3 breakout, while negative results could instead trigger a deeper correction.

WE ARE BACK - ADA weekly update Aug 27 - 02thGiven the current structure, Cardano is most likely completing a 1–2 sequence at the Minor degree within the early stages of Primary Wave 3. This would imply that we are entering one of the most dynamic waves in the Elliott framework. Alternatively, this structure could still be part of a corrective phase, forming a Wave C that drives price to a new local low. However, considering broader correlations across the crypto market, I favor the bullish count.
The order book reveals significant buy-side interest around the $1.00 level, which further supports the bullish case. The liquidation heatmap shows no major liquidity clusters, only smaller pockets around the high of Minor Wave 1.
Derivative data adds weight to this scenario, with funding rates turning back from negative levels and open interest stabilizing following the Sunday pump.
Overall, the broader setup presents a favorable environment for upside continuation. At current levels, the chart offers an excellent opportunity for swing positions, as it is unlikely that price will revisit this area in the medium term. Personally, I intend to position accordingly.
Do your own research. Not financial advice.

Gold Long: Wave 3 of 3 of 3 of 5 UpIn this long video, I updated the wave counts for Gold and explained the rationale for putting the stop loss (above support instead of below) and raised concerns about volatility due to Nvidia earnings release.

USDJPY Short Update 2: Double combinationI have actually recorded a video for this but then I accidentally cancelled it. The summary is as below:
1. this is still a short idea.
2. Previous analysis yesterday on USDJPY short assumed wrongly that it is a single 3-wave correction. Turns out that it is a double combination.
3. The stop loss is above the Y wave (above 148.185).
4. The take profit, or price to review again this idea, is at the trendline labelled "First Target".
Good luck!
