Bulls Hang Tough - US Data and Holiday Trading Make or BreakThanksgiving week delivered a nice rally to help November finish higher than October
It's now December and we have a myriad of US News hitting the headlines before Christmas and New Year's bring us into 2026
ADP Non-Farm
US PMI
US Core PCE
Non-Farm
CPI / PPI
FOMC (December Rate Cut Likely)
Price action is truly key. November ended with a nice stable rally with broad market pumps encouraging an equal weight comeback trade for now (nearly 60% of S&P stocks > 50 period moving average, and 60% of S&P stocks > 200 period moving average)
If the markets avoid a major slip or disruption to end the year, animal spirits may remain optimistic enough to keep the party going in 2026 and continue to climb the wall of worry as sentiment remains pessimistic
US Market Key Levels
1) Oct 10 and Nov 20 candle lows
2) 200 period moving average
3) February 2025 all-time highs area
Sector rotation is pretty clear. Broader market rotation is pretty clear, but overall the markets need to continue to show stable and steady earnings growth and trends and keep the AI narrative glowing with a positive outlook
FOMC

01/12/25 Weekly OutlookLast weeks high: $93,088.10
Last weeks low: $85,279.04
Midpoint: $89,183.57
A brutal start to the week for the bulls here. A -6% move to the downside as soon as the Month of December opens rejecting off the range weekly high. Across the high time frame this confirms a new lower high and a failure to get back within the trend that has stayed consistent throughout this bull market.
All of last weeks recovery bounce has been wiped out in a matter of hours, so now the question is where does the buy side pick up, if at all? FOMC interest rate decision is predicting another rate cut (80% probability) as well as the end of quantitative tightening and the beginning of quantitative easing on paper should bring more liquidity into risk-on markets such as Bitcoin, but that is on a longer timescale.
In the more immediate time frame I think the range broadly $80,000-$100,000 with this weeks range seeing a lot of the noisy PA. Midpoint is a key S/R level to gauge sentiment and conviction, a reclaim of the level may open the door to a stop loss hunt around weekly high but for now the momentum is definitely with the bears.

Will December Rate Cut Save the Market?Is Rate Cut Probability up a Short-Term Bounce or continuation of the downtrends?

Gold softens after Fed minutes as smokestacks cap every rally Is there any way we can get a December rate cut now?
Gold has softened after the release of the minutes from the Federal Reserve's last interest rate decision.
The minutes show there’s no unified push toward cutting, which could make a December move unlikely.
Several Federal Reserve officials supported lowering rates in October, but others preferred keeping policy unchanged, and some pushed back firmly against easing.
Technically, XAUUSD continues to form smokestacks, printing repeated double-top structures. The price is now hovering around 4,070, sitting under possible short-term resistance at 4,150. XAUUSD losing the 50-day MA further could shift bias more decisively lower.

EURUSD Breakout and Potential RetraceHey Traders, in today's trading session we are monitoring EURUSD for a buying opportunity around 1.15700 zone, EURUSD was trading in a downtrend and successfully managed to break it out. Currently is in a correction phase in which it is approaching the retrace area at 1.15700 support and resistance area.
Trade safe, Joe.

GOLD BOUNCES FROM $4,000 - FOMC MINUTES TODAY!💰 GOLD BOUNCES FROM $4,000 - FOMC MINUTES TODAY! 📈
Current Price: $4,085 - $4,090 🟢
Opening Price: $4,079
Yesterday's Close: $4,066 (+0.56%)
Today's Performance: +0.56% ✅
Status: 🟢 RECOVERY MODE - CRITICAL DAY
🚨 MAJOR EVENT TODAY - FOMC MINUTES! ⚡
THE $4,000 SUPPORT HELD! Gold successfully defended the critical psychological level and is now bouncing. But TODAY is the most important day this week!
What's Happening:
✅ $4,000 Support HELD - Bulls defended successfully!
✅ Morning Star Pattern Formed - Bullish reversal signal at support
✅ FOMC Minutes TODAY - Will determine next major move
✅ NFP Data Thursday - First post-shutdown jobs report
✅ Risk-Off Sentiment - Safe-haven flows supporting gold
✅ Expected to RISE - Analysts forecast upward movement
📊 TECHNICAL ANALYSIS
Market Structure: BULLISH RECOVERY 🟢🟢
Gold has bounced off the ascending trendline AND the $4,000 psychological level - a DOUBLE support confluence! Bulls are back in control short-term.
Key Development: Bulls managed to hold psychological level of $4,005 and formed Morning Star pattern indicating renewed buying activity
Critical Support Levels (Defended!) 🔵
Support 1: $4,050 - $4,060 (Current base - Strong)
Support 2: $4,000 - $4,005 (HELD! Psychological + Trendline)
Support 3: $3,987 - $4,002 (November open)
Support 4: $3,965 (November 6 low)
Support 5: $3,930 (Major support)
Key Resistance Levels (Recovery targets) 🔴
Resistance 1: $4,096 - $4,100 (KEY - 50-day MA + Descending trendline)
Resistance 2: $4,112 - $4,120 (20-day SMA - Strong)
Resistance 3: $4,140 - $4,150 (Major barrier)
Resistance 4: $4,170 - $4,212 (Previous descending trendline)
📈 TECHNICAL INDICATORS
RSI (14): 49 (Neutral - Can move either direction) ⚪
MACD: Rising sharply, approaching zero line (Bullish momentum!) 🟢
MFI: Growing - Liquidity inflow into asset ✅
4H RSI: Bounced up but below 50 (Recovery attempt) ⚡
Moving Averages:
Price broke above 100-day MA ✅
Testing 50-day MA at $4,096 🔴
20-day SMA at $4,112 (Resistance) 🔴
Above ascending trendline ✅
VWAP & SMA20: Aligned with market price - Equilibrium between buyers/sellers
🎯 TODAY'S TRADING STRATEGIES
SCENARIO 1: BULLISH BREAKOUT 🟢 (60% Probability)
On November 20, 2025, price of XAU/USD expected to RISE
IF Gold Breaks Above $4,100:
Break of descending trendline and 50-day MA around $4,096 could open rally toward $4,212
LONG Setup:
Entry: Break and close above $4,100-$4,112
Targets:
TP1: $4,140 📍 (+40 pips)
TP2: $4,170 📍 (+70 pips)
TP3: $4,212 📍 (+112 pips - Previous trendline touch)
Stop Loss: $4,065 (Below support)
Risk/Reward: Excellent 1:3+ ratio ✅
SCENARIO 2: FALSE BREAKOUT / REJECTION 🔴 (30% Probability)
IF Gold Gets Rejected at $4,096-$4,112:
Bulls tried but failed - retest of support coming
SHORT Setup (Scalp):
Entry: Rejection at $4,100-$4,112 (confirmed with bearish candle)
Targets:
TP1: $4,065 📍
TP2: $4,050 📍
TP3: $4,000 📍 (Retest)
Stop Loss: $4,125 (Tight!)
⚠️ WARNING: This is counter-trend - use small positions!
SCENARIO 3: FOMC VOLATILITY 📊 (10% Probability)
IF FOMC Minutes Cause Whipsaw:
Strategy: WAIT for Clear Direction
Let the dust settle after FOMC release
Trade the REACTION, not the news
Entry: After 30-60 minutes of FOMC release
Follow the momentum with trend
💎 BEST TRADE SETUPS FOR TODAY
CONSERVATIVE APPROACH (Highly Recommended!) 🎯
WAIT FOR FOMC MINUTES! Don't trade BEFORE the release.
Setup A - Breakout Play (Preferred):
WAIT for FOMC minutes (Today, US session)
IF gold breaks $4,100-$4,112 with volume
Entry: $4,105-$4,112 (after confirmation)
Target: $4,140 → $4,170 → $4,212
SL: $4,080
Why: Riding institutional momentum
Setup B - Dip Buy:
IF gold pulls back to $4,050-$4,060
Entry: $4,052-$4,060 (on bounce)
Target: $4,100 → $4,120
SL: $4,035
⚠️ DO NOT TRADE during first 30 min after FOMC release! Wait for clarity!
🌍 FUNDAMENTAL ANALYSIS
TODAY'S MAJOR EVENTS 📅
🔥 FOMC MINUTES (US Session - CRITICAL!)
This is THE event today. Will show:
Fed's thinking on December rate cut
Concerns about economy post-shutdown
Inflation outlook
Market waiting for FOMC Minutes release and speech by Fed member John Williams
Thursday: NFP Data (First post-shutdown report)
September NFP expected: +50,000 jobs
Unemployment Rate: 4.3% (forecast)
This could be market-moving!
BULLISH FACTORS ⬆️⬆️
✅ $4,000 Support Held - Technical strength confirmed
✅ Morning Star Pattern - Bullish reversal at support
✅ Risk-Off Sentiment - Stocks falling, gold rising
✅ Softer Treasury Yields - Making gold more attractive
✅ Shutdown Concerns - Economic weakness = gold support
✅ Analysts predict gold may reach $4,456-$4,509 by end November
✅ Central banks targeting 750-900 tonnes purchases for 2025
BEARISH RISKS ⬇️
⚠️ Hawkish FOMC - If minutes show Fed reluctant to cut rates
⚠️ Strong NFP Thursday - Would reduce rate cut odds
⚠️ Resistance at $4,100-$4,112 - Strong technical barrier
⚠️ December Rate Cut Odds - Only 43% (down from 63%)
⚠️ DXY Still Above 99.50 - Dollar maintaining strength
🔥 MARKET SENTIMENT: CAUTIOUSLY BULLISH
What's Different Today:
The $4,000 level held perfectly - this is VERY bullish technically. But FOMC minutes could change everything in minutes!
Analyst Views:
Short-term (Today/Tomorrow):
$4,000 held, bulls need acceptance above $4,100 for rally to gather steam. FOMC minutes will determine direction.
This Week:
Critical - FOMC + NFP data will set tone for rest of November
Month End:
IF recovery continues → $4,200-$4,300 possible
IF rejected at $4,100 → Chop between $4,000-$4,100
💡 PROFESSIONAL GAME PLAN
For DAY TRADERS:
⚡ Wait for FOMC!
Do NOT trade 1 hour before release
Do NOT trade first 30 min after release
After dust settles, trade the direction
Use tight stops (whipsaws common)
For SWING TRADERS:
📊 This is Your Setup!
IF $4,100 breaks with FOMC → GO LONG (hold 3-5 days to $4,170+)
IF rejected at $4,100 → WAIT for next dip to $4,000
Target: $4,212 (1-2 week hold)
For LONG-TERM INVESTORS:
💎 Accumulation Zone
$4,000-$4,080 range is BUYING opportunity
Long-term targets: $4,500-$5,000 (2026)
Strategy: Build position gradually
Vision: Multi-month hold
📅 TODAY'S TIMELINE
Asian Session (Done): Gold bounced to $4,085-$4,090 ✅
European Session (Now): Consolidation before FOMC
US Session: FOMC MINUTES RELEASE 🔥🔥🔥
After FOMC: Big volatility expected - direction determined
Tomorrow (Thursday):
NFP Data (September) - First post-shutdown
This will confirm or reverse today's move
🎬 BOTTOM LINE (TL;DR)
Price: $4,085 (Bouncing)
Bias: 🟢 BULLISH (IF breaks $4,100)
Key Level: $4,100 (Break = Rally | Reject = Chop)
Today's Event: FOMC MINUTES (Trade-defining!)
Best Action: WAIT for FOMC, then trade the breakout
Risk Level: HIGH (Event volatility!)
🔔 THE $4,100 LEVEL - TODAY'S BATTLEGROUND!
IF GOLD BREAKS ABOVE $4,100-$4,112:
✅ Bulls win!
✅ Target $4,140 → $4,170 → $4,212
✅ Possible rally to $4,250+
✅ GO LONG after confirmation
IF GOLD REJECTS AT $4,100:
⚠️ Bulls stall
⚠️ Range between $4,000-$4,100 continues
⚠️ Wait for next setup
⚠️ Don't force trades
FOMC DECIDES EVERYTHING!
📊 Dovish = GOLD UP 🚀
📊 Hawkish = GOLD DOWN/SIDEWAYS 📉
📊 TECHNICAL OUTLOOK
Trend: 🟢 BULLISH (Short-term recovery active)
Momentum: IMPROVING - MACD rising 📈
Support: HOLDING at $4,050-$4,060 ✅
Resistance: TESTING at $4,096-$4,112 🎯
Pattern: Morning Star reversal + Trendline bounce
Next Move: Break $4,112 = UP | Reject = CHOP
Key Technical:
Having bounced off ascending trendline and $4,000, gold broke above 100-day MA and now testing descending trendline/50-day MA confluence
⚠️ RISK MANAGEMENT - FOMC DAY!
✅ Wait for FOMC - Don't guess the news!
✅ Small Positions - Risk MAX 1% (High volatility!)
✅ Wide Stops - Give trades room (40-50 pips)
✅ Quick Profits - Lock gains on FOMC spikes
✅ No Revenge - If wrong, accept and move on
🎯 SWING TRADE SETUPS
Setup A - FOMC Breakout (Recommended):
WAIT for FOMC minutes release
Entry: IF breaks $4,112 (after FOMC)
Target 1: $4,170 (Hold 2-3 days)
Target 2: $4,212 (Hold 5-7 days)
Target 3: $4,250 (Hold 1-2 weeks)
Stop Loss: $4,070
Setup B - Rejection Trade:
Entry: IF rejected at $4,100 (after FOMC)
Target 1: $4,050 (Hold 1-2 days)
Target 2: $4,000 (Hold 2-3 days)
Stop Loss: $4,125
🏆 PROFESSIONAL ANALYSIS SUMMARY
Gold has executed a PERFECT TECHNICAL BOUNCE from the $4,000 psychological level. The formation of a Morning Star candlestick pattern at support is a classic bullish reversal signal.
The Setup:
Price trading at $4,085.62 as of 19.11.2025
Held $4,000 support perfectly (double bottom with trendline)
Now testing critical $4,096-$4,112 resistance zone
FOMC minutes today will determine next major move
Most Likely Scenarios:
Scenario 1 (60%):
FOMC shows Fed concerned about economy → Gold breaks $4,112 → Rally to $4,170-$4,212
Scenario 2 (30%):
FOMC shows Fed staying hawkish → Gold rejected at $4,100 → Range $4,000-$4,100 continues
Scenario 3 (10%):
FOMC very dovish → Gold explodes through $4,212 → $4,250+
The Big Picture:
$4,000 holding is VERY bullish. This was the make-or-break level and bulls defended it perfectly. If FOMC is dovish or neutral, gold has clear path to $4,200+
💪 TRADING PSYCHOLOGY TIP
THE BOUNCE IS HERE!
Yesterday we were at $4,000 and scared. Today we're at $4,085 and hopeful. This is why you MUST have a plan and stick to it. Those who bought at $4,000 yesterday are now profitable. Discipline wins! 🎯
🎓 LESSON: THE MORNING STAR PATTERN
What happened at $4,000:
Day 1: Long bearish candle (fear)
Day 2: Small candle (indecision)
Day 3: Long bullish candle (bulls return)
This is a Morning Star - one of the most reliable bullish reversal patterns! It shows bears exhausted and bulls taking control.
Trading Strategy:
When you see this at major support (like $4,000), it's a HIGH probability long setup!
🔮 FORECAST
Today: FOMC minutes → Breakout $4,112 OR rejection
Tomorrow: NFP data → Confirm today's direction
End of Week: $4,140-$4,170 OR back to $4,000
Next Week: Recovery continues to $4,200+ if $4,100 breaks
Month End: $4,250-$4,300 (IF bullish scenario plays out)
🚨 FOMC MINUTES - WHAT TO WATCH FOR
Dovish Signals (Gold UP 🟢):
Concerns about economic weakness
Mentions of shutdown impact
Opens door to December cut
Worries about labor market
Hawkish Signals (Gold DOWN/FLAT 🔴):
Confidence in economy
Inflation still concerning
No urgency to cut rates
Strong labor market comments
Neutral (Gold CHOP ⚪):
Data-dependent language
Wait-and-see approach
No clear direction
📊 SUPPORT/RESISTANCE SUMMARY
Strong Support: $4,050, $4,000 (CRITICAL)
Weak Support: $4,065, $4,040
Weak Resistance: $4,096, $4,100
Strong Resistance: $4,112, $4,140, $4,170, $4,212
Breakout Level: $4,112 (Game changer!)
Breakdown Level: $4,000 (Would be very bearish)
⚠️ FINAL DISCLAIMER
Today is a high-impact event day. FOMC minutes can cause extreme volatility and rapid price swings. This analysis is for educational purposes only. Never trade the news blindly - wait for confirmation. Use stop losses religiously. Position sizes should be smaller than normal on event days. False breakouts are common immediately after news. The first move after FOMC is often NOT the real move. Past performance does not guarantee future results. Consult a licensed financial advisor before trading.
📱 CRITICAL DAY AHEAD!
💬 FOMC minutes in few hours!
🔔 HIGH volatility expected
⚡ Trade the reaction, not the prediction!
🙏 Be patient, be disciplined!
#Gold #XAUUSD #FOMC #ForexTrading #TechnicalAnalysis #NFP #MorningStar #BullishReversal #EventTrading #RiskManagement #FOMCMinutes #MarketAnalysis #DayTrading #SwingTrading
BTC — Original Distribution Still UnfinishedBTC continues to move inside unfinished structure. Risk tone is neutral and overnight flows were thin, leaving the market waiting for direction from today’s U.S. releases. The only event with enough weight to shift risk appetite is the FOMC Minutes later today.
On the chart, BTC has rejected the original bullish distribution gap at 88,804.64 for several sessions. That gap remains unclosed, which signals unfinished architecture rather than trend continuation. Price is still confined within Monday’s range between 91,158 and 95,950, forming a clean mid-range compression. Nothing in this structure confirms resolution yet.
Market Structure Mapping views this compression as a neutral regime: the market is balancing, not trending. The failure to close the distribution zone shows the prior move left imbalance behind, and markets generally rebalance before committing to a new leg. Retail sees “sideways.” Professionals see preparation.
The non-obvious point: this isn’t hesitation; it’s the market restoring balance before revealing intent.
For operators, the approach is straightforward. Let New York volatility clear the noise. Structural clarity only appears once price resolves above 95,950 or below 91,158. Anything before that is positioning, not direction.
— CORE5DAN
Institutional Logic. Modern Technology. Real Freedom.

GOLD RECOVERS AFTER WEEKEND - CRITICAL WEEK AHEAD💰 GOLD RECOVERS AFTER WEEKEND - CRITICAL WEEK AHEAD ⚡
Current Price: $4,088 - $4,092 📉
Opening Price: $4,171
Today's Range: $4,032 - $4,212
Weekend Change: -6.11% (Monthly decline)
Status: 🟡 RECOVERY MODE - VOLATILE
🎯 WEEKEND RECAP - WHAT HAPPENED?
Gold had a VOLATILE Friday, dropping from $4,235 to test $4,032 lows before recovering. The weekend showed:
❗ Sharp Sell-Off - Price dropped nearly $200 from Thursday's highs
❗ Weekend Gap - Opened lower Monday morning
❗ Bounce Attempt - Trying to recover above $4,088
❗ Critical Support Test - $4,000-$4,050 zone being tested
What's Different This Week?
Markets will focus on FOMC minutes and speeches from monetary policy officials this week
📊 TECHNICAL ANALYSIS
Market Structure: CORRECTIVE PHASE 🟡⚠️
Gold is in a corrective pullback after last week's rally. This is a critical moment - the market is testing support zones to see if bulls can defend or if bears take control.
Pattern: Triangle formation showing trader indecision - pivot point around $4,110 will determine direction
Critical Support Levels (MUST HOLD!) 🔵
Support 1: $4,080 - $4,088 (Current fight zone - CRITICAL!)
Support 2: $4,045 - $4,060 (Strong dip-buy zone)
Support 3: $4,000 - $4,020 (Psychological + deep support)
Support 4: $3,987 - $4,002 (November open - Major)
Support 5: $3,930 (Bullish invalidation - DO NOT BREAK!)
Key Resistance Levels (Recovery targets) 🔴
Resistance 1: $4,110 - $4,120 (Momentum pivot - KEY!)
Resistance 2: $4,150 - $4,165 (Rejection zone)
Resistance 3: $4,187 - $4,200 (Last week's high)
Resistance 4: $4,252 - $4,254 (Major breakout level)
📈 TECHNICAL INDICATORS
RSI (14): ~45-48 (Neutral to slightly bearish) ⚠️
MACD: Bearish crossover forming - Caution! 📉
Stochastic: Oversold zone - Bounce potential ✅
Moving Averages:
Price testing 20-day EMA support 🔴
50-day EMA at $3,800 (long-term support) ✅
Death cross forming on hourly charts ⚠️
Volume: High on decline - institutional selling present
Bollinger Bands: Price touching middle band - volatility compression
🎯 TODAY'S TRADING STRATEGIES
SCENARIO 1: BULLISH RECOVERY 🟢 (45% Probability)
IF Gold Breaks Above $4,110-$4,120:
Closing above $4,110 gives more odds for bull continuation, while closing below gives hand to sellers
LONG Setup:
Entry: Break and hold above $4,112-$4,120
Targets:
TP1: $4,150 📍 (+40 pips)
TP2: $4,187 📍 (+70 pips)
TP3: $4,210 📍 (+90 pips)
Stop Loss: $4,075 (Below support)
Risk/Reward: 1:2 minimum ✅
SCENARIO 2: FURTHER DECLINE 🔴 (40% Probability)
IF Gold Breaks Below $4,060:
This opens door for deeper correction.
SHORT Setup (Scalping):
Entry: Break below $4,058 with volume
Targets:
TP1: $4,020 📍
TP2: $4,000 📍
TP3: $3,987 📍
Stop Loss: $4,090
⚠️ WARNING: This is against long-term trend - smaller positions!
SCENARIO 3: RANGE-BOUND ⚪ (15% Probability)
IF Gold Stays Between $4,060-$4,120:
Range Trading:
Buy: $4,060-$4,070
Sell: $4,110-$4,120
Scalp targets: 30-40 pips
Tight SL: 25-30 pips
💎 BEST TRADE SETUP FOR TODAY
CONSERVATIVE APPROACH (Strongly Recommended!) 🎯
WAIT AND WATCH - Market is at a critical junction!
Option A - Buy the Dip (Preferred):
Entry: $4,045-$4,060 (if it drops)
Target: $4,120 → $4,150
SL: $4,025
Why: Strong support zone with high R:R
Option B - Breakout Play:
Entry: Above $4,122 (confirmed break)
Target: $4,150 → $4,187
SL: $4,095
⚠️ DO NOT CHASE at current price ($4,088-$4,095)! Wait for clear setup.
🌍 FUNDAMENTAL ANALYSIS
THIS WEEK'S KEY DRIVERS 📅
This week moderate volatility expected as markets await FOMC minutes and speeches by monetary policy officials
What to Watch:
FOMC Minutes Release - Critical for rate cut expectations
Fed Speakers All Week - Watch for hawkish/dovish tones
Economic Data - Delayed reports may start releasing
Dollar Strength - DXY testing resistance
BULLISH FACTORS ⬆️
✅ Central banks purchased 634 tonnes YTD, WGC expects 750-900 tonnes total for 2025
✅ ETF holdings grew by 619 tonnes ($64 billion) in 2025
✅ Analysts predict gold may reach $4,456-$4,509 by end of November
✅ Fed rate cut still 63% probability for December
✅ Geopolitical tensions remain elevated
✅ Inflation hedge demand continues
BEARISH RISKS ⬇️
⚠️ Technical Breakdown - Lost $4,200+ levels
⚠️ Strong Dollar - DXY showing strength
⚠️ Profit Taking - After 7% rally last week
⚠️ Overbought Unwinding - Correction from ATH
⚠️ Reduced Safe-Haven Demand - Risk-on sentiment
🔥 MARKET SENTIMENT: CAUTIOUSLY BEARISH SHORT-TERM
What Analysts Say:
Short-term (This Week):
Expected to trade between $4,114 and $4,254 - both upward and downward movements possible
Medium-term (November End):
Gold expected to recover toward $4,200-$4,300 range
Long-term (2025-2026):
Bullish outlook remains - targets $4,500-$5,000
💡 PROFESSIONAL GAME PLAN
For DAY TRADERS:
⚡ Scalp with Caution
Market is choppy and dangerous
Use tight stops (20-25 pips max)
Take quick profits
Trade the bounces/rejections at key levels
For SWING TRADERS:
📊 Wait for Clear Direction
Don't catch falling knife at $4,088
Best entry: $4,045-$4,060 (support bounce)
Alternative: Above $4,122 (breakout confirmation)
Target: $4,200+ (1-2 week hold)
For LONG-TERM INVESTORS:
💎 Accumulation Zone
This dip could be opportunity
Target: $4,000-$4,050 range
Strategy: Dollar-cost averaging
Vision: Hold for $4,500+ (2026)
📅 CRITICAL EVENTS THIS WEEK
Monday (Today):
Market sentiment assessment
Watch for bounce or breakdown
Tuesday-Wednesday:
FOMC minutes release
Fed speakers (CRITICAL!)
Thursday-Friday:
Economic data releases
Weekly close direction important
🎬 BOTTOM LINE (TL;DR)
Price: $4,088 (Volatile)
Bias: 🟡 NEUTRAL-BEARISH (Short-term caution)
Key Level: $4,110 (Above = Bulls, Below = Bears)
Best Action: WAIT for $4,045-$4,060 dip OR $4,122 breakout
Risk Level: HIGH (Extreme volatility)
🔔 TODAY'S CRITICAL BATTLE ZONES
THE LINE IN THE SAND: $4,110
ABOVE $4,110:
✅ Bulls in control
✅ Target $4,150 → $4,187
✅ Recovery mode active
BELOW $4,060:
❌ Bears in control
❌ Target $4,020 → $4,000
❌ Correction deepens
BETWEEN $4,060-$4,110:
⚪ Indecision zone
⚪ Wait for breakout
⚪ High chop risk
📊 TECHNICAL OUTLOOK
Trend: ⚠️ BULLISH (Long-term) but CORRECTING (Short-term)
Momentum: WEAK - Bearish pressure 📉
Support: TESTING at $4,080 🔴
Resistance: STRONG at $4,110-$4,120 🚧
Pattern: Descending triangle / Bull flag correction
Next Move: Break $4,110 = UP | Break $4,060 = DOWN
⚠️ RISK MANAGEMENT - CRITICAL TODAY!
✅ Smaller Positions - Market is volatile (1% risk max)
✅ Wider Stops - Give trades room (40-50 pips)
✅ Quick Profits - Don't be greedy, lock gains fast
✅ Respect $4,110 - This is THE level today
✅ Avoid Revenge Trading - If stopped, step away
🎯 SWING TRADE SETUPS
Setup A - Dip Buy (Recommended):
Entry: $4,045-$4,060 (wait for this!)
Target 1: $4,120 (Hold 2-3 days)
Target 2: $4,187 (Hold 5-7 days)
Target 3: $4,252 (Hold 1-2 weeks)
Stop Loss: $4,020
Setup B - Breakout Recovery:
Entry: $4,125-$4,130 (after confirmed break)
Target 1: $4,187 (Hold 3-5 days)
Target 2: $4,252 (Hold 1 week)
Stop Loss: $4,090
🏆 PROFESSIONAL ANALYSIS SUMMARY
Gold is at a CRITICAL CROSSROADS. After rallying 7% last week, the market pulled back sharply on Friday, testing support levels.
The Setup:
Gold rose to $4,091.53, up 0.19% but down 6.11% over the past month
Testing key support at $4,080-$4,088
$4,110 is the pivot - direction depends on this level
Most Likely Scenarios:
Scenario 1 (45%):
Brief consolidation → Break $4,110 → Recovery to $4,150-$4,200
Scenario 2 (40%):
Drop to $4,045-$4,060 → Strong bounce → Retest $4,110
Scenario 3 (15%):
Chop between $4,060-$4,120 for 1-2 days
The Big Picture:
Long-term trend is STILL bullish. This is likely a healthy correction before next leg up. Analysts still expect $4,456-$4,509 by end of November
💪 TRADING PSYCHOLOGY TIP
DON'T PANIC! Corrections are NORMAL and HEALTHY. Last week gold rallied 7% - it NEEDS to rest. Use this dip as opportunity, not fear. The long-term trend hasn't changed! 🚀
🎓 KEY LESSON: THE PIVOT POINT
Today's pivot is $4,110. In trading, pivot points are levels where price "decides" direction. Think of it like a seesaw:
Above $4,110 = Weight shifts to bulls
Below $4,110 = Weight shifts to bears
Action: Wait for price to choose a side, then follow!
🔮 WEEK FORECAST
Monday: Consolidation $4,060-$4,120 (Today)
Tuesday: FOMC minutes could spark breakout
Wednesday: Direction becomes clear
Thursday-Friday: Follow-through in chosen direction
Week End Target: $4,150-$4,200 OR $4,000-$4,040
🚨 CRITICAL WARNINGS
⚠️ FOMC Week - Expect HIGH volatility
⚠️ Don't Catch Falling Knife - Wait for support
⚠️ Triangle Pattern - Indecision = dangerous
⚠️ Weekend Gap Risk - Price can gap Monday AM
⚠️ False Breakouts - Confirm with volume
📊 SUPPORT/RESISTANCE SUMMARY
Strong Support: $4,045, $4,000, $3,987
Weak Support: $4,080, $4,060
Weak Resistance: $4,110, $4,120
Strong Resistance: $4,150, $4,187, $4,252
Breakout Level UP: $4,122
Breakdown Level DOWN: $4,058
⚠️ FINAL DISCLAIMER
This analysis is for educational and informational purposes only. Gold trading is highly volatile and risky, especially this week with FOMC minutes. Never risk more than 1-2% per trade. Always use stop losses. Past performance does not guarantee future results. The information provided is not financial advice. Consult a licensed financial advisor before making investment decisions.
📱 Stay sharp this week!
💬 Share your trades carefully
🔔 High volatility = High opportunity but HIGH RISK
⚡ Follow for updates as market develops
#Gold #XAUUSD #ForexTrading #TechnicalAnalysis #TradingView #FOMC #MarketAnalysis #DayTrading #SwingTrading #RiskManagement #TradingStrategy #GoldForecast #VolatilityTrading

XAUUSD: Gold is going to hit $5,000 USD. 1. Uptrend Confirmation:
• After a period of correction/sideways movement (from around mid-October to early November), the recent Heikin Ashi candles have started turning green/bullish (corresponding to the dark green color in your target zone).
• The green candle bodies are lengthening and have short or non-existent lower wicks, which is a classic sign of a strong and sustainable uptrend on a Heikin Ashi chart.
2. Short-term Resistance Breakout:
• The current price ($4,087.880) has broken above the previous short-term resistance area (the red line and the price zone around $4,003.410 - $4,091.265), and is above the moving averages (EMAs - the thin red and green lines), indicating that buying pressure has taken control.
3. Buy Trade Setup (Long Position):
• The chart shows a BUY trade setup with an entry price within the $4,091.265 region.
• Take Profit (TP) Target: Set at a very high level, $4,987.515. This implies an extremely strong expectation for price appreciation, possibly based on extended analysis (Fibonacci Extension) or large institutional price forecasts.
• Stop Loss (SL) Level: Set at $4,003.410, just below the old support/resistance zone, demonstrating clear risk control.

QE is Back, Why?When he said, 'cease the balance sheet runoff,' it means the Fed plans to keep its balance sheet stable — basically, to stop their balance sheet from shrinking any further under quantitative tightening. But that doesn’t mean they’re starting quantitative easing again.
10 Year Yield Futures
Ticker: 10Y
Minimum fluctuation:
0.001 Index points (1/10th basis point per annum) = $1.00
Disclaimer:
• What presented here is not a recommendation, please consult your licensed broker.
• Our mission is to create lateral thinking skills for every investor and trader, knowing when to take a calculated risk with market uncertainty and a bolder risk when opportunity arises.
CME Real-time Market Data help identify trading set-ups in real-time and express my market views. If you have futures in your trading portfolio, you can check out on CME Group data plans available that suit your trading needs www.tradingview.com
FOMC conference transcript on 29 Oct 25 pertaining to Fed's balance sheet:
"We also decided to conclude the reduction of our aggregate securities holdings as of December 1.
At today’s meeting, the Committee also decided to conclude the reduction of our aggregate securities holdings as of December 1. Our long-stated plan has been to stop balance sheet runoff when reserves are somewhat above the level we judge consistent with ample reserve conditions. Signs have clearly emerged that we have reached that standard. In money markets, repo rates have moved up relative to our administered rates, and we have seen more notable pressures on selected dates along with more use of our standing repo facility. In addition, the effective federal funds rate has begun to move up relative to the rate of interest on reserve balances. These developments are what we expected to see as the size of our balance sheet declined and warrant today’s decision to cease runoff.
Over the 3-1/2 years that we have been shrinking our balance sheet, our securities holdings have declined by $2.2 trillion. As a share of nominal GDP, our balance sheet has fallen from 35 percent to about 21 percent. In December, we will enter the next phase of our normalization plans by holding the size of our balance sheet steady for a time while reserve balances continue to move gradually lower as other non-reserve liabilities such as currency keep growing. We will continue to allow agency securities to run off our balance sheet and will reinvest the proceeds from those securities in Treasury bills, furthering progress toward a portfolio consisting primarily of Treasury securities. This reinvestment strategy will also help move the weighted average maturity of our portfolio closer to that of the outstanding stock of Treasury securities, thus furthering the normalization of the composition of our balance sheet.
CLAIRE JONES. Can I just ask you a quick follow-up on QT? How much of the fund impressions we've seen in money markets are related to the U.S. Treasury issuing more shortterm debt?
CHAIR POWELL. That could be one of the factors, but the reality is that we've seen --the things that we've seen, higher repo rates in the federal funds rate moving up, these are the very things that we -- that we look for. We actually have a framework for looking at the place we're trying to reach. What we said for a long time now is that when we feel like we're a little bit, or a bit above what we consider a level that's ample, that we would freeze the size of the balance sheet. Of course reserves will continue to decline from that point forward, as non-reserve liabilities grow. So this happened, some of it -- some things have been happening for some time now, showing a gradual tightening in money market conditions, really in the last, call it three weeks or so, you've seen more significant tightening, and I think a clear assessment that we're at that place. The other thing is, we're -- the balance sheet is shrinking at a very, very slow pace now. We've reduced it by half twice, and so there's not a lot of benefit to be, to be holding on for it to get the last few dollars, because again, when the balance sheet -- reserves are going to continue to shrink as non-reserves grow. So there was support on the Committee, as we thought about it, to go ahead with this and announce effective December 1 that we will be freezing the size of the balance sheet. And the December 1 date gives the markets a little bit of time to adapt.
STEVE LIESMAN. Just a follow-up on the balance sheet, if you stop it, the runoff now, does that mean you have to go back to actually adding assets sometime next year so that the balance sheet doesn't shrink as a percent of GDP and become a tightening factor?
CHAIR POWELL. So, you're right, the place we'll be on December 1 is that the size of the balance sheet is frozen, and as mortgage-backed securities mature, we'll reinvest those in treasury bills, which will foster both a more treasury balance sheet, and also a shorter duration.
So that's -- in the meantime, if you freeze the size of the balance sheet, the non-reserve liabilities, currency for example, they're going to continue to grow organically and because the size of the balance sheet is frozen, you have further shrinkage in reserves. And reserves is the thing that we're -- that we're managing that has to be ample. So, that'll happen for a time, but not a tremendously long time. We don't know exactly how long, but at a certain point, you'll want to start -- you'll want to start reserves to start gradually growing to keep up with the size of the banking system and the size of the economy. So we'll be adding reserves at a certain point, and that's the last point. Even then we'll be -- we didn't make decisions about this today, but we did talk today about the composition of the balance sheet. And there's a desire that the balance sheet be -- right now it's got a lot more duration than the outstanding universe of treasury securities and we want to move to a place where we're closer to that duration. That'll take some time. We haven't made a decision about the ultimate endpoint, but we all agree that we want to move more in the direction of a balance sheet that more closely reflects the outstanding treasuries. And that means a shorter duration balance sheet. Now, this is something that's going to be -- take a long time and move very, very gradually and I don't think you'll notice it in market conditions. But that's the direction of things.

DXY Near 100 as Rate-Cut Odds Fade and Uptrend Remains IntactHey Traders,
In today’s trading session we are monitoring the US Dollar Index (DXY) for a buying opportunity around the 100.000 zone. The Index is trading in a broader uptrend and currently is in a correction phase, approaching the trend support/resistance area near 100.000.
Structure:
The prevailing trend remains bullish, though price is consolidating and retesting the support/resistance level at 100.000. A solid rebound here could signal a resumption of the upward trajectory.
Fundamentals:
Recent commentary from the Federal Reserve indicates that a rate cut in December is increasingly unlikely. This hawkish tilt supports the Dollar and reinforces the up-trend scenario.
Next move:
Watching how price behaves around 100.000 — if the level holds, the bias remains bullish; a break below would call structural risk into question.
Trade safe,
Joe.

URUSD Faces Pressure Near 1.15100 as DXY Holds Strong Above 100!Hey Traders,
In today’s trading session we are monitoring EURUSD for a selling opportunity around the 1.15100 zone. The pair is trading within a broader downtrend and is currently in a correction phase, approaching the trend resistance at 1.15100.
Structure:
EURUSD continues to form lower highs and lower lows, suggesting that sellers remain in control. The 1.15100 zone stands as a key resistance where bearish momentum could resume.
Fundamentals:
This setup aligns with the recent DXY analysis, where the Dollar Index is holding firm around 100.000 after hawkish Fed remarks downplayed the likelihood of a December rate cut. A resilient Dollar backdrop strengthens the bearish case for EURUSD as policy divergence continues to favor the greenback.
Next move:
We’ll be watching price action at 1.15100 for potential rejection and continuation lower.
Trade safe,
Joe.

AUDUSD Breakout and Potential Retrace!Hey Traders, in today's trading session we are monitoring AUDUSD for a selling opportunity around 0.65800 zone, AUDUSD was trading in an uptrend and currently is in a correction phase in which it is approaching the retrace area at 0.65800 support and resistance area.
Trade safe, Joe.

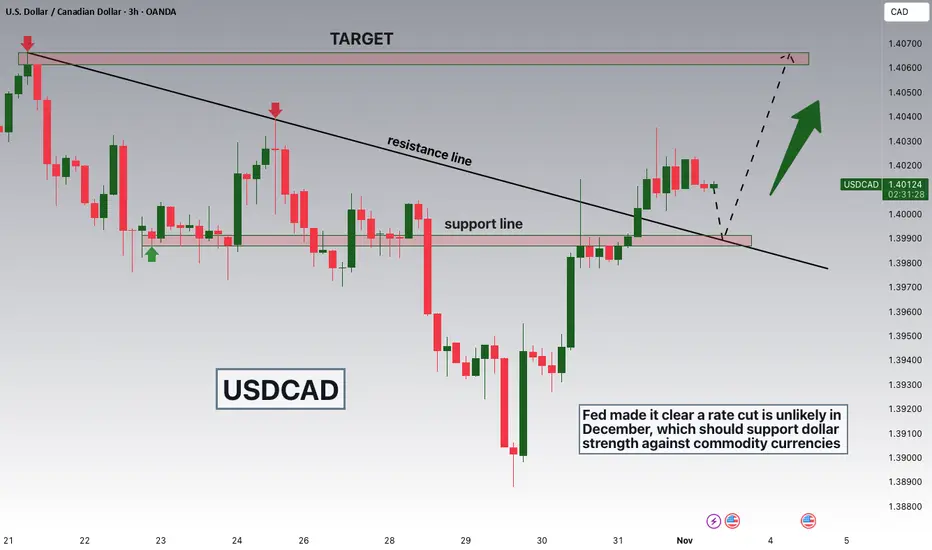
USDCAD Breakout and Potential RetraceHey Traders, in today's trading session we are monitoring USDCAD for a buying opportunity around 1.39900 zone, USDCAD was trading in a downtrend and successfully managed to break it out. Currently is in a correction phase in which it is approaching the retrace area at 1.39900 support and resistance area.
Fundamentally fed made it clear that a rate cut is unlikely in December which should strengthen the dollar against commodity currency!
Trade safe, Joe.
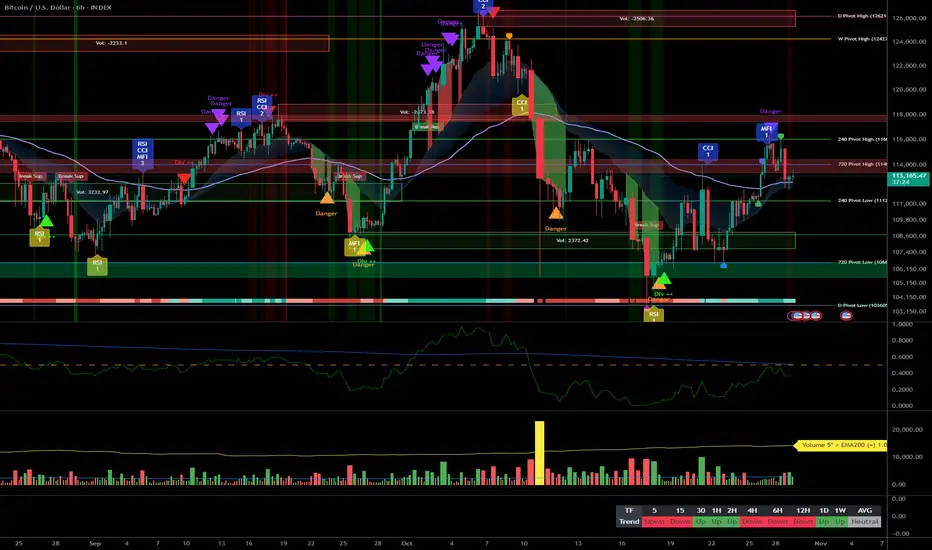
03/11/25 Weekly OutlookLast weeks high: $116,415.75
Last weeks low: $106,320.38
Midpoint: $111,368.06
This week will be the third week in a row where ~$116,000 is acting as weekly high and a major resistance level. Last weeks price action was clear, the bulls are incapable of flipping that level and making it new support. As a result the bulls retreated back towards strong support at weekly low ~106,000 completing the SFP. Also this pattern is a mirror image of the previous weekly outlooks price action. No clear trend bias at all here but what is obvious is bull market momentum is dying out.
Bitcoin has always been hyper sensitive to liquidity, as always month end window dressing by the banks have a negative effect on liquidity, it usually takes a few days to get over this and resume normal levels again. The Government shutdown in the US does not help this as spending from the Treasury General Account has stopped with approximately $150Bn coming out of the market in October alone as a result.
Should Bitcoin push higher it can only do so once Government operations resume IMO. FOMC resulted in a 25bps cut and QT (Quantitative tightening) is ending on 1st December, all bullish signs for the future but currently and for this week I think chop/ gradual drawdown continues.
Good luck this week everybody!

NZDUSD Faces Pressure as Hawkish Fed Supports Dollar Strength!!!Hey Traders, in tomorrow’s trading session we are monitoring NZDUSD for a selling opportunity around the 0.57450 zone. The pair is trading within a broader downtrend and is currently in a correction phase, approaching the trendline and resistance area at 0.57450.
From a fundamental perspective, the Federal Reserve’s recent hawkish remarks—hinting that rate cuts in December are unlikely—have provided renewed support for the U.S. Dollar, adding downside pressure to risk-linked currencies like the NZD.
If the pair rejects the 0.57450 zone with strong bearish momentum, further continuation toward recent lows could be expected.
Trade safe,
Joe

Hawkish Fed Tone Caps EURUSD Near 1.1580!!Hey Traders, in today’s trading session we’re monitoring EURUSD for a potential selling opportunity around the 1.15800 zone.
The pair remains in a downtrend, and the current correction phase is bringing price back toward the 1.15800 resistance area, aligning with the broader bearish structure.
On the fundamental side, the recent U.S.–China deal combined with Powell’s hawkish tone has reduced the odds of a December rate cut — a setup that continues to favor USD strength and weigh on EURUSD.
Watching for rejection signs near 1.15800 for possible continuation to the downside.
Trade safe,
Joe.

THE KOG REPORT - FOMCTHE KOG REPORT – FOMC
This is our view for FOMC, please do your own research and analysis to make an informed decision on the markets. It is not recommended you try to trade the event if you have less than 6 months trading experience and have a trusted risk strategy in place. The markets are extremely volatile, and these events can cause aggressive swings in price.
We’ve done pretty well this week so we’ll only share the levels and potential path but say that it’s really not worth getting involved in the FOMC move itself. We’d rather wait for them to move the price and then look for a set up to get a trade due to the extreme volatility on gold this month.
Below, we have the support level 3965-75 which needs to hold us up in order for this daily candle to close bullish and attempt to target the higher liquidity regions of 4050 and above that 4095. A break above which is very possible will take us into our area or interest which is around the 4150 region. It’s that region we will want to watch, if approached and we get a reaction, an opportunity to short from there may be available to traders.
Because we’re already in long from the swing, there is no point attempting to short it from here, instead, if we do go downside into the lower levels, we will be looking at the 3840-60 regions for a reaction in price to then attempt the scalp long.
RED BOXES:
Break below 3985 for 3955 and 3938 in extension of the move
Break above 4003 for 4020, 4030 and 4061 in extension of the move
Please do support us by hitting the like button, leaving a comment, and giving us a follow. We’ve been doing this for a long time now providing traders with in-depth free analysis on Gold, so your likes and comments are very much appreciated.
As always, trade safe.
KOG

Bitcoin-Gold Ratio Versus Monetary Policy
Chart shows:
—Bitcoin/Gold
—20-Week SMA
—SMA Slope Z-Scores*
—Fed Funds
—QE & QT
Bitcoin/Gold broke support of its 20W SMA for the 6th time in Bitcoin's history while the SMA slope normalizer* value reached zero (the long SMA rolled over), the Fed enters a rate-cutting cycle, and QT is ending.
These could represent increased bearish probabilities for the Btc/Gold ratio on medium and long timeframes.
*Slope Normalizer: The differentiated (positive and negative values are separated before subsequent calculations are made with the data) normalized z-scores (z-scores below 1 are muted while z-scores above 1 are not muted, in order to emphasize unusual values.)
When used with the SMA as an input, this essentially shows the normalized values of the rates of change of the SMA (on this chart, it is showing the normalized slope of the long-term simple moving average.)

No QE, No Alt SeasonIf we mirror the current setup to the 2019 QE playbook, altcoins could face significant selling pressure in the near term.
From last night’s Fed statement, the central bank confirmed it will halt balance sheet reduction (QT) on December 1st. While the market initially interpreted this as a risk-on signal for high-beta assets like altcoins, the implication may be less straightforward.
Ending QT is not the same as starting QE . It simply means the pace of liquidity withdrawal will stop, but it doesn’t imply new liquidity is being injected. Without active balance sheet expansion, the overall liquidity environment remains tight compared to a true QE phase.
Historically, when the Fed ended QT in 2019, the altcoin market dropped by roughly 42%, even as the S&P 500 rallied strongly. The real “altcoin season” only began after the Fed launched full-scale QE in March 2020, when balance sheet expansion accelerated and risk assets across the board surged.
Given that backdrop, halting QT alone is unlikely to trigger a broad altcoin rally. For altcoins to meaningfully outperform, one of the following would need to occur:
1. The Fed initiates a new QE cycle, which appears highly unlikely in the near term.
2. The U.S. Treasury releases liquidity via TGA (Treasury General Account) distributions, which is also improbable as long as the government shutdown persists.
My base case : From now until year-end, we expect continued pressure on the crypto market, with liquidity likely rotating toward equities instead.

FOMC OutlookAs US–China trade war concerns ease, the market’s attention is turning to today’s FOMC meeting. The Fed is expected to cut rates by 25 basis points, a move that is already fully priced in. The decision comes amid “rising risks in the labor market,” as emphasized by nearly all Fed members.
In addition to today’s expected 25 bps cut, markets are also pricing in another reduction at the December meeting. With inflation increasing more slowly than expected and Trump easing tariffs, the Fed now has greater flexibility to lower rates, aligning with our outlook.
Two main topics will be in focus at this meeting. The first is quantitative tightening (QT). The Fed slowed QT earlier this year, and based on Powell’s recent comments, it could slow further or even be halted entirely. The 10-year Treasury yield has already fallen below 4% in anticipation of such a move. The Fed is likely to announce the end of QT or signal that it will conclude soon. If the announcement did not come, it will be seen as hawkish.
The second topic is further rate cuts in 2026. Markets are pricing in two to three additional cuts that year. Powell’s tone regarding the 2026 outlook could be one of the key drivers of today’s market reaction.
The dollar index remains calm ahead of the meeting. After testing the long-term trendline from 2011 (white line), the dollar recovered above its 100-day moving average and has since turned flat. The 99.60–100.80 zone, previously a major support, now acts as resistance. The dollar is currently trapped between that resistance and the long-term trendline. Depending on the outcome of today’s FOMC meeting, the index could start to move either toward the resistance area or back to the trendline.

Gold – FOMC Rate Cut: The Catalyst for the Next Major Rally?Gold is positioned for a potential major rally as all macroeconomic indicators align in its favor. The Federal Open Market Committee (FOMC) is set to announce a expected a 25 bps rate cut, already 99% priced in by the market. This dovish pivot — driven by slowing growth and cooling inflation — will reduce real yields, pressure the USD, and reignite bullish momentum in gold.
Despite recent risk-on sentiment and a ~10% correction from its highs, the primary driver for gold now shifts to monetary policy. The forward guidance from Fed Chair Jerome Powell will determine whether this becomes the start of a new leg up? or not!.
📈 The macro backdrop is overwhelmingly bullish for gold. A confirmed dovish shift by the Fed will likely push XAU/USD back above $4,150+/oz, marking the next impulsive wave.
1️⃣ FOMC Policy Outlook
The Fed’s decision today carries immense weight for global markets.
Expected Action: 25 bps rate cut
New Target Range: 3.75% – 4.00%
Market-Implied Probability: ~99%
🔹 Impact on Gold (XAU/USD)
Lower rates reduce the opportunity cost of holding gold. When real yields decline, investors rotate capital toward non-yielding assets that preserve value — like gold.
Dovish Cut (25 bps + Future Easing Signals): This is bearish for the USD (DXY), leading to a strongly bullish reaction in gold 🚀.
Hawkish Cut (Cautious Tone): This is neutral-to-bullish for the USD (DXY), causing a bearish reaction in gold 😕.
Aggressive Cut (50 bps): This is strongly bearish for the USD (DXY), and it leads to an extremely bullish reaction in gold 💥.
Fed’s need to support growth amid cooling inflation, the “dovish cut” scenario remains the base case — which strongly favors gold upside.
2️⃣ Macroeconomic Drivers
💵 US Dollar (DXY)
The USD Index (DXY) remains structurally weak, trading near 98.8–98.9 after a year-to-date decline of nearly 13% — its steepest fall in five decades.
A weaker dollar makes gold more affordable to foreign investors, increasing global demand.
➡️ With the Fed set to ease further, any short-term rebound in DXY will likely be temporary, reinforcing the long-term bullish outlook for gold.
📊 Inflation Dynamics
CPI (YoY): 3.0% — lower than expected
Core CPI (YoY): 3.0% — also cooling
PPI Outlook (Next Month Pending)
This disinflationary trend gives the Fed room to cut rates without fear of runaway inflation, pushing real yields lower — a key bullish driver for gold.
Even with inflation above the 2% target, the cooling trend validates the Fed’s pivot toward accommodation, which historically aligns with gold rallies.
🌏 Market Sentiment
Recent US–China trade optimism fueled a “risk-on” phase, lifting equities and temporarily pressuring gold.
However, this narrative is largely priced in, creating a value re-entry point for gold bulls.
Meanwhile, long-term structural demand = central bank accumulation, sovereign diversification, and geopolitical hedging = continues to support the metal.
3️⃣ Forecast & Outlook
The tug-of-war between short-term sentiment and monetary fundamentals is ending.
The Fed’s pivot toward easing will be the dominant catalyst going forward.
Bullish Catalysts:
✅ 99% probability of a rate cut
✅ Dovish tone expected from Powell
✅ USD weakness trend intact
✅ Cooling inflation data supports easing
Bearish Factors (Minor):
Short-term risk-on sentiment
Temporary DXY bounce
📈 Final View:
The risk-reward heavily favors the bullish side.
Gold’s pullback is an opportunity — not a reversal.
With monetary easing confirmed, XAU/USD could break above $4100/$4200 oz and extend toward new record highs in the coming weeks.

BTC pinned below 116k: FOMC to break the range__________________________________________________________________________________
Market Overview
__________________________________________________________________________________
BTC is coiling into the FOMC: capped at 115–116k and defended at 112.7k, with volatility set to expand on the trigger.
Momentum: Range with a tactical bearish tilt 📉 — compression below 115–116k, dip buyers active at 112.7k.
Key levels:
Resistances (HTF) : 114.9–115.1k (1D/4H), 116.0k (1D/12H), 117.9k (1D extension).
Supports (HTF) : 112.7k (1D/12H), 111.7k (HTF), 109.05–109.07k (2H/6H/1D cluster).
Volumes: Moderate on 1D; “normal” intraday; “very high” on 30m during impulses.
Multi-timeframe signals: 12H Down while 1D is Up — transitional range; a confirmed break above 115–116k would align TFs, otherwise risk of a 112.7k → 109k sweep.
Risk On / Risk Off Indicator: NEUTRAL SELL — validates caution and counters any sustained push until 115–116k is reclaimed; favors edge trading.
__________________________________________________________________________________
Trading Playbook
__________________________________________________________________________________
Strategy: event‑driven range with a risk‑off tilt — trade the edges with confirmation.
Global bias: NEUTRAL SELL below 115.1–116k; bias invalidated on daily close > 116k .
Opportunities:
- Breakout buy: Reclaim/close above 115.1–116k with volume, target 121–122k.
- Buy the dip: Confirmed (≥2H) bullish rejection at 109.05–109.07k, back to 112.7k then 114.9–115.1k.
- Tactical sell: Clear 114.9–116k rejection (2H/4H bearish close), aim 113.0k then 112.7k, runner 111.7k.
Risk zones / invalidations: A close < 111.7k opens the 109k cluster; a ≥2H close < 109k invalidates dip‑buys.
Macro catalysts (Twitter, Perplexity, news): FOMC cut (25 bps) with possible QT changes; options crowding = whipsaw risk; spot ETF inflows = mild cushion.
Action plan:
Entry: confirmed post‑breakout retest 116,050–116,200.
Stop: below 114,900.
TP1: 117,900; TP2: 121,000–122,000; TP3: let it run if extends.
R/R: approximately 1:2 to 1:3 depending on fill.
__________________________________________________________________________________
Multi-Timeframe Insights
__________________________________________________________________________________
Overall, 1D remains constructive but intraday groups lean NEUTRAL SELL, keeping price in an event‑driven range.
12H/6H/4H/2H/1H/30m: NEUTRAL SELL with lower highs below 115–116k; supports at 112.7k then 111.7k; highest‑quality demand at 109.05–109.07k, deeper near ~107k.
1D: Still constructive while 109k holds; a 1D close above 116k would align TFs and open 121–122k (potential squeeze).
Major divergence: 12H Down vs 1D Up — a transitional signal; 115–116k is the decision band for trend alignment or a rotation toward 109k.
__________________________________________________________________________________
Macro & On-Chain Drivers
__________________________________________________________________________________
FOMC‑led macro should decide the range resolution and drive the next volatility expansion.
Macro events: 25 bps cut expected with QT end/slowdown discussed — direct risk‑on/off catalyst; options are crowded long → whipsaw risk; equities at highs keep the tone constructive but fragile around the event.
Bitcoin analysis: US spot ETF inflows add a small downside cushion; corporate bids and stablecoin mints help demand; technically, >116k unlocks 121–122k, losing 111k ups odds of a 109k flush.
On-chain data: Modest whale prints; stablecoin mints increasing; no clear systemic distribution — tactical support rather than a trigger.
Expected impact: Technical bias stays NEUTRAL SELL until 115–116k is reclaimed; the post‑FOMC reaction should confirm either a squeeze to 121–122k or a liquidity hunt toward 109k.
__________________________________________________________________________________
Key Takeaways
__________________________________________________________________________________
BTC is in a catalyst‑driven range under a major resistance shelf.
- Overall trend: neutral with a bearish tilt while 115–116k caps.
- Most relevant setup: confirmed breakout above 116k toward 121–122k; alternative is a confirmed dip‑buy at 109.05–109.07k.
- One macro factor: FOMC decision and QT guidance can flip risk tone quickly.
Stay nimble: trade confirmation, not guesses — let the reaction lead.