Lemonade Inc.: Breakout in Motion — Cup, Flag, and No BrakesLemonade Inc. (LMND) is accelerating after a clean breakout from a textbook cup with handle pattern, where the handle formed as a tight bullish flag. The breakout occurred around $32, and since then, price action has been sharp, controlled, and uncorrected — currently trading at $42.42 with buyers clearly in charge.
On the fundamental side, LMND is moving through a recovery phase: operational losses are narrowing, revenue is stabilizing, and the company is aggressively leveraging AI to automate its insurance processes. Expansion into Europe continues, and institutional interest is visibly rising — confirmed by volume building alongside price. Within the insuretech sector, LMND is starting to look like a comeback story rather than a cautionary tale.
Technically, the setup remains strong:
– Golden Cross confirmed (EMA50 crossing EMA200)
– EMA50/100/200 all below price — bullish structure firmly intact
– Volume expanding on up-days — healthy confirmation
– RSI hovering in the 60–65 range — momentum is intact, no signs of exhaustion
Targets remain aligned with the structure:
– tp1 = $64 — measured move from the flag
– tp2 = $94 — full realization of the cup pattern
Tactically, this is no longer a “wait and see” setup — the move is in progress. No correction so far, only continuation. Momentum traders may consider entries into strength. Above $45, the move could accelerate further as more participants recognize the structure.
LMND is showing technical and fundamental alignment — confirmed breakout, improving narrative, and strong trend structure. While the impulse holds, this chart favors continuation, not hesitation.
Fundamental Analysis

ZKC long setup adding in spotZKC zero knowledge trend adding a spot bag bottom is close it's worth taking some risk here.
Reversal is just a matter of time.

More sideways/down for $BTC as dictated by Global LiquidityRecent price action in relation to the BGL (Bitcoin Global Liquidity indicator) has got me thinking that the delay has shifted to around 90 days instead of the 72 day default lag. While this may or may not be the case, the BGL (72 and 90 day delay) has correctly called the current downside/sideways price action for CRYPTOCAP:BTC (Note: the BGL has been correctly predicting price action for the entire cycle). If this continues to be correlated, then we will continue to get sideways/down until at least February 2026 (the farthest in the future the BGL can currently "see"). While I root for CRYPTOCAP:BTC to "go up," the BGL says there is currently no end in site to sideways/down.
--Da_Prof


NIFTY Today Major resistancetoday Nifty levels
26585.85
25632.15
big move 27539.55 to 26678.45
based on pre market data

USD/JPY Price Outlook – Trade Setup (6 Nov 2025)📊 Technical Structure
FX:USDJPY USD/JPY trades around 153.85, consolidating beneath the Resistance Zone (154.07–154.24) after failing to sustain its rebound from the 153.00 level. The recent rejection near 154.20 indicates selling pressure returning at prior supply levels.
The Support Zone lies between 152.88–153.04, which served as a strong demand base earlier this week. A confirmed breakdown below 153.50 could accelerate a retracement toward this area. Conversely, a sustained break above 154.30 would negate the bearish structure and resume the uptrend.
🎯 Trade Setup
Idea: Short from resistance, targeting retest of key support zone.
Entry: 154.07– 154.24
Stop Loss: 154.28
Take Profit 1: 153.04
Take Profit 2: 152.88
Risk–Reward Ratio: ≈ 1 : 5.72
A decisive hourly close above 154.28 invalidates the bearish setup.
🌐 Macro Background
The Japanese Yen (JPY) strengthens modestly during Thursday’s Asian session, buoyed by revived BoJ rate hike bets, though upside momentum remains limited due to policy uncertainty.
According to FXStreet’s Haresh Menghani, “The Japanese Yen attracts some buying as hopes for an imminent BoJ rate hike persist, though policy caution caps gains.” 【FXStreet】
BoJ Outlook: Minutes from the September BoJ meeting highlighted policymakers’ openness to raising interest rates, citing that the 2% inflation goal has been largely achieved. However, the central bank remains cautious amid external risks and weak global demand.
Fiscal Context: Japan’s new Prime Minister Sanae Takaichi continues to favour aggressive fiscal spending, dampening expectations of rapid monetary tightening.
USD Factors: The US Dollar remains firm after the ADP employment report showed 42,000 new private-sector jobs in October and ISM Non-Manufacturing PMI rose to an eight-month high, reinforcing the Fed’s hawkish bias.
Shutdown Impact: The US government shutdown, now in its 36th day, clouds near-term data reliability and limits aggressive USD buying despite strong fundamentals.
Overall, the Yen’s short-term strength is tempered by BoJ caution and global risk recovery, while the Fed’s hawkish stance continues to anchor USD/JPY above 153. Yet, with technical rejection from resistance and potential consolidation, a short-term corrective dip looks likely.
🔑 Key Technical Levels
Resistance: 154.07 – 154.24
Support: 152.88 – 153.04
Psychological Level: 154.00
📌 Trade Summary
USD/JPY is encountering resistance around 154.20 while forming lower intraday highs. The combination of BoJ rate speculation and Fed hawkish stability suggests a range-bound but corrective bias. The preferred setup is a short from 154.07–154.24, targeting a retracement to 153.00, provided price remains capped below 154.30.
⚠️ Disclaimer
This analysis is for reference only and does not constitute trading advice. Trading involves significant risk, and proper risk management is essential.

Gold price analysis June 11✏️ XAUUSD Analysis — 06/11
Today's gold trading range is being established within 100 prices, limited by the resistance zone of 4031 and the support zone of 3931.
The main trend is still up, so the strategy of prioritizing BUY following the market momentum will be more suitable in this period.
The Keylevel zone of 4031 continues to play an important role — if the buying force is strong enough to break this zone, the next target will be 4150.
On the other hand, it is necessary to observe the price reaction around the trendline and the support zone of yesterday's Asian session to determine whether the buying force is still maintained or not.
📈 Trading Plan
BUY around 3984
BUY when there is a price rejection signal at support 3931
BUY DCA when price breaks 4031
🎯 Target: 4150
⚠️ Risk: when price breaks the trendline and closes the candle below 3930

Xau/Usd - Bullish Breakout Setup Gold is currently consolidating above the $3,955–3,965 support zone, forming a solid base for potential bullish continuation. The market has shown strong rejection from the lower range, suggesting buyers are stepping back in to defend key levels. Momentum remains constructive, and price action indicates the possibility of a breakout from the $3,995–4,010 resistance zone.
A confirmed breakout above this level could open the path toward $4,100, with extended targets around $4,150–4,200. As long as gold holds above its support base, the bias stays bullish.
Trading Plan:
• Entry: Above $3,995
• Targets: $4,100 / $4,150 / $4,200
• Stop Loss: Below $3,950
• Bias: Bullish continuation on breakout confirmation

Sell GBP/USD 1.3110 — Fibo Confluence Setup, Downtrend ContinuatSell GBP/USD 1.3110 — Fibo Confluence Setup, Downtrend Continuation.
Condition 1: The setup aligns with the downtrend; price still has room to continue, confirming trend continuation.
Condition 2: Draw a Fibonacci retracement in the direction of the trend. The strongest confluence zone (0.5–0.618) coincides with the key level around 1.3110.
Condition 3: An order block (OB) and imbalance are present around the 1.3110 area.
Based on this, there is a sell setup around 1.3110.
Stop loss: above the strong Fibonacci zone (0.5–0.618).
Price is expected to continue moving downward.
Analysis by: Hung Minsk Fibo Trung

I Think GE Aerospace is BrilliantThis is one of my favorite companies on the market. I really have a deep fascination for aviation and all things, planes. Naturally it makes sense for me to have exposure to the sector. I do not have many companies in my portfolio but I'm going to share my reasons for why I have been buying GE stock over the last few months.
The value of the shares are, in my opinion overvalued right now at this price. I am going to explain why I still think this is a good investment despite the numbers coming back negative. The intrinsic value of the stock as per my model is $250. Indicating a significant overvaluation, I think my reasons for not selling and possibly buying more are sufficient fundamentally to still hold the stock in my portfolio.
The primary reasons I like this company above all the others is because of how they are using capital in their business;
GE Aerospace invests heavily in developing future technology, including advancements in Open Fan engines, hybrid electric propulsion, and hyper sonics. The company is investing in its supply chain, facilities, and suppliers to meet rising demand and improve production and service capacity. Capital is used to help customers update and expand their fleets, supporting the demand for GE Aerospace's products and services.
The company plans to return approximately 70–75% of available funds to shareholders through dividends and share buybacks, a significant increase from previous levels. This capital return strategy is intended to generate incremental value for shareholders, in addition to the company's expected growth.
A significant portion of capital is dedicated to increasing its global capacity for servicing engines to meet growing demand and support its engine platforms for decades. After the spin-off of GE Vernova, GE Aerospace retained a strong cash position that was used to fund the new company. As part of its launch as a standalone public company, GE Aerospace awarded one-time equity awards to employees to make them owners of the business.
That is all the reasons why I think this company is a good investment, fundamentally.

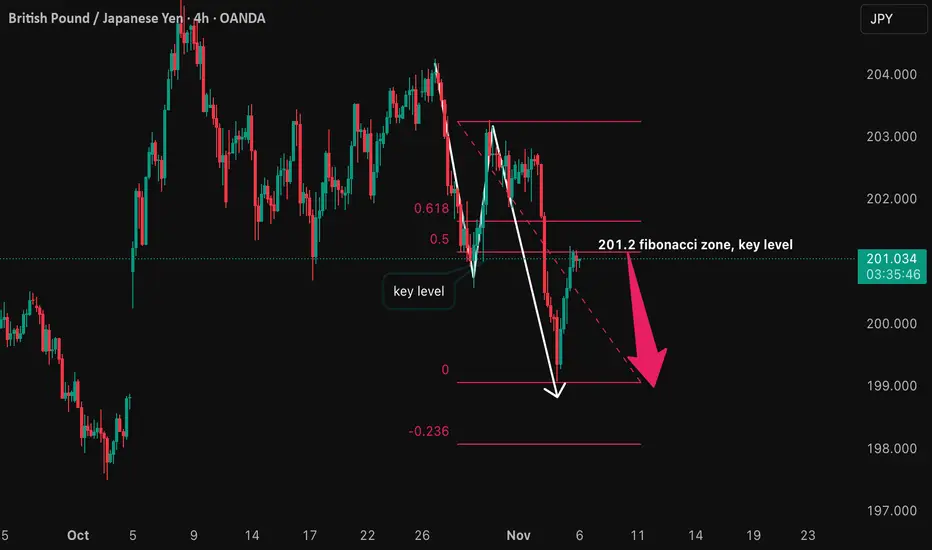
Sell GBP/JPY at 201.1 — Fibo Overlap Setup, in line with the dowSell GBP/JPY at 201.1 — Fibo Overlap Setup, in line with the downtrend.
Condition 1: Trend alignment — price still has room to continue, and the downtrend remains intact.
Condition 2: Draw a Fibonacci retracement following the trend — the strongest zone (0.5–0.618) overlaps with a key level around 201.05–201.2.
Condition 3: An order block appears around the 201 area.
→ Conclusion: There is a sell setup at the 201.1 zone.
Stop loss: above the strong Fibonacci 0.5–0.618 zone.
Outlook: price is expected to continue falling.
Analysis by: Hung Minsk Fibo Trung
Gold Price Outlook – Trade Setup (XAU/USD)📊 Technical Structure
OANDA:XAUUSD Gold (XAU/USD) continues to face resistance below the $3,995–$3,993 Resistance Zone, with repeated rejections suggesting weakening bullish momentum. Price action has formed lower highs near $3,990, signalling potential exhaustion.
The Support Zone sits around $3,929–$3,938, which previously acted as a springboard for short-term rebounds. The current structure favours a bearish correction, particularly if price fails to reclaim $3,995 on a sustained basis. A clean break below $3,950 would confirm bearish continuation toward the $3,930 area.
🎯 Trade Setup
Idea: Sell near resistance, target a drop toward support.
Entry: $3,985 – $3,993 (Resistance Zone retest)
Stop Loss: $3,996
Take Profit 1: $3,950
Take Profit 2: $3,930
Risk–Reward Ratio: ≈ 1 : 5.2
A break above $3,996 would invalidate the short setup and could open the door to retest $4,030.
🌐 Macro Background
Gold prices slipped to around $3,970 in Thursday’s Asian session, weighed down by stronger-than-expected US private payroll data and a resilient US Dollar.
As FXStreet’s Lallalit Srijandorn noted, “Gold edges lower below $4,000 as private payrolls rebound in October.” 【FXStreet】
ADP Employment Data: US companies added 42,000 jobs in October, rebounding from the previous month’s contraction, suggesting stabilization in the labor market. This data supports the Fed’s cautious tone and trims expectations for near-term rate cuts.
Fed Commentary: Several Fed officials, including Michael Barr, John Williams, and Christopher Waller, are scheduled to speak later today. Any hawkish remarks reinforcing the “higher for longer” narrative could further strengthen the USD and pressure gold.
Government Shutdown: The US government shutdown, now at 37 days, marks the longest in history. Political gridlock could lend some safe-haven support to gold, but so far, the impact has been muted compared to stronger USD dynamics.
In short, with the US labour market improving and Fed officials maintaining caution, gold’s upside remains limited, while macro bias supports near-term weakness.
🔑 Key Technical Levels
Resistance: $3,985 – $3,996
Support: $3,929 – $3,938
Psychological Level: $4,000
📌 Trade Summary
Gold (XAU/USD) remains under pressure below $4,000 as bullish momentum fades. The setup favours a short position from the $3,985–$3,993 zone, targeting a decline toward $3,930. A sustained break above $3,996 would invalidate this bias and shift focus to $4,030 resistance.
⚠️ Disclaimer
This analysis is for reference only and does not constitute trading advice. Trading involves significant risk, and proper risk management is essential.

SMART MONEY CONCEPT (SMC)Bullish Analysis Breakdown – XAU/USD (15M)
🧠 Market Structure
The chart shows a shift in structure with a clear BOS (Break of Structure) and CHOCH (Change of Character) after a period of Consolidation.
Price creates a Fair Value Gap (FVG) during the bullish move, and later performs a Fake Out below the support zone to grab Sell-Side Liquidity before rejecting strongly back into structure — a classic institutional move.
The rejection at the support zone confirms that institutions have accumulated positions and are now ready to drive the market toward new highs.
🧩 Confluences
• Support Zone + Rejection: Price reacts perfectly after the fake-out, confirming demand.
• FVG Mitigation: The fair value gap adds confluence to the bullish rejection.
• Liquidity Grab: Sell-side liquidity was cleared before the bullish push.
• Distribution Phase: The projection shows a possible redistribution before reaching TP.
🎯 Trade Plan
• Buy Entry: 3,965
• Stop Loss: 3,945
• Take Profit: 4,026
• Risk/Reward Ratio: 1:3
This setup shows clean institutional alignment — liquidity taken, structure shift, rejection, and continuation toward buy-side targets.
💬 Conclusion
A very professional analysis that combines structure, liquidity, and confluences in harmony.
“Smart trading begins with patience and precision.”
FOOD LUCK TRADERS 🦾🤓🖤💸

EBAY QuantSignals V3 Swing 2025-11-05EBAY QuantSignals V3 Swing 2025-11-05
EBAY Swing Signal | 2025-11-05
• Direction: BUY PUTS | Confidence: 60%
• Horizon: 16 days to 2025-11-21
• Strike Focus: $80.00
• Entry Range: $1.81
• Target 1: $2.70
• Stop Loss: $1.30
• 1W Move: -0.71%
• 2W Move: -10.78%
• Volume vs Prior Swing: 1.6×
• Swing Range: $79.11 - $91.91
• ⚠️ MODERATE RISK WARNING: Consider reducing position size due to moderate confidence level.
⚖️ Compliance: Educational swing commentary for QS Premium. Not financial advice.
🎯 TRADE RECOMMENDATION
Direction: BUY PUTS
Confidence: 60%
Conviction Level: MEDIUM
🧠 ANALYSIS SUMMARY
Katy AI Signal: NEUTRAL with 50% confidence, but provides specific bearish targets ($86.32 target vs $79.46 stop loss) - directional bias suggests potential downside with weak technical positioning
Technical Analysis: Strong bearish momentum with -11.75% daily decline, price at 12.2% of swing range near support at $79.11, all EMAs aligned bearish, MACD bearish, weak trend strength
News Sentiment: Mixed with recent downgrades (UBS lowers target to $95) but some positive analyst coverage (Truist raises to $92, Benchmark maintains $110), overall moderate bearish impact from recent large-cap loser status
Options Flow: Put/Call ratio of 0.68 indicates bullish flow bias, but unusual activity at $84 calls suggests potential resistance level - institutional positioning shows defensive hedging
Risk Level: ELEVATED - extreme daily move may lead to oversold bounce, neutral Katy signal limits conviction
💰 TRADE SETUP
Expiry Date: 2025-11-21 (16 days)
Recommended Strike: $80.00
Entry Price: $1.74 - $1.87
Target 1: $2.70 (50% gain from entry)
Target 2: $3.50 (90% gain from entry)
Stop Loss: $1.30 (25% loss from entry)
Position Size: 2% of portfolio
⚡ COMPETITIVE EDGE
Why This Trade: Combines extreme oversold conditions with clear technical breakdown below key levels, offering favor
Image
QS Analyst
APP
— 11:16 AM
able risk/reward despite Katy's neutral stance
Timing Advantage: Entry after -11.75% daily decline reduces immediate downside risk while capturing potential continuation of bearish momentum
Risk Mitigation: Tight stop loss protects against oversold bounce, strike selection at current price level provides balanced delta exposure
🚨 IMPORTANT NOTES
Katy AI shows NEUTRAL confidence (50%) - trade qualifies but requires caution
Extreme daily move increases volatility risk - position size should be conservative
Monitor $79.11 swing low as critical support level - break below would confirm bearish continuation
Consider scaling into position given elevated volatility environment
📊 TRADE DETAILS 📊
🎯 Instrument: EBAY
🔀 Direction: BUY 📈
🎯 Strike: 80.00
💵 Entry Price: 1.81
🎯 Profit Target: 2.70
🛑 Stop Loss: 1.30
📅 Expiry: 2025-11-21
📏 Size: 2.0
📈 Confidence: 60%
⏰ Entry Timing: N/A
🕒 Signal Time: 2025-11-05 14:16:11 EST
⚠️ MODERATE RISK WARNING: Consider reducing position size due to moderate confidence level.

DUOL QuantSignals V3 Earnings 2025-11-05DUOL QuantSignals V3 Earnings 2025-11-05
DUOL Earnings Signal | 2025-11-05
• Direction: BUY CALLS | Confidence: 65%
• Entry Plan: Pre Earnings Close | Expiry 2025-11-07
• Strike Focus: $207.50
• Entry Range: $56.50
• Target 1: $84.75
• Stop Loss: $28.25
• Implied Move: $58.15 (27.8%)
• 24h Move: -21.23%
• Flow Intel: Bullish (Low P/C Ratio) | PCR 0.60
• ⚠️ MODERATE RISK WARNING: Consider reducing position size due to moderate confidence level.
• Earnings Date: 2025-11-05 | Estimate: $0.78
⚖️ Compliance: Educational earnings analysis for QS Premium members only. Not financial advice.
🎯 TRADE RECOMMENDATION
Direction: BUY CALLS
Confidence: 65%
Conviction Level: MEDIUM
🧠 ANALYSIS SUMMARY
Katy AI Signal: NEUTRAL trend (50% confidence) with target at $237.17, supporting a rebound from oversold conditions after 21% selloff
Technical Analysis: RSI at 17.3 indicates severely oversold conditions, potential reversal setup. However, MACD at -8.45 and momentum at -15.46% show strong bearish pressure. Stock broke below key moving averages with light volume selloff.
News Sentiment: Mixed headlines - stock sold off despite beating Q3 estimates ($271.7M actual vs $260.3M est) and raising FY2025 guidance. Strong revenue growth of 266% year-over-year provides fundamental support.
Options Flow: Bullish positioning with Put/Call Ratio of 0.60 and unusual activity at $495 calls. Max pain at $215 suggests potential price gravitation toward strike.
Risk Level: HIGH - Earnings momentum trade with extreme volatility (IV 836%+). Position sizing critical given binary event nature.
💰 TRADE SETUP
Expiry Date: 2025-11-07 (2 days)
Recommended Strike: $207.50
Entry Price: $55.00 - $58.00 (midpoint $56.50)
Target 1: $84.75 (50% gain from entry)
Target 2: $113.00 (100% gain from entry)
Stop Loss: $28.25 (50% loss from entry)
Position Size: 2% of portfolio (reduced due to high IV and earnings
Image
QS Analyst
APP
— 5:46 PM
event risk)
⚡ COMPETITIVE EDGE
Why This Trade: Comboversold technical bounce setup with strong fundamental beat and guidance raise. The 21% pre-earnings selloff creates asymmetric risk/reward if earnings spark short covering.
Timing Advantage: Earnings already released with beat confirmed, yet stock remains oversold. Options expiry in 2 days captures immediate reaction.
Risk Mitigation: Strike selection at $207.50 provides balanced risk-reward with 0.639 delta. Position sizing limits exposure to 2% portfolio risk.
🚨 IMPORTANT NOTES
Extreme implied volatility (836%+) means rapid time decay - this is a short-term hold only
Light volume selloff suggests weak hands capitulating, but earnings reaction can be unpredictable
Consider scaling out at Target 1 to lock in gains given binary nature
Monitor pre-market activity for confirmation of bullish reversal
High risk trade suitable only for experienced options traders comfortable with potential 100% loss
📊 TRADE DETAILS 📊
🎯 Instrument: DUOL
🔀 Direction: CALL (LONG)
🎯 Strike: 207.50
💵 Entry Price: 56.50
🎯 Profit Target: 84.75
🛑 Stop Loss: 28.25
📅 Expiry: 2025-11-07
📏 Size: 2.0
📈 Confidence: 65%
⏰ Entry Timing: N/A
🕒 Signal Time: 2025-11-05 20:46:23 EST
⚠️ MODERATE RISK WARNING: Consider reducing position size due to moderate confidence level.

DASH QuantSignals V3 Earnings 2025-11-05DASH QuantSignals V3 Earnings 2025-11-05
DASH Earnings Signal | 2025-11-05
• Direction: BUY CALLS | Confidence: 70%
• Entry Plan: Pre Earnings Close | Expiry 2025-11-07
• Strike Focus: $240.00
• Entry Range: $11.25
• Target 1: $16.35
• Stop Loss: $7.40
• Implied Move: $24.10 (10.1%)
• 24h Move: -0.06%
• Flow Intel: Neutral | PCR 0.97
• ⚠️ MODERATE RISK WARNING: Consider reducing position size due to moderate confidence level.
• Earnings Date: 2025-11-05 | Estimate: $0.70
⚖️ Compliance: Educational earnings analysis for QS Premium members only. Not financial advice.
🎯 TRADE RECOMMENDATION
Direction: BUY CALLS
Confidence: 70%
Conviction Level: MEDIUM
🧠 ANALYSIS SUMMARY
Katy AI Signal: PRIMARY BIAS BUY CALLS (composite score +2.4) - Strong bullish signal based on exceptional revenue growth (3425.0%), strong beat history (75%), and consistent big beats (avg +31.5%)
Technical Analysis: RSI at 28.2 (oversold - potential reversal opportunity), but MACD -2.4507 and momentum -5.53% show bearish pressure. Current price $238.35 trading near day's midpoint with 1.1x average volume suggesting mild interest
News Sentiment: Benchmark maintains Buy rating with price target raised to $320 (bullish catalyst). Recent earnings preview articles indicate high market attention. General market rebound environment supportive
Options Flow: Neutral put/call ratio (0.97) with max volume at $262 put showing some hedging. Implied move of 10.1% ($24.10) suggests significant volatility priced in
Risk Level: MODERATE - High IV (169%) increases premium costs, but oversold RSI and strong fundamental case provide cushion
💰 TRADE SETUP
Expiry Date: 2025-11-07 (2 days)
Recommended Strike: $240.00
Entry Price: $10.90 - $11.60
Target 1: $16.35 (50% gain from entry)
Target 2: $22.50 (100% gain from entry)
Stop Loss: $7.40 (35% loss from entry)
Position Size: 3% of portfolio
⚡ COMPETITIVE ED
Image
QS Analyst
APP
— 11:08 AM
GE
Why This Trade: Combines Katy AI's strong bullish composite score (+2.4) with oversold technical conditions and positive analyst sentiment (Benchmark $320 target)
Timing Advantage: Earnings release creates volatility catalyst while oversold RSI suggests limited downside risk pre-earnings
Risk Mitigation: Balanced delta (0.506) provides good risk/reward, stop loss at 35% protects against IV crush post-earnings
🚨 IMPORTANT NOTES
High IV (169%) means time decay will be aggressive - exit before earnings release if targets not hit
Monitor for any last-minute earnings whispers that could change sentiment
Consider scaling out at Target 1 to lock in profits given short expiration timeframe
📊 TRADE DETAILS 📊
🎯 Instrument: DASH
🔀 Direction: CALL (LONG)
🎯 Strike: 240.00
💵 Entry Price: 11.25
🎯 Profit Target: 16.35
🛑 Stop Loss: 7.40
📅 Expiry: 2025-11-07
📏 Size: 3.0
📈 Confidence: 70%
⏰ Entry Timing: N/A
🕒 Signal Time: 2025-11-05 14:08:45 EST
⚠️ MODERATE RISK WARNING: Consider reducing position size due to moderate confidence level.

MSFT QuantSignals V3 Weekly 2025-11-05MSFT QuantSignals V3 Weekly 2025-11-05
MSFT Weekly Signal | 2025-11-05
• Direction: BUY PUTS | Confidence: 65%
• Expiry: 2025-11-07 (2 days)
• Strike Focus: $507.50
• Entry Range: $3.88
• Target 1: $6.08
• Stop Loss: $2.71
• Weekly Momentum: NEUTRAL (-0.56% 1W)
• Flow Intel: Bearish (High P/C Ratio) | PCR 2.54
• Max Pain: $517.50 (+2.2% vs spot)
• ⚠️ MODERATE RISK WARNING: Consider reducing position size due to moderate confidence level.
⚖️ Compliance: Educational commentary for QS Premium members only. No financial advice.
🎯 TRADE RECOMMENDATION
Direction: BUY PUTS
Confidence: 65%
Conviction Level: MEDIUM
🧠 ANALYSIS SUMMARY
Katy AI Signal: The AI shows a neutral stance with HOLD signal, but provides a bearish bias with target at $517.30 (above current $506.20) and stop loss at $498.61. However, the weekly directional guidance strongly indicates BUY PUTS with composite score of -2.5 and STRONG signal strength.
Technical Analysis: Current price at $506.20 shows -4.13% intraday decline with bearish EMA alignment. Stock is trading below session open ($524.50) and VWAP ($518.66), indicating selling pressure. Weekly momentum is neutral but multi-week trend shows -1.46% decline, confirming bearish bias.
News Sentiment: Bearish with tech sector sell-off led by Palantir affecting AI-focused stocks. OpenAI's CFO comments about break-even and government backstop needs may reduce investor enthusiasm for AI infrastructure plays like Microsoft.
Options Flow: Extremely bearish with Put/Call Ratio of 2.54 indicating heavy put buying. Unusual activity at $560 put strike shows institutional bearish positioning. Max pain at $517.50 suggests upward pressure potential is limited.
Risk Level: MEDIUM-HIGH due to short time frame (2 days to expiry) and potential for short-term reversal in tech stocks.
💰 TRADE SETUP
Expiry Date: 2025-11-07 (2 days)
Recommended Strike: $507.50
Entry Price: $3.80 - $3.95
**Tar
Image
QS Analyst
APP
— 5:43 PM
get 1: $6.08 (60% gain from entry)
Target 2: $8.54 (120% gain from entry)
Stop Loss: $2.71 (30% loss from entry)
Position Size: 3% of portfolio (cautious allocation due to short expiry)
⚡ COMPETITIVE EDGE
Why This Trade: Combines Katy AI's technical bearish bias with overwhelming options flow confirmation and sector weakness catalysts
Timing Advantage: Mid-week positioning with only 2 days to expiry maximizes time decay benefits for put positions
Risk Mitigation**: Conservative strike selection with -0.555 delta provides balanced risk-reward for weekly expiration
🚨 IMPORTANT NOTES
Only 2 days until expiration - time decay will accelerate rapidly
VIX rising to 18.01 may increase option premiums but also volatility
Tech sector sell-off could reverse quickly on positive news
Position size should be conservative due to binary event risk
📊 TRADE DETAILS 📊
🎯 Instrument: MSFT
🔀 Direction: PUT (SHORT)
🎯 Strike: 507.50
💵 Entry Price: 3.88
🎯 Profit Target: 6.08
🛑 Stop Loss: 2.71
📅 Expiry: 2025-11-07
📏 Size: 3.0
📈 Confidence: 65%
⏰ Entry Timing: N/A
🕒 Signal Time: 2025-11-05 20:43:48 EST
⚠️ MODERATE RISK WARNING: Consider reducing position size due to moderate confidence level.

INTC QuantSignals V3 Weekly 2025-11-05INTC QuantSignals V3 Weekly 2025-11-05
INTC Weekly Signal | 2025-11-05
• Direction: BUY CALLS | Confidence: 60%
• Expiry: 2025-11-07 (2 days)
• Strike Focus: $38.50
• Entry Range: $0.70
• Target 1: $1.15
• Stop Loss: $0.40
• Weekly Momentum: NEUTRAL (+0.63% 1W)
• Flow Intel: Neutral
• ⚠️ MODERATE RISK WARNING: Consider reducing position size due to moderate confidence level.
⚖️ Compliance: Educational commentary for QS Premium members only. No financial advice.
🎯 TRADE RECOMMENDATION
Direction: BUY CALLS
Confidence: 60%
Conviction Level: LOW
🧠 ANALYSIS SUMMARY
Katy AI Signal: Neutral (50% confidence) with $38.59 target (+0.8% from current), suggesting mild bullish bias with HOLD recommendation
Technical Analysis: Weekly momentum neutral but multi-week trend bullish (+3.99% over 2 weeks). EMA alignment confirms bullish uptrend. Current price at 49.4% weekly range suggests room for movement in either direction.
News Sentiment: Mixed - AI chip sector faces headwinds from China's foreign chip ban (bearish catalyst), but TSMC's North America expansion could benefit INTC long-term. Overall sector sentiment cautious after $500B AI stock wipeout.
Options Flow: Neutral positioning with no unusual activity detected. Low gamma risk provides cleaner price action. Put/Call ratio unavailable for directional bias confirmation.
Risk Level: HIGH - Low conviction due to Katy's neutral signal, mixed news catalysts, and only 2 days to expiry. Trade primarily based on weekly momentum continuation.
💰 TRADE SETUP
Expiry Date: 2025-11-07 (2 days)
Recommended Strike: $38.50
Entry Price: $0.68 - $0.71
Target 1: $1.15 (70% gain from entry)
Target 2: $1.45 (105% gain from entry)
Stop Loss: $0.40 (40% loss from entry)
Position Size: 2% of portfolio (reduced due to low conviction)
⚡ COMPETITIVE EDGE
Why This Trade: Captures weekly momentum continuation with balanced delta (0.
Image
QS Analyst
APP
— 4:06 PM
468) offering optimal risk/reward for short-duration play
Timing Advantage: Mid-week positioning allows capture of any Thursday/Friday institutional flows before expiry
Risk Mitigation: Tight stop loss protects against rapid time decay, strike selection provides moderate intrinsic value buffer
🚨 IMPORTANT NOTES
Extremely short duration - Only 2 days to expiry creates high time decay risk
Katy AI shows weak signal - Primary engine indicates neutral bias with only 50% confidence
Sector headwinds present - AI chip sector volatility could override technical bullish signals
Target reduced expectations - Conservative profit targets reflect low conviction environment
Exit by Thursday EOD recommended to avoid Friday gamma compression risks
📊 TRADE DETAILS 📊
🎯 Instrument: INTC
🔀 Direction: CALL (LONG)
🎯 Strike: 38.50
💵 Entry Price: 0.70
🎯 Profit Target: 1.15
🛑 Stop Loss: 0.40
📅 Expiry: 2025-11-07
📏 Size: 2.0
📈 Confidence: 60%
⏰ Entry Timing: N/A
🕒 Signal Time: 2025-11-05 19:06:41 EST
⚠️ MODERATE RISK WARNING: Consider reducing position size due to moderate confidence level.

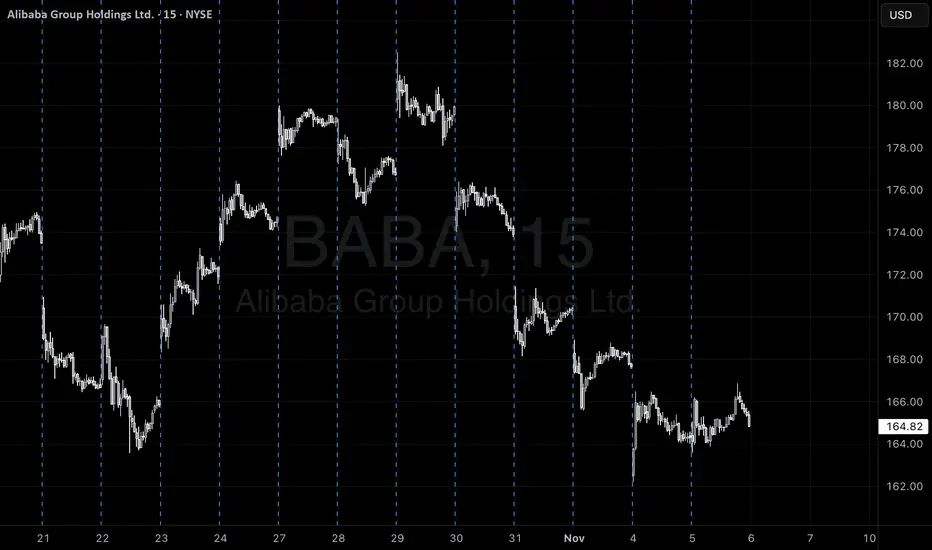
BABA QuantSignals V3 Weekly 2025-11-05BABA QuantSignals V3 Weekly 2025-11-05
BABA Weekly Signal | 2025-11-05
• Direction: BUY CALLS | Confidence: 55%
• Expiry: 2025-11-07 (2 days)
• Strike Focus: $165.00
• Entry Range: $2.42
• Target 1: $3.50
• Stop Loss: $1.80
• Weekly Momentum: NEUTRAL (+0.60% 1W)
• Flow Intel: Neutral | PCR 1.18
• Max Pain: $170.00 (+2.5% vs spot)
• 🔴 HIGH RISK WARNING: Use only small position size due to lower confidence and high uncertainty.
⚖️ Compliance: Educational commentary for QS Premium members only. No financial advice.
🎯 TRADE RECOMMENDATION
Direction: BUY CALLS
Confidence: 55%
Conviction Level: LOW
🧠 ANALYSIS SUMMARY
Katy AI Signal: Katy AI shows NEUTRAL trend with HOLD signal, but the price target of $164.88 suggests a slight bearish tilt (-0.6% from current). This creates fundamental conflict with my analysis.
Technical Analysis: Current price $165.80 near session lows, down 6.49% on the day. Weekly momentum neutral but with +1.46% two-week bullish trend. EMA alignment shows bullish confirmation. Key resistance at $168.29 (Katy's stop level), support at $161.70 session low.
News Sentiment: Bullish catalysts with recent AI trading success stories highlighting Alibaba's AI outperforming competitors. Positive sector momentum in AI technology, though general market sentiment remains cautious.
Options Flow: Neutral put/call ratio of 1.18 suggests balanced positioning. Unusual activity at $205 put indicates institutional hedging. Max pain at $170.00 provides upward pressure target.
Risk Level: HIGH - Katy AI shows neutral/bearish bias conflicting with bullish trade setup. Low conviction due to mixed signals and short 2-day window.
💰 TRADE SETUP
Expiry Date: 2025-11-07 (2 days)
Recommended Strike: $165.00
Entry Price: $2.35 - $2.48
Target 1: $3.50 (49% gain from entry)
Target 2: $4.20 (79% gain from entry)
Stop Loss: $1.80 (24% loss from entry)
Position Size: 1% of portfolio (low conviction due
Image
QS Analyst
APP
— 5:37 PM
to Katy conflict)
⚡ COMPETITIVE EDGE
Why This Trade: Combovershoots Katy's conservative target with strong AI news catalyst and max pain level alignment
Timing Advantage: Mid-week positioning before weekly expiration gamma squeeze potential
Risk Mitigation: Strike selection at $165 provides favorable delta (0.573) with current price action support
🚨 IMPORTANT NOTES
⚠️ CRITICAL CONFLICT: Katy AI shows NEUTRAL/HOLD with $164.88 target (-0.6%) while this is a CALL recommendation. This trade goes against Katy's primary signal.
⚠️ Extremely short timeframe (2 days) increases gamma risk significantly
⚠️ Low volume session (0.1x average) reduces momentum confirmation
⚠️ Only for experienced traders comfortable with high-risk weekly options
📊 TRADE DETAILS 📊
🎯 Instrument: BABA
🔀 Direction: CALL (LONG)
🎯 Strike: 165.00
💵 Entry Price: 2.42
🎯 Profit Target: 3.50
🛑 Stop Loss: 1.80
📅 Expiry: 2025-11-07
📏 Size: 1.0
📈 Confidence: 55%
⏰ Entry Timing: N/A
🕒 Signal Time: 2025-11-05 20:37:15 EST
🔴 HIGH RISK WARNING: Use only small position size due to lower confidence and high uncertainty.
PANW QuantSignals V3 Weekly 2025-11-05PANW QuantSignals V3 Weekly 2025-11-05
PANW Weekly Signal | 2025-11-05
• Direction: BUY PUTS | Confidence: 65%
• Expiry: 2025-11-07 (2 days)
• Strike Focus: $212.50
• Entry Range: $2.44
• Target 1: $3.66
• Stop Loss: $1.71
• Weekly Momentum: BEARISH (-1.23% 1W)
• Flow Intel: Bearish (High P/C Ratio) | PCR 2.77
• Max Pain: $212.50 (+0.4% vs spot)
• ⚠️ MODERATE RISK WARNING: Consider reducing position size due to moderate confidence level.
⚖️ Compliance: Educational commentary for QS Premium members only. No financial advice.
🎯 TRADE RECOMMENDATION
Direction: BUY PUTS
Confidence: 65%
Conviction Level: MEDIUM
🧠 ANALYSIS SUMMARY
Katy AI Signal: Neutral with 50% confidence, but targets $218.46 with stop loss at $208.48, suggesting upward bias with tight risk control
Technical Analysis: Current price $211.65, weekly momentum BEARISH (-1.23%), EMA alignment confirms downtrend, range position at 13.7% suggests room for further downside
News Sentiment: No major catalysts identified - market driven by technical factors and options positioning
Options Flow: Extremely bearish with Put/Call Ratio of 2.77, heavy put buying activity, high volume at $208 puts, Max Pain at $212.50 (+0.4% vs spot)
Risk Level: MEDIUM - 2-day expiry creates time decay risk, but strong options flow signals provide edge
💰 TRADE SETUP
Expiry Date: 2025-11-07 (2 days)
Recommended Strike: $212.50
Entry Price: $2.21 - $2.66 (mid: $2.44)
Target 1: $3.66 (50% gain from entry)
Target 2: $4.88 (100% gain from entry)
Stop Loss: $1.71 (30% loss from entry)
Position Size: 3% of portfolio
⚡ COMPETITIVE EDGE
Why This Trade: Strong options flow divergence (PCR 2.77) combined with technical bearish momentum and Katy's tight risk parameters
Timing Advantage: Mid-week positioning with Max Pain acting as resistance near current levels
Risk Mitigation: Katy's stop level at $208.48 provides natural exit point if trade reverse
Image
QS Analyst
APP
— 5:33 PM
s
🚨 IMPORTANT NOTES
Katy AI shows neutral signal (50% confidence) but technicals and options flow strongly favor puts
2-day expiry creates significant time decay - trade requires quick momentum
VIX rising (18.01) supports option premium expansion
Monitor for any breaking news that could disrupt technical patterns
📊 TRADE DETAILS 📊
🎯 Instrument: PANW
🔀 Direction: PUT (SHORT)
🎯 Strike: 212.50
💵 Entry Price: 2.44
🎯 Profit Target: 3.66
🛑 Stop Loss: 1.71
📅 Expiry: 2025-11-07
📏 Size: 3.0
📈 Confidence: 65%
⏰ Entry Timing: N/A
🕒 Signal Time: 2025-11-05 20:33:01 EST
⚠️ MODERATE RISK WARNING: Consider reducing position size due to moderate confidence level.

EUR/USD long: Love it or lump itHello traders
My last EUR/USD trade ended in a 20 pip profit. No complaints.
This is a purely fundamental trade.
Markets have been roiled since president Trump announced the liberation day tariffs in April 2025.
This situation is heading for a conclusion of some sorts this week. The US Supreme Court hearing on the legality of the tariffs start on Wednesday 11/5/2025. That is where the countdown starts on this trade. Up until then I do no expect any significant moves in the pair given the sanguine ECB rate decision and the FOMC decision that may be interpreted as hawkish but is actually guided by the lack of data due to the US Government shut down.
A hundred plus companies have filed WARN notices indicating plans to lay off employees in November. This list includes Meta, Amazon, UPS and Alphabet.
While a pull back in AI hiring and consolidation is certainly a contributing factor, it is more likely that major S&P 500 companies are expecting more headwinds and/or hedging against the tariff outcome, moving into 2026. It is still easier to hire than fire in the USA...
Therefore, this currency pair is caught between the deteriorating US labor market and the market outlook based on potential inflation increase once the US Supreme Court renders the final word on the tariff situation.
But everyone knows that already.
At this point it is really a crap shoot but I am OK with a small bet on this trade. Stop below 1.1495, the 6/2/2025 weekly high.
Do your own reading and research and best of luck.

Gold/Oil Signaling Market Is In A Super Bubble Gold = Fear
Oil = how strong the economy is.
Except for COVID we have never seen such an extreme reading. Yet people are buying up stocks like we will never again be able to produce another stock again as long as we live!
Tulips!
Here are just a few of the factors to consider that make this indicator important.
Why This Indicator Matters: Key Factors at a Glance
Gold’s Surge Signals a Shift
Gold has soared nearly 60% year-to-date, adding a staggering $10 trillion in market capitalization. This rally effectively erases all the stock market gains made since May 2021, including those driven by AI enthusiasm and speculative tech runs.
USD Can Only Be Measured Against Gold
As the world’s reserve currency, the U.S. dollar’s real value is best gauged in terms of gold. This is a critical point—because when gold rises this dramatically, it reflects monetary inflation. A large part of the stock market rally has been driven by an expanding money supply, not true value creation.
Curiously, this inflation hasn’t shown up in oil prices, which have collapsed, despite geopolitical risks. More on that below.
The Dollar’s Worst Year in Decades
2025 marks one of the most significant declines for the U.S. dollar in recent history. Its role as the world reserve currency (WRC) has diminished—from 85% in the 1970s to just 50% today. Trade wars and tariffs are only accelerating this trend.
Monetary Inflation Drives Stock Prices
Stock markets are being lifted by monetary inflation, not organic growth. Stocks can be created endlessly—unlike gold. That makes gold a true inflation benchmark. The stock market’s rise is, in large part, a mirage, reflecting debased currency, not real productivity.
Oil Isn’t Behaving as Expected—Why?
Typically, when the dollar weakens, oil prices rise—because more dollars are needed to buy the same barrel of oil. But right now, oil prices are soft. Why?
Global demand is weak, outpaced by supply. Even the Russia-Ukraine war hasn’t changed that dynamic. In fact, Russia is now importing gasoline, as Ukrainian forces continue to target and disable refining capacity.
Here’s why this matters: when oil wells are opened, they can't just be turned off. If the refiners are destroyed and the oil has nowhere to go—it’s wasted. That’s a strategic win for Ukraine.
The Disconnect Between Stock Prices and Profits
While inflation has pushed stock prices higher, it hasn’t translated into equivalent profit growth.
Example: If a stock goes from $10 to $20 due to inflation, you'd expect earnings to go from $1 to $2 to maintain the same P/E ratio. Instead, the earnings yield is just 3.2%—a historical low. That’s a major red flag.
As pilots would say: WTF, over?
Here’s the likely explanation:
The money hasn’t reached consumers—it's concentrated in the hands of wealthy savers and leveraged investors, who are buying more stocks to sell to the next buyer willing to lever up even more. It’s a classic feedback loop—and a superbubble reminiscent of the tulip mania era.
The Smart Money Knows What's Coming
As this imbalance grows more obvious, central banks and institutional investors are quietly increasing their gold holdings—well above the pace of supply growth.
So when Gold/Oil (two important commodities) completely disconnect like this, and Gold explodes up like this, you'd better take notice!
Lastly, it takes 100 ounces to buy a new home. Last time this occurred was in 1978 ish, 2011, and now!
Debt to GDP in 76 was 33%, 2011 was 99% and today 126% It is not the same animal as the past.
GTFO & STFO! No matter where the prices for stocks go!
CAUTION!!!

Buyer chart here but can they get the job doneBuyers returned to the S&P 500 daily chart but can they get the job done by providing follow-through to the upside on Thursday.
