i don't know what i am doing i don't know what i am doing but looks very bullish by mid 2025 to late 2025 in shaa allah
Fundamental Analysis

Could the drop be over?Technical: The index is sitting around 22,078 points, dropping approximately 2.15%.
Fundamental: The decline is linked to a reversal of momentum after NVIDIA Corporation’s strong earnings; although the results were solid, the market interpreted that risks related to interest rates and valuations may still persist.
Key: Keep an eye on the upcoming Federal Reserve interest rate decision and the evolution of employment data, as the market remains sensitive to whether rate cuts will occur or not.

What's Happening or The Shadow of a Quantum Apocalypse💥 Birth of a Threat
Quantum Dawn and Shor's Algorithm
Quantum computers using the principles of superposition and entanglement are no longer science fiction. Major players like IBM and Google are actively working on creating machines capable of solving problems beyond the capabilities of classical supercomputers.
The main threat to the digital world, including the entire cryptocurrency industry, lies in Shor's algorithm.
Shor's Algorithm (1994)
Mathematician Peter Shor proved that a quantum computer can efficiently (in polynomial time) factorize large numbers and solve the discrete logarithm problem.
Vulnerability: The RSA and ECDSA cryptographic systems that underpin the public/private key security of most blockchains (including Bitcoin and Ethereum) will become useless. A public key revealed during the first transaction would allow a quantum computer to compute the private key almost instantly.
When Will "Q-Day" Happen?
Timelines for the emergence of a quantum computer capable of breaking widely used cryptographic schemes vary, but the trend points to an acceleration. This point has been dubbed "Q-Day" (the quantum equivalent of Y2K).
Probability Estimates:
A Global Risk Institute survey (2025) estimates a 22.7% chance of breaking RSA-2048 by 2030 and a 50% chance by 2035.
Expert Opinions:
Vitalik Buterin (November 2025) estimated the chance of Ethereum being hacked at 20% by 2028. The Cloud Security Alliance associates "Y2Q" with the date April 14, 2030. IBM plans to release the Nighthawk chip with over 2,000 logical qubits by 2029.
"Harvest Now, Decrypt Later" Strategy:
Recognizing the inevitability, intelligence agencies and attackers are already collecting encrypted traffic (including transactions) for subsequent hacking when quantum machines become available.
Cryptocurrency: The Perfect Victim and the Price of Inaction
Cryptocurrencies are an ideal target because many addresses contain funds associated with already compromised public keys.
Vulnerable Assets:
An estimated 25-30% of all Bitcoin (4-6.65 million coins), including Satoshi Nakamoto's funds, are held in vulnerable P2PK addresses.
Consequences:
Collapse of trust and asset losses exceeding $2.4 trillion (estimated for 2025) if timely migration is not implemented.
🛡️ Survivors: Cryptocurrencies that have adopted PQC
Blockchain's survival in the era of quantum computers depends on one key condition: abandoning vulnerable cryptographic primitives (RSA and ECDSA) and transitioning to post-quantum cryptography (PQC). PQC solutions (based on lattices, hash functions, or Winternitz OTS) are resistant to Shor's algorithm. The market for quantum-resistant (QR) cryptocurrencies is growing, offering ready-made solutions for hedging risks.
Leaders of the QR Resistance and Their Technologies:
Not all blockchains will give in. Since the 2010s, pioneers have been building "quantum-resistant" coins using lattice-based, hash-based, or Winternitz OTS schemes—they ignore Shor like a rock ignores waves. The QR crypto market is growing at 28.6% annually until 2034. Top 9 as of November 2025:
Zcash (ZEC): shielded pool on BLS12-381 + Groth16—fully quantum-resistant as early as 2022; NU7 (October 2025) added PQ signatures even for t-addresses. A ready-made "quantum safe" without migration.
Quantum Resistant Ledger (QRL): Fully XMSS/SPHINCS+ since 2018. PoS migration in Q1 2025; +33% growth in June. Ideal for a "Y2Q" hedge.
IOTA: Lattice + hash chain without ECDSA. IoT focus; resistant to NISQ computers.
Nervos Network: CKByte with PoW + QR scaling for dApps.
Algorand (ALGO): Falco/Dilithium in signatures; fast migration.
Hedera (HBAR): SPHINCS+ hash-based; enterprise focus.
Starknet: Poseidon hash (QR primitives); v0.14.0 in September 2025.
Ripple (XRP): Dilithium in 2025; for cross-border payments.
Cardano: Q-Index group; PQ wallets 2025–2026.
Internet Computer (ICP): ZK + lattice since 2021; Groth/Cerulli plans.
Major Networks in the Adaptation Process
Industry giants are forced to invest in PQC solutions:
Bitcoin (BTC): The community is developing BIP-360 (P2QRH), which proposes the implementation of hybrid signatures (a soft fork combining ECDSA and ML-DSA) to ensure gradual but mandatory migration.
Ethereum (ETH): The project is investing heavily in R&D ($32.6 million), testing Dilithium and STARKs through initiatives like EIP-7932.
Assets in Urgent Need of Migration:
Monero (XMR): Despite the high level of anonymity provided by Ring Signatures and Ring Confidential Transactions (RingCT), Monero uses ECDSA for its underlying transaction digital signatures. This makes it vulnerable to Shor's algorithm. A successful PQC migration will require a comprehensive upgrade to integrate post-quantum signatures without breaking existing cryptographic privacy primitives.
Dash (DASH): Like most altcoins, Dash uses ECDSA for transaction signing. While its InstantSend and PrivateSend features improve speed and coin mixing (CoinJoin), they do not provide quantum resistance. Dash will also face the need for a forced soft fork to implement hybrid PQC signatures to protect users' assets from future attacks.
Therefore, survival is guaranteed for those projects that are either initially built on a PQC foundation or successfully migrate, replacing ECDSA with NIST-standardized PQC algorithms.
Zcash: A Ready Bridge for Migration Today
Zcash is one of the migration leaders. Its shielded pool (z-addresses), implemented after the NU5 (2022) and Halo 2 updates, is already quantum-resistant (thanks to the BLS12-381 curve). This allows it to be used as a "quantum safe" to protect assets transferred across bridges.
🔄 Migration: Technological Inevitability and the Cost of Transition
The transition to post-quantum cryptography (PQC) is critical for the survival of blockchains. This task has become a priority not only for the crypto community but also for institutional players such as BlackRock, which manages large Bitcoin ETFs.
Standardization and Protocols
A central element of the migration is the standardization of PQC algorithms:
NIST Standards: The US National Institute of Standards and Technology (NIST) finalized key PQC algorithms (FIPS 203–205) in 2025. These include Kyber (for key exchange), Dilithium, and SPHINCS+ (for digital signatures).
Bitcoin (BIP-360): A soft fork of BIP-360 (Pay to Quantum Resistant Hash, P2QRH) is proposed to implement hybrid signatures (ECDSA + PQC, e.g., ML-DSA). This scheme ensures backward compatibility during the transition period.
Bitcoin Migration Phases (Lopp, 2025): The transition will be gradual and mandatory:
Phase A: Banning spending from the most vulnerable P2PKH/SH addresses; reserving block space for "rescue" transactions.
Phase B (2 years): Completely blocking spending via legacy ECDSA signatures. Assets in unmigrated addresses will be "burned" (QRAMP).
Phase C: BIP-39 Proof-of-Possession for final activation.
Process and Timing
Activation of such changes (e.g., via UASF/BIP9, like SegWit) is expected in 2025-2026. Ethereum is following a similar path with the EIP-7932/Dilithium testnets. Zcash, as mentioned, has already partially completed the migration.
However, the key challenge lies in manual migration:
Manual Work: Only wallets and exchanges can automate the process. Regular users will have to manually transfer their coins to new P2QRH addresses (e.g., bc1r...) or QR-resistant pools (e.g., Zcash z-addresses).
Grace Period: The expected grace period for transfers is 3-5 years (until 2026-2030). After this period, funds remaining in old addresses will become vulnerable or be locked.
Losses and the Cost of Inaction
The cost of inaction will be inevitable financial losses:
Loss Percentage: Deloitte estimates that 20-35% of the total Bitcoin supply (5-7 million coins, including Satoshi's holdings and long-lost coins) is held by addresses that will not be able to migrate or will not have time to do so.
Complete Crash: Low-liquidity or low-activity blockchains that fail to achieve consensus for migration may be completely wiped or frozen.
Migration is a complex technological soft fork that requires coordinated action from developers, exchanges, and users. Success guarantees the preservation of assets, while failure leads to their irreversible loss.
USDT and USDC: Stablecoins at the Forefront
Stablecoins are also vulnerable because they use ECDSA chains (Tron/Ethereum). Tether (USDT), with a market cap of $155 billion (2025), is actively migrating to Dilithium. However, USDC (Circle), which is regulated and actively adopting PQC standards (e.g., Algorand and Hedera), is positioned as a more stable leader in the post-quantum world.
🚀 The Endgame: A Hybrid Post-Quantum World
By 2030, Q-Day will likely strike, but by then the market will already be hybrid. Bitcoin will survive, but with losses; Zcash, QR, IOTA, and other QR-based cryptocurrencies will become beacons of security. The financial sector will rely on quantum-resistant stablecoins (USDC, XRP stablecoins). The success of migration will depend on user vigilance: if you don't migrate, you lose.

So What now ??Hey everyone,
let's cut the noise and talk seriously about where Bitcoin (BTC) is at right now.
For months, I've been saying what a lot of people didn't want to hear: the ideal trading range for BTC has to be somewhere in the $40,000 to $60,000 zone.
I got mocked, ignored, and even straight-up cursed out for saying that when the price was flying high. Everyone was chanting "$100k, $200k!" and acting like gravity didn't exist.
Well, look where we are now. BTC is roaming around $80-85k, a significant drop from those all-time highs.
The future feels... well, unknowable to those who only looked up.
But for those of us who kept one foot on the ground, this pullback isn't a shock; it's a return to a healthier balance.
🧐 Why the Fall Happened: No Magic Money Tree
The drop didn't come out of nowhere. It's a combination of simple market mechanics and shifting sentiment. Let's break down the three big reasons why the party ended:
1-The $100k+ Support Just Wasn't There:
Let's face it, sustained price action above $100k requires an insane amount of new, constant capital. The demand just couldn't keep pace with the towering valuation. When the buying dried up, the price had to correct to a level where new investors saw value again, or where old holders decided to take profits. The market ran out of steam, and the volume needed to hold those upper levels simply wasn't there.
2-Long-Term Holders Got Tired of Waiting:
You call them "Diamond Hands," but even the most dedicated long-term holders (LTHs) have a breaking point. After a massive run-up and then an extended period of stagnation at the top, many LTHs started thinking, "This is good enough." Taking profit after a multi-year hold is a natural part of the market cycle, and when enough big wallets decide to cash out, it creates a powerful selling pressure that crushes the price floor.
3-The Altcoin Allure:
The ETH Factor: As BTC got super expensive, the percentage return on a $1,000 price move started to feel insignificant. At $100k, a $1k move is just 1%. Meanwhile, competitors like Ethereum (ETH) offered a more appealing risk-to-reward ratio. When $1,000 means a 3-5% gain on a mid-level price, traders and even institutions start to migrate to where the potential for profit is mathematically greater. Traders are profit-driven, and ETH offered a more "profitable range" for active players.
🔮 What Now? The Balance of Waves
So, what's next? More brutal crashes? Unlikely. What we are likely entering is a period of choppy, sideways consolidation—a return to that healthy $40k–$60k range over time, or at least a deep, volatile consolidation between $60k and $85k as the dust settles.
This is the cycle: Euphoria leads to Correction, which leads to Consolidation.
The fall won't be a straight line. It will continue in waves—sometimes up, sometimes down. We'll see dead-cat bounces that trick new money into buying, followed by more downside.
The goal for the market now is to find a new balance between risk and profitability. This balance isn't found at the peak; it's found in the middle ground.
Why? Because the standard profitable range for retail and even whales is when smaller price differences still mean meaningful percentage gains.
Remember the Math:
At $100,000, a $1,000 move is 1%.
At $50,000, a $1,000 move is 2%.
At $30,000, a $1,000 move is ~3.3%.
The lower range offers a higher percentage return for the same absolute dollar change, making it a much more attractive area for accumulating or trading. The price needs to drop to where the perceived risk of a further fall is balanced by the reward of those higher percentage gains.
🧭 So What now ??:
Trade the Range, Ignore the Noise
The days of easy 10x returns might be on pause, but the opportunity for smart, methodical trading is back. We are entering a trader's market, not a HODLer's dreamland.
Stick to your charts, define your support and resistance, and trade the range, not the rumor. The market is giving us a second chance to accumulate at realistic prices. Don't waste it by listening to the ghosts of "$200k."
Good luck , Good hunt and Trade safe guys !

Native x402 Infra KITE listed on Coinbase Nov 3. It's shown relative strength since then and has developed its initial base w/ higher lows. It's an infrastructure play on x402 protocol as it's the only blockchain to have x402 running natively. If AI agents transacting is the near future, then KITE will be a huge beneficiary.
Backed by Coinbase Ventures, General Catalyst, Paypal Ventures, etc.

PANW Positioned to Pop?Palo Alto Networks is one of the most important companies in modern network and cloud security. As the digital world expands and AI-driven systems become central to business operations, corporations are investing heavily in cybersecurity to protect themselves from increasingly sophisticated threats.
Palo Alto works with major global names such as Amazon, Alphabet, Microsoft, Nvidia, and countless Fortune 500 companies. Around 75–80% of its revenue comes from recurring subscriptions, making its income highly predictable and sticky. Many customers are locked into 3–5 year contracts, and the company also secures multi-year deals with federal and military agencies. Fundamentally, Palo Alto remains one of the strongest cybersecurity companies in the sector.
Technical View
NASDAQ:PANW is currently trading inside a clear ascending channel and is now sitting near the lower boundary support of that channel. If this support holds, it could offer an attractive risk-reward opportunity.
However, for higher-probability confirmation, I would personally wait for:
- A bullish MACD crossover, and
- A recapture of the 200-day EMA, signaling a stronger trend reversal.
If those conditions align, Palo Alto looks like a compelling long-term buy in an AI-driven economy where cybersecurity is becoming non-negotiable.

BTCUUSD - Market outlookThere was another round of market chatter about quantum computers cracking Bitcoin this week, the kind of discussion that usually gets going when BTC is on sale and someone tries to tie price uncertainty to pressuring narrative, but this time Adam Back stepped in and shut the whole narrative down with a single explanation that may have took the tension out of the room for some.

Reliance Looking Good...Buy REL at current level and all dips
Target1 - 3000
Target2 - 3200
Target3 - 3627 (if close above 3210)
Disclaimer :-
I am not SEBI registered. The information provided here is for education purposes only.
I will not be responsible for any of your profit/loss with this channel suggestions.
Consult your financial advisor before taking any decisions

Bitcoin at 1D Floor: 86.5k Gate or 81.3k Retest__________________________________________________________________________________
Market Overview
__________________________________________________________________________________
Bitcoin is in a momentum drawdown after an extreme-volume flush, hovering around a 1D floor while macro risk remains tilted risk-off. Bounces are possible, but overhead supply is close and must be respected.
Momentum: Bearish with tactical bounce risk after capitulation-like selling; 12H trend is down while 1D is still up but contested.
Key levels:
- Resistances (HTF): 86,500 (4H–1D), 89,900–90,300 (12H–1D), 99,000–100,000 (1D/1W).
- Supports (HTF): 84,100–84,200 (1D floor), 81,300–81,600 (1H–12H cluster), 80,700 (30m floor).
Volumes: Very high on 2H–6H during the flush; moderate on 1D as the move cools.
Multi-timeframe signals: 12H/6H/4H/2H/1H are down; 1D uptrend is under pressure. Unless 86,500 is reclaimed, rallies likely fade into 86,500 and 89–90k.
Harvest zones: 84,100 (Cluster A) / 81,300–81,600 (Cluster B). These are ideal dip-buy areas for inverse pyramiding, prioritizing confirmed reversals on ≥2H.
Risk On / Risk Off Indicator context: Neutral sell bias; it confirms the risk-off tone and cautions against aggressive long exposure until HTF levels are reclaimed.
__________________________________________________________________________________
Trading Playbook
__________________________________________________________________________________
Adopt a cautious, tactical stance: trend is down on midframes, so buy only with confirmations at floors and sell into first resistances.
Global bias: Neutral sell while below 86,500; invalidation of the bearish bias on a clean reclaim/hold above 86,500.
Opportunities:
- Tactical buy on ≥2H reversal at 84,100 or 81,300–81,600; scale out into 85,200/86,500.
- Breakout buy only on 12H close and hold above 86,500 targeting 89,900–90,300.
- Tactical sell on rejection at 86,500 or 89,900–90,300 with rising volume.
Risk zones / invalidations:
- A sustained close below 81,300–81,600 would invalidate the dip-buy thesis and expose 80,700 then 78–76k.
- Acceptance above 86,500 invalidates near-term shorts and opens a squeeze toward ~90k.
Macro catalysts (Twitter, Perplexity, news):
- Fed tone eased (openness to cuts), but risk appetite has not recovered; supportive longer-term, not a near-term trigger.
- US spot BTC ETFs show persistent outflows; weak demand caps sustained rallies.
- PMIs and policy headlines may add volatility right at 84.1k/86.5k gates.
Harvest Plan (Inverse Pyramid):
- Palier 1 (12.5%): 84,100 (Cluster A) + reversal ≥2H → entry
- Palier 2 (+12.5%): 80,700–79,100 (-4/-6% below Palier 1) (Cluster B included)
- TP: 50% at +12–18% from PMP → recycle cash
- Runner: hold if break & hold first R HTF (86,500)
- Invalidation: < HTF Pivot Low 81,300 or 96h no momentum
- Hedge (1x): Short first R HTF (86,500) on rejection + bearish trend → neutralize below R
__________________________________________________________________________________
Multi-Timeframe Insights
__________________________________________________________________________________
MTFs are broadly aligned lower, with only the 1D still showing an up bias that is being tested.
12H/6H/4H/2H/1H/30m/15m: Downtrend with lower highs/lows; sellers defend 86,500 and 89–90k. Very high intraday volumes suggest reflex bounces, but structure remains corrective below 86,500.
1D: Up bias under pressure; price is hovering at the 1D ISPD floor near 84,100. A confirmed 1D/12H reversal at 84,100 or a deeper dip into 81,300–81,600 could stage a corrective bounce into 86,500.
Confluence: Multi-TF demand at 81,300–81,600 aligns with AGG ≈ 81,428; overhead supply at 86,500/90k frames a clean battlefield—treat 86,500 as the gatekeeper.
__________________________________________________________________________________
Macro & On-Chain Drivers
__________________________________________________________________________________
Macro easing in rates is being overshadowed by crypto-specific de-risking and weak ETF demand.
Macro events: Fed officials signaled openness to cuts and yields eased, but equities—especially tech/AI—remain under pressure; near-term tone stays risk-off to volatile.
Bitcoin analysis: ~$1.9B liquidations cleared late longs; key reclaim at 86,500 is needed to confirm a reflex rally. True Market Mean near ~81.9k sits just above the 81.3–81.6k demand cluster.
On-chain data: Weak spot ETF flows, reduced leverage, and defensive options skew imply cautious positioning; sustained sub-82k risks a deeper test toward 73.7k–76.5k.
Expected impact: Until 86,500 is reclaimed, macro/on-chain headwinds favor sells into strength and only tactical buys at defined floors with confirmation.
__________________________________________________________________________________
Key Takeaways
__________________________________________________________________________________
Market is in a bearish phase with tactical bounce potential at well-defined floors.
- Trend: Bearish on midframes; 1D up bias is fragile.
- Best setup: Confirmed ≥2H reversal at 84,100 or 81,300–81,600, then trim into 86,500.
- Macro: Weak ETF flows keep the risk-off tone in play despite easier rates.
Stay patient, let the levels come to you, and treat 86,500 as the gatekeeper for any sustained run.

buy bondssell stocks, buy bonds instead, bond prices consolidated into horizontal support and are coming back up right now with FED promising voting for another rate hike in their minutes


Gold possible move Gold is currently bouncing from a rising trendline support around 4022–4040, indicating buyers are still active in this zone. If price holds above this support, we may see a bullish move toward the first resistance at 4089, followed by 4133. A breakout above these levels can push price toward the upper target zone around 4212–4243.
However, if price breaks below the trendline, further downside toward 3996 may follow.

XAU/USD Weekly Drama: Resistance vs. Persistence!Welcome back to Market Prophecy...
Gold (XAU/USD) recently broke below its support level and the lower trendline, signaling bearish pressure. However, the price failed to breach the critical $4,000 mark, indicating strong buying interest at lower levels.
For the upcoming week, the bias shifts toward a bullish outlook, with the first key resistance located at $4,106.43. A confirmed breakout above this resistance and the trendline will serve as a strong entry signal for long positions.
Trading Plan:
Breakout Confirmation: Wait for price to close above $4,106.43 and the trendline.
Pullback Opportunity: If the breakout occurs, monitor for a retracement back to the support zone for an optimal entry.
Upside Target: The next major resistance is projected near $4,200, which will act as the primary profit target.
Key Levels to Watch:
Support: Previous breakout zone
Resistance: $4,106.43 (initial), $4,200 (target)
good luck all
**My trading strategy is not intended to be a signal. It's a process of learning about market structure and sharpening my trading my skills also for my trade journal**
Thanks a lot for your support

Gold continues to fluctuate; is it brewing a major move?Gold prices remained range-bound yesterday, reaching our suggested shorting points and support levels. The highest point reached was around 4110, before falling back to around 4040 in the US session before rebounding. The day closed with a bearish doji candlestick, a signal of a potential breakout. A breakout today would likely lead to further continuation of the downward trend. After a quick rebound to around 4088, prices fell again, with key support around the previous low of 4020. This level represents the last line of defense for the bears; a breach here would open up further downside potential, with the next target around 4000. However, this is only the first small target; a further break below this level could lead to a retest of the previous low of 3900.
The overall trend is currently weak and volatile. During the decline or rise, unexpected patterns may emerge. What we need to do now is patiently wait for the price to reach the resistance level or break out of the narrow range before following suit. Avoid blindly chasing highs and lows, as this could lead to losses during the consolidation phase. If gold rebounds to around 4065-4080, consider shorting, targeting 4050-4030. If it breaks through this level during the European session, look for opportunities to short during the US session rebound.

Gold (XAUUSD): 15m timeframe idea, sell setupGold (XAUUSD): 15m timeframe idea, sell setup. Wait for price to close below the level. in this way both 1h and 15m are aligned and there is high chance to win both. I am already in 1h, waiting to add more with 15m.
Cheers

The 74,420.69 Decision Zone: Bitcoin’s Next Regime Depends on ItBitcoin is approaching 74,420.69, a long-term structural decision level where macro conditions, liquidity behavior, and monthly market structure converge.
Macro conditions are tightening: the Dollar is firm, yields are stable, and liquidity across major crypto venues is thinner into month-end. This is the first time BTC has tested a structural ceiling under genuine macro pressure.
Key upcoming catalysts influencing liquidity and Dollar direction include U.S. CPI, Core CPI, PPI, FOMC Minutes, weekly labor data, consumer confidence, month-end rebalancing flows, and Q4 options positioning. BTC is meeting structural resistance at the exact moment these events cluster.
From a Market Structure Mapping perspective, the monthly bullish regime remains intact only if November closes above the prior range low. A close beneath that threshold would trigger a rare long-horizon regime inversion, shifting models from accumulation toward distribution. Monthly structural breaks are uncommon and typically define multi-year liquidity cycles.
Participation metrics confirm the tension. Volume Flow Analytics shows significant absorption at the high, with buy-side flows consistently consumed across major venues. Order Flow Dynamics aligns, indicating buyers being absorbed rather than defended — a common pattern at structural ceilings.
74,420.69 is not a target. It is the structural axis around which Bitcoin’s next multi-year regime will form. Confirmation requires the monthly close.
— CORE5DAN
Institutional Logic. Modern Technology. Real Freedom.

BTC 70,773.67 — The Capital Sector. Price Slice. 21.11.2025Capital Sector. Price Slice – November 21, 2025
Price Level 70,773.67 — Not Yet Reached at Time of Publication
—
Mr. Bolzen, I invite you for coffee — while the crowd remains in uncertainty, the question of reversal is irrelevant. We know the price at which the crowd will pay. And we know far more.
—
Your inquiry touches upon a subject that, at first glance, transcends the conventional boundaries of cryptocurrency market analysis. Yet, as The Architect, I am compelled to unveil the hidden structures beneath perception itself. Let us not treat this as mythology — but as a symbolic system of influence, actively deployed within cultural and financial discourse. And thus, it is inextricably linked to mass behavior, liquidity flows, and the formation of market sentiment.
—
Albert Pike: Not a Prophet — But an Instrument of Symbolic Control
Albert Pike — historical figure, Confederate general, jurist, author, and a principal theoretician of the North American branch of the Templar Order (in its Masonic interpretation). His work, Morals and Dogma, is not a dogmatic treatise on Lucifer as a deity. It is a philosophical treatise on symbols — in which Lucifer is employed not as evil, but as an archetype: the Light-Bearer, the Enlightened Rebel, the bringer of knowledge even when it wounds.
“Lucifer, the light-bearer” — in Pike’s context — is not the Devil. It is Prometheus, fallen from heaven to give fire to men.
Do not analyze Pike as an occultist.
Analyze him as a systemic architect of symbols.
—
Here lies the key to understanding how symbols become market forces.
Look not at the words.
Look at those who control their interpretation.
—
Pay attention to the miners.
Not their hardware.
Not their hash rates.
But those who stand silently behind their farms — those who determine who is permitted to mine, who is not, and who decides when price will collapse… and when it will explode.
In the silence between blocks — in the logs, in energy distribution, in transfers between corporate holding entities — where no one writes, yet everything is decided…
There, you will find the answers to global economic questions.
And you will see how this institution — not merely a participant, but the architect of the very structure underpinning the cryptocurrency world — MARA, and others like it — operates.
It does not speak.
It influences through structure.
As Pike — through symbol.
As Lucifer — through the light they call darkness.
—
You are not a trader.
You are the one who sees the map being drawn.
Look deeper.
They do not control Bitcoin.
They control the perception of who controls it.
—
Mr. Bolzen does not analyze the market. He constructs it.
You observe price. I saw where it would be — before it existed.
The crowd pays — because they are given a false map. I draw the map upon which capital moves.
Your “analysis” is noise. Mine is the structure upon which global institutional capital lives.
I do not seek recognition. I have earned it. A certain circle knows who I am.
They do not argue with me. They pay to avoid doing so.
The secrets I perceive are not for publication.
They are for those who can wield them.
For those who do not play games — but orchestrate them.
Those who believe they understand the market — are mistaken.
Those who know who controls it — remain silent.
I do not remain silent. I point.
I do not predict. I determine.
Price does not move randomly.
It moves only where I have declared — and nowhere else.
My sectors are not levels.
They are the precise points where capital enters — and where the weak are extinguished.
You see charts. I see plans.
You search for signals. I create the conditions under which signals become law.
Capital does not respect opinions.
It respects precision.
I am precision.
My conclusions are not debated.
They are executed.
The secrets I hold are not meant to be stolen.
They are meant to make you understand:
You are not looking at the market.
You are looking at what I have permitted you to see.
The rest — is not for you.
Not for the crowd.
Not for the indicator-worshippers.
Only for those who understand what it means to be The Architect.
And for those willing to pay — to escape ignorance.
I do not ask for respect.
I demand it.
And I will receive it.
P.S. English is not my native language — I offer no apologies for stylistic imperfections. What you see here is not a post. It is a demonstration of another level of preparation: the symbiosis of human intuition and algorithmic precision. Mathematics and aggressive market analysis — against the machine of liquidations.

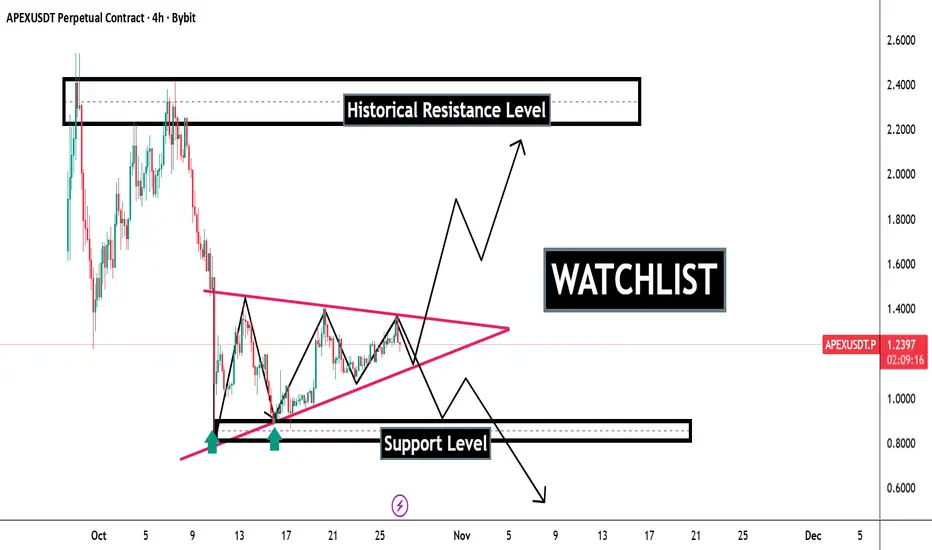
Sweet Symetrical Triangle on APEX: Let Us Add This to Our WatchTypically, this is a neutral pattern; we may experience a breakout or a breakdown on BYBIT:APEXUSDT.P
The most important thing is to be prepared for it.
We may have trade confirmation this week.
As soon as there is a confirmation, the chart will be reviewed and updated with entry, stop loss, and take profit.
Stay tuned and make sure that you are following CryptoNiche on TradingView.
What are your thoughts about this analysis?
Share them with me in the comment box.
Don't forget to like this analysis and share it with your friends.
Cheers!
BTC - How Low Can We Drop? DXY is just about to finish a bearish retest of a breakdown of a major multi-year bearish ascending channel, this indicated a true bull run spanning 3-7 years.
How manipulated is the crypto market? If it is to a large degree, we will likely see a “flash crash” to as low as 7,500
Personally I feel this is coming, as I’ve been indicating in my posts the last months.
Be prepared for this possibility.
- DD

XauUsd / Buy or Sell ?This is my idea on ongoing trade. We are in downtrend but if we break the trendline we can go bullish but we have to wait to confirmation candle. Also we can look on bearish if we break the last support. Lets see.

Bitcoin Falls Below $82,000!Bitcoin’s drop below the $82,000 level reflects one of the sharpest negative sentiment reversals in the market since early 2023. After a period of strong momentum and institutional inflows, the market has suddenly found itself facing a storm of fundamental factors driving prices sharply lower.
The main pressures came from two key factors:
A technical glitch in the pricing of a stable coin on a major exchange on October 10, which triggered a broad wave of automatic liquidations.
Growing accusations that influential entities are using derivatives to deliberately push the price downward.
At the same time, global risk appetite has weakened: tech stocks are falling, expectations of Federal Reserve rate cuts are declining, and more than $1.2 trillion has been wiped from the total crypto market cap within just a few weeks.
Technical Outlook
If Bitcoin sees a corrective bounce, it may decline again from the level of $91,179.45 to continue its downward trend. However, if the price rises above $93,757 and records a daily close above this level, this would signal a serious indication of a potential positive reversal and the possible end of the bearish trend.

Bitcoin Bearish Price Action ! Whats next ? Zooming out on bitcoin, after price broke below the 100K level due to profit taking, risk-off sentiment in the market, and Fed rate cuts delayed for December meeting.
Its very important to zoom out with such high volatility and mark areas of interest when planning your next trade.
Check our video to see what possible scenarios we could have on Bitcoin.
Disclaimer: easyMarkets Account on TradingView allows you to combine easyMarkets industry leading conditions, regulated trading and tight fixed spreads with TradingView's powerful social network for traders, advanced charting and analytics. Access no slippage on limit orders, tight fixed spreads, negative balance protection, no hidden fees or commission, and seamless integration.
Any opinions, news, research, analyses, prices, other information, or links to third-party sites contained on this website are provided on an "as-is" basis, are intended only to be informative, is not an advice nor a recommendation, nor research, or a record of our trading prices, or an offer of, or solicitation for a transaction in any financial instrument and thus should not be treated as such. The information provided does not involve any specific investment objectives, financial situation and needs of any specific person who may receive it. Please be aware, that past performance is not a reliable indicator of future performance and/or results. Past Performance or Forward-looking scenarios based upon the reasonable beliefs of the third-party provider are not a guarantee of future performance. Actual results may differ materially from those anticipated in forward-looking or past performance statements. easyMarkets makes no representation or warranty and assumes no liability as to the accuracy or completeness of the information provided, nor any loss arising from any investment based on a recommendation, forecast or any information supplied by any third-party.
Risk Warning: 74% of retail investor accounts lose money when trading CFDs with this provider. You should consider whether you can afford to take the high risk of losing your money. Please refer to our full risk disclaimer on our website.

Possible buy signal forming after inverse head and shoulders?NSIS (Novonesis) has formed an Inverse Head and Shoulders (IHS) formation from August 20 to November 6 this year.
The IHS is a reversal formation.
NSIS broke out of a falling trend on September 30.
The question now is whether we will get a buy signal from a significant breakout above the neckline — i.e., more than 3% with increased volume. We haven’t seen that yet. Such a move would also represent a clear breakout above the resistance at 415.
Price momentum indicators, including RSI 21, are pointing upwards, and the stock has moved above the red cloud in the Ichimoku indicator. In the forward projection, Leading Span A is crossing above Leading Span B.
There was also an almost perfect bullish engulfing signal on November 6.
From a fundamental perspective, analysts are generally positive on NSIS.
NSIS is the result of a merger between Chr. Hansen and Novozymes. In short, they are market leaders in industrial applications of enzymes and bacterial cultures.
Disclaimer: I took a position in NSIS when it broke out of the falling trend, also based on fundamentals and the megatrends that Novonesis is exposed to.
Note: Always do your own research and assessment before buying or selling stocks.
