ETH | Tuesday High of the week - Thursday ContinuationToday I'm looking for a continuation to sellside for the weekly profile framework.
I would like to see a distribution on 10 AM news and a delivery to DOL tomorrow with CPI.
Invalidation levels marked out on chart
Fundamental Analysis

Copper breaks outNice breakout from a triangle continuation pattern in copper prices today. It looks like the metal has found a good base around $5.000 now and after a few days trying to test waters below this level, where the bears failed to exert pressure, prices have now broken higher. Good sign about global growth, apparently. We have seen stronger Chinse data this week. Can we now see a push towards the range highs again? Key levels to watch shown on the chart.
By Fawad Razaqzada, market analyst with FOREX.com

Gold uptrend hasn’t over yet - the bull is just taking a break.It's not the end of the uptrend yet for gold; the bull is just taking a break.
Technical Analysis
1. XAUUSD remains trading within an ascending channel that has been emerged since early August 2025. Although the price briefly tested the lower boundary, it quickly rebounded.
2. The recent sharp drop occurred after gold broke above the ascending channel’s upper boundary while momentum indicators were overbought which mean the price was extremely bullish and subjected to correct back. This suggests merely a short-term consolidation after an excessively rise, rather than a bearish reversal.
3. The pullback may also reflect mean reversion, as price had been distance above the EMAs. Even so, XAUUSD is still holding above the short EMA (EMA21), and the multi-period EMAs maintaining uptrend structure.
4. On the candlestick interpretation, there was only one long bearish candlestick, followed by a pin bar that briefly dipped near 4000 before bouncing—implying the sell-off was absorbed by significant demand which mean the bearish momentum is fading.
5. A 400 USD decline from peak may look massive, but relative to a prior rally of over 1,000 USD in one leg, it is more likely a corrective move within a minor wave than a totally reversal.
6. From here, if XAUUSD can holds above the support at 3900, price is likely to move sideways in range for a while ( around 1–2 months), before resuming the uptrend.
7. In a more bullish scenario, if the price remains in within the ascending channel, we could see a new all-time high again soon, even with stronger bullish momentum that we haven't seen before.
8. However, if the price falls below 3900, that may signal a transition to a longer-term downtrend and would warrant a reassessment of this outlook.
Fundamental Analysis
9. The underlying fundamentals that have recently driven gold bullish has no sign of changing, meaning they should continue to support, including:
10. Central bank buying: Many central banks have been adding gold, creating steady, non-speculative demand and no sign of pause.
11. Geopolitics & fiscal stress: Ongoing conflicts, U.S.–China frictions, and debt/shutdown risks keep safe-haven demand for gold elevated.
12. US debt: This might be the actual most significant reason why the gold price has come this far and could drive the price beyond 4400. The demand for safe havens to avoid fiat currency.
13. Investment/ETF inflows: While equity prices may be overvalued, with increasing concern, gold becomes the most reliable investment vehicle. Gold ETFs have large YTD inflows (near record holdings), reinforcing momentum and demand.
14. Supply constraints: Few new mines and rising costs keep supply growth tight, supporting higher prices amid strong demand.
Analysis by: Krisada Yoonaisil, Financial Markets Strategist at Exness

AUD JPY long, 'risk on trade' It's another 'risk on' AUD JPY long trade.
Aside from the odd hiccup, the market has remained risk on this week. I do actually think the USD and CHF are also currently in play as 'short options'. I've gone for the JPY as it is clearly the weakest at the moment. Backed up by the dovish rhetoric following the Japan election.
The risk to the trade is negative market sentiment, or the fact the chart has already gone up a lot today and the trade could take a while to complete.

Gold (XAU/USD) – Short-Term Buy Bias with 65% ProbabilityGold looks constructive here. The intraday structure is turning positive, and price is holding above the short-term moving average again. It’s not a runaway trend yet, but the tone has shifted. I’d call it a short-term buy, with about 65% probability of follow-through. Confidence is medium, enough to justify a setup, but not enough to ignore the risks.
The macro side helps this view. Treasury yields are steady near 4%, and the dollar isn’t gaining traction. That combination takes some pressure off gold. There’s also a bit of safe-haven demand creeping in, maybe from risk-off sentiment or just traders repositioning ahead of data. Either way, it’s supporting price.
On the chart, 4,040–4,050 held up cleanly as support. You can see the bounce building momentum once price crossed above 4,120 and the 15-minute candles started closing above the moving average. A sustained move through 4,150 should confirm buyers are in control.
The plan’s simple enough to buy strength, manage risk tight. But I’d be careful around yield spikes or any surprise dollar strength. If DXY jumps or 10-year yields push higher, the setup can unwind quickly. I’d reduce size or exit early if that happens.
This trade leans on a theme that’s still being priced in for safe-haven demand and steady yields. That’s what makes it viable. If those supports fade, I’ll step aside.
Maybe the best way to put it is this: gold isn’t screaming higher, but it’s behaving like it wants to. You can see the rhythm change when markets start pricing in calm instead of panic.

October’s top stock performers: #AMD, #Amazon, #Tesla & moreIn October, FreshForex clients most frequently traded stocks like #AMD, #Amazon, #GoDaddy, #Tesla, and #Moderna — and these very assets showed the highest share of profitable trades. Capitalize on strong demand momentum and high liquidity: with earnings season and the holiday rush ahead, the “window of opportunity” is still open.
Outlook through the end of 2025:
#AMD: Shares could rise following the $6B AI compute deal with OpenAI and Oracle’s reported order of 50,000 next-gen MI450 chips.
#Amazon: Strong earnings on October 30, solid AWS growth, advertising contributions, and the fall Prime Big Deal Days may keep the stock bullish.
#GoDaddy: Stock may face pressure if SMB ARPU/inflows slow, plus FX headwinds could dampen August’s raised full-year guidance.
#Tesla: Growth potential supported by record 497K deliveries, 12.5 GWh energy deployments in Q3, and expansion of FSD v14 (Supervised).
#Moderna: Stock remains under pressure amid limited revenue visibility, delayed UK shipments, and postponed approval of its flu+COVID combo vaccine to 2026.
According to FreshForex analysts, the outlook for these stocks remains driven by AI investments and seasonal demand. But the strongest growth impulse is likely in Q1 2026, especially if the Fed eases policy and announced tech projects go live.

JPMorgan Chase — rebound after earnings?After posting stronger-than-expected Q3 results ($5.07 EPS vs $4.37 YoY), NYSE:JPM is holding the lower boundary of its ascending channel near $303.
Technical setup:
Support: $300 – 303 (channel bottom + psychological level)
Target: $311 – 312 (+ ≈ 3%)
MACD is turning upward — early sign of a potential bullish reversal
Price action shows strong demand recovery right after the earnings dip
If momentum holds, the next short-term leg could retest the mid-channel zone (~$312) before any pause.

Gold May Form a Bull Trap Before Another DropUnder the current strong bearish sentiment, gold has filled the gap around 4019 and touched the MA20 support on the 1D chart, followed by a strong rebound of over $150. After reaching the MA10 near 4160, the price pulled back again and is now trading below 4100.
On the 4H chart, the downtrend remains intact, with psychological support around the MA30 (near 3910). If bearish momentum continues during the U.S. session, a move toward this support level cannot be ruled out.
Personally, I expect gold to first test resistance around 4180–4200 or even 4250, forming a potential bull trap before another leg down. However, if supported by positive news and strong volume, the market could reverse and push prices back above 4300.
Moreover, if the price truly dips into the 3950–3910 range, I see it as a great opportunity for long positions — one I definitely won’t miss!
Of course, this is just my personal view. Ultimately, we should always follow the actual price action and trade cautiously, managing risk wisely.

2008 Crisis and How the Banking System Has Changed Since:
⚠️These headlines serve as a reminder that despite the Basel I, II, and III global banking regulations, we have not been spared from systemic risks originating within the financial system itself
🏦After the 2008 crisis, banks became heavily overregulated. As a result, many of their most lucrative investment and financing activities shifted into affiliated offshore hedge funds — entities that remain very much part of the same global financial machinery. They are simply no longer called “banks,” and therefore escape almost all regulation.
💵These hedge funds lend, repackage loans, buy and sell exotic financial instruments, re-hypothecate, and re-collateralize. They use questionable collateral to issue risky loans , which are then resold, repackaged, and used again as collateral again.
💰 Exotic derivatives, curreny swaps, REPO operations, outright fraud,risky options market-making, — you name it — all thrive offshore , far from regulatory oversight yet just a click away for clients. And make no mistake: these so-called “non-banks” are deeply interconnected with the global financial system. If they fail, the shockwaves will be felt everywhere.
📈 The next financial tsunami will begin offshore — but it’s the onshore world that will be hit the hardest . So don’t keep large sums of money in the bank, guys. Once your funds are in the bank, they’re no longer truly yours — they belong to the bank. Your account can be frozen, blocked, seized, taxed, or even converted into shares (as happened in Spain in 2011).
⚠️And remember: banks can fail. They will fail. And when they do — the government won’t save you.
Yours truly,
Greg🌹

YYAI RS, 949M outstanding shares, extremely overvaluedToday YYAI announced a RS of 50 to 1. At current outstanding shares, 949 million, the company market cap is approximately $100 million. The company is, at best, worth $30 million in SOL (which is less than $30 million today). Short the hell out of it down to $0.03 or below. Can't lose.

EUR/JPY looking for support on 174.5 - Learning purpose.The graph failed to brake the 176.35 and it looks like it will need to gather some strength around 175 range. From there we will probably see another attempt to take the 177 range.
The news can change the plan quickly.
If I missed something let me know.

EURUSD Sell Setup | HTF OB + Asia Liquidity Grab📉 On EURUSD, the overall market structure remains bearish — price has been consistently forming lower highs and lower lows, clearly showing that sellers are still in control on the higher timeframe.
Currently, the market is just in a corrective phase, retracing upward after a strong impulsive drop. This correction aligns perfectly with a Higher-Timeframe Order Block (HTF OB), which sits just above the Asian session liquidity.
💧 Liquidity Context:
During the Asian session, liquidity built up above recent minor highs.
Now, the market has swept that liquidity, tapping into the area where institutional orders are likely resting (HTF OB).
This combination of liquidity grab + OB retest gives a strong bearish confluence for a potential sell-side continuation.
💡 Setup Plan:
1️⃣ Let the market fully take out the Asian session liquidity above the recent high.
2️⃣ Once liquidity is taken and price taps into the HTF OB, shift focus to LTF confirmation zones (1M–5M).
3️⃣ Watch for clear bearish confirmation such as:
Minor CHOCH or MSS,
Strong bearish engulfing candle,
Formation of lower highs & lower lows on LTF.
4️⃣ After confirmation → plan for sell entries following the dominant bearish flow.
5️⃣ No confirmation = no trade ❌ — stay patient and disciplined.
🎯 Target:
The next swing low or liquidity pool below recent lows — depending on intraday momentum and volatility.
🧩 Setup Summary:
Market Bias → Bearish
Confluence → HTF OB + Asia Session Liquidity Grab
Entry → Only after strong LTF confirmation
Target → Next Swing Low / Liquidity Pool
Type → Scalp to Intraday Sell Setup
Risk Rule → Confirmation-based entry only
⚠️ Disclaimer:
This is my personal analysis and not financial advice.
Always trade according to your own plan, and manage your risk wisely.

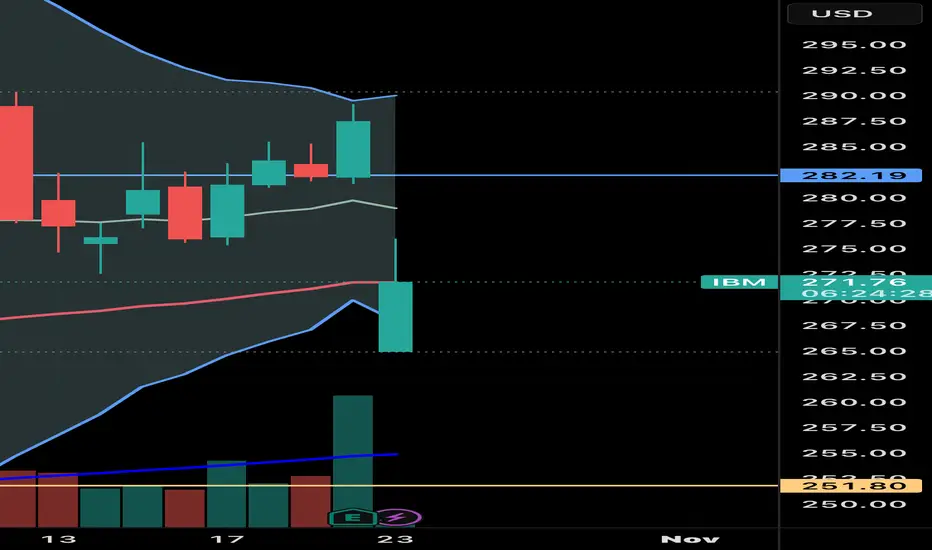
Premarket activity is a sign of manipulation So, I have done my research to pick the right moment to enter a trade, studies the market and earnings. Everything went well. The stock gone up for @IBM after the announcement. I am waiting to get some return on my money spent on this stock as a trader.
But then comes the premarket activity.
The stock has gone down premarket, from $287 to $262.
Made me lose trust in this US stock market as a whole.
What a stupid example of manipulation and corruption. Favouring some people or organisations (legally with rules, but still favouring) over the rest of individuals.
What is the difference between USA and China ?
All manipulating and corruption but in different methods. Each one seeing the other corrupt.
To me, both as rotten and corrupt as each other.
Gold market Daily demands through to 4157Gold market enters a reform phase, aligning with daily demand at 4157, suggesting potential bullish reaccumulation as price stabilizes within this key zone. yall note this zones
🔑 Key Zone: 4157 (Daily Demand)
📈 Bias: Bullish reform phase pending confirmation above intraday structure follow for more insights , comment and boost idea

Gold Defends the 4000 Zone Again — Eyes on 4160 Break for 4350 RGold Defends the 4000 Zone Again — Eyes on 4160 Break for 4350 Retest”
Yesterday, gold tested the 4000 price level for the second time and bounced back up, showing that the market is not ready to fall below that old psychological level.
Bullish optimism is rising again and the chances of gold rising further are also increasing.
The fact remains that the Gold continues to be manipulated, but this is the current market, take it or leave it. Since yesterday afternoon, gold has risen by almost 3.15% from 4010 to 4136.
If the price manages to break through 4160, then there is a good chance that it could retest the high near 4350 - 4380.
Overall, nothing has changed since yesterday. It's just that the market is hesitating to push the price up aggressively as before.
You may find more details in the chart!
Thank you and Good Luck!
❤️PS: Please support with a like or comment if you find this analysis useful for your trading day❤️

Bitcoin - Ultimate Swing Short As a compilation and summary of my previous ideas explaining in depth this signal - the why, when, how - here are the specific details for this swing short position.
Entry - 109,000 to 109,200
Stop Loss - 113,600
Target 1 - 97,600
Target 2 - 81,000
Target 3 - 63,400
Target 4 - 34,800
(Here is where I’ll potentially be signalling for a hedge long on Bitcoin from 34,700 to 80,000 - trading the retracement wave)
Target 5 - 20,000
Target 6 - 8,000
Ultimate wick bottom expected to be 7,200 to 7,800 range.
Good luck to all and any questions at all, please comment below.
I’ve linked any related ideas to this post here which you can view below.
- DD

BTC: Risk-off range below 110k, focus on 106.5k/105k/103k__________________________________________________________________________________
Market Overview
__________________________________________________________________________________
BTC is range‑bound with a cautious tilt: sellers cap 110k while 106.5k keeps holding. The 12H pressure remains down even as higher timeframes stay resilient.
Momentum: Range with a bearish tilt 📉 — multiple rejections below 110k and repeated defenses at 106.5k; 12H risk filter points Down.
Key levels:
• Resistances (HTF→Mid): 109,800–110,200 (supply), 111,500–112,000 (supply), 112,800–113,200 (HTF supply).
• Supports (HTF→Mid): 106,500–106,700 (pivot), 105,200–104,900 (6H floor ~105,013), 103,200–103,500 (2H/4H cluster + D pivot).
Volumes: Moderate on 30m–4H; no outsized catalyst.
Multi-timeframe signals: 12H/6H/4H/2H/1H trending down, 1D/1W up; below 110k, risk of 106.5k then 105k retests unless price reclaims 110.8k with volume.
Risk On / Risk Off Indicator: NEUTRAL SELL — confirms the cautious bias and the cap near 110k.
__________________________________________________________________________________
Trading Playbook
__________________________________________________________________________________
Strategic stance: range market with a risk‑off tilt; favor tactical fades at supply and only take defensive longs on validated floors.
Global bias: NEUTRAL SELL below 110k; main invalidation: daily close > 110,800 with volume and follow‑through.
Opportunities:
• Defensive long at 105,200–104,900 if wick + ≥2H reversal close; target 108k/110k.
• Secondary long at the 103,200–103,500 cluster on clean 2H/4H signal; add if 106,700 is reclaimed.
• Tactical short on rejection at 109,800–110,200 (or 111.5–112k) aligned with 12H Down; add on breakdown of 106,500 with volume.
Risk zones / invalidations:
• Sustained break < 106,500 invalidates an immediate bounce and opens 105k then 103k.
• Impulsive reclaim > 110,800 invalidates tactical shorts and unlocks 112–114k.
Macro catalysts (Twitter, Perplexity, news):
• Cautious liquidity into FOMC week; CPI eyed as a decisive catalyst.
• Soft 7‑day BTC spot ETF flows (risk‑off tone), making rallies fragile under 110–112k.
• Potential geopolitics/energy headline risk that can amplify moves at key levels.
Action plan:
• Long Plan (105k): Entry 105,200–104,900 / Stop ~104,500 / TP1 108,000, TP2 109,800–110,200, TP3 111,500–112,000 / R:R ≈ 1.8–2.5.
• Long Plan (103k): Entry 103,200–102,900 / Stop ~102,400 / TP1 106,700, TP2 108,000, TP3 109,800–110,200 / R:R ≈ 2.0–2.8.
• Short Plan (110k): Entry 109,800–110,200 / Stop 110,800 / TP1 108,200, TP2 106,700, TP3 105,200 / R:R ≈ 1.6–2.2.
__________________________________________________________________________________
Multi-Timeframe Insights
__________________________________________________________________________________
Intraday timeframes (≤12H) lean lower while 1D/1W remain resilient above key supports.
1D/1W (Up): Constructive structure, but 112.8–113.2 remains a HTF supply cap; bullish confirmation needs a reclaim >110.8k with volume.
12H/6H/4H/2H/1H/30m/15m (Down): Lower highs below 110k; 106.5k then 105k as key demand; breakdown of 106.5k risks acceleration.
Major confluences/divergences: Strong confluence around 103k (2H/4H cluster + D pivot ~103.5k) and a 6H floor near 105,013; the deeper 102k+ zone sits lower — high quality if reached.
__________________________________________________________________________________
Macro & On-Chain Drivers
__________________________________________________________________________________
Macro is in “wait‑and‑see” mode into FOMC/CPI and ETF flows stay soft, weighing on rallies under 110–112k.
Macro events: Markets cautious into FOMC and CPI; USD/liquidity guarded; geopolitics/energy risks can add volatility near key levels.
Bitcoin analysis: 7‑day negative BTC spot ETF flows (risk‑off backdrop); technical structure centered on 106.5k/105k/103k versus 110–112k supply.
On-chain data: Price below STH cost basis (~113.1k) and below the 0.85 quantile (~108.6k); elevated LTH distribution; put‑leaning options skew; higher IV — a defensive stance.
Expected impact: Technical NEUTRAL SELL bias intact; rallies likely faded unless volume improves and a >110.8k close confirms.
__________________________________________________________________________________
Key Takeaways
__________________________________________________________________________________
BTC remains range‑bound with a risk‑off tilt between 106.5k and 110k.
- Overall trend: short‑term neutral/bearish, HTF still constructive but capped by 110–112k supply.
- Most relevant setup: fade 109.8–110.2 or take defensive longs at 105k/103k only on ≥2H reversal signals.
- One key macro factor: FOMC/CPI week with soft ETF flows leaves rallies vulnerable without volume.
Stay disciplined: respect invalidations and wait for confirmation before leaning into a direction.
__________________________________________________________________________________

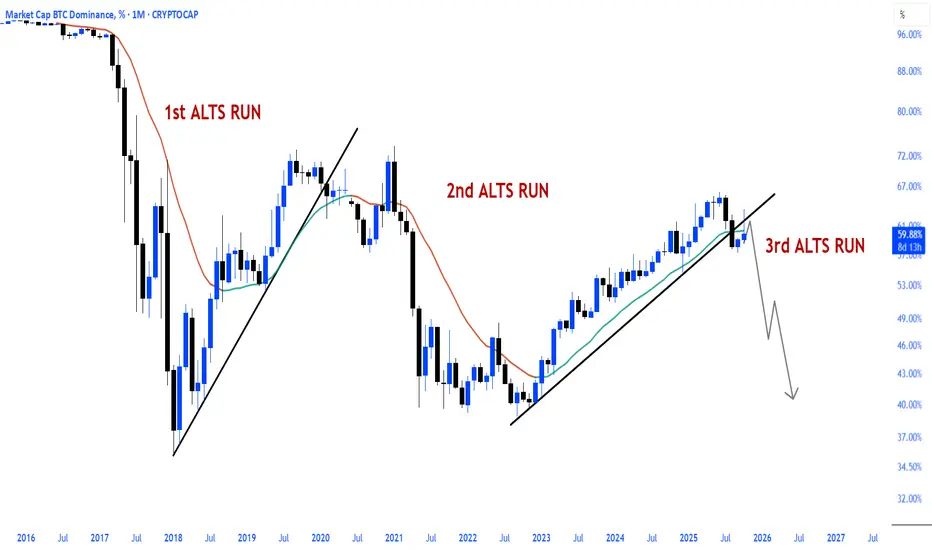
$BTC.D down $BTC up : ALTS run.CRYPTOCAP:BTC.D down CRYPTOCAP:BTC up : ALTS run.
Bitcoin dominance has broken down from its major uptrend and is currently in a retest.
It's important to remember that dominance alone isn't an altseason indicator; the key is for dominance to decline alongside Bitcoin's rise.
When this scenario plays out, a healthy altcoin season, as seen in the past, will resume.
So why did Altseason start in 2017 when BTC was falling?
1. Capital Rotation from Bitcoin to Altcoins
When Bitcoin approached $20,000 at the end of 2017, investors fell into the mindset that "BTC has risen too much, altcoins are cheaper."
Those who realized their profits sold Bitcoin and moved to altcoins.
So money didn't leave the market — it just changed direction within it.
That's why altcoins soared even as BTC fell.
2. New investor influx and FOMO
New investors entering crypto at that time turned to coins like Ethereum, Ripple, IOTA, ADA, and NEO, saying "Bitcoin is expensive."
New money flowed directly into altcoins.
So even as Bitcoin fell, the total market value continued to grow.
3. The historic collapse of dominance
BTC dominance fell from 65% in December 2017 to 35% in January 2018.
This was the sharpest "altcoin rotation" in history.
In short, everyone was "dumping their BTC profits into altcoins."
4. The ICO boom
Thousands of new projects were issuing ERC-20 tokens.
Demand for Ethereum skyrocketed because everyone was participating in ICOs with ETH.
This accelerated the shift from BTC to ETH and ignited the altcoin bull run.
5. Liquidity staying in the market
The stablecoin ecosystem was not yet developed (USDT was limited).
So when investors wanted to take profits, they were fleeing to altcoins instead of cashing out to fiat.
This caused altcoins to shine.
Is A Bullish Crossover Next For Solana Price?Solana’s price stands at $187 at the time of writing, holding firm above the $183 support level. The altcoin remains range-bound, struggling to break through the key $192 resistance. However, price stability above support suggests growing resilience in the face of selling pressure.
If Solana’s bullish indicators gain traction, the price could climb past $192 and target $200 or higher. Strengthening support levels combined with improving investor sentiment could help SOL establish a sustainable uptrend.
Conversely, if momentum fails to build, Solana may drop below $183 to test $175. A further decline could extend losses toward $163. This would effectively invalidating the bullish outlook and signaling continued market weakness.

COAI Price Rallies 96%— Yet Rug Pull Warnings Surface, Why?COAI’s 96% rally in a single day would normally be viewed as bullish momentum. Yet, in this case, the rapid climb may signal speculative excess rather than genuine growth. The speed of the rise is amplifying concerns about the sustainability of its valuation.
The concentration of supply and inflated demand indicate that COAI could face a steep correction. If selling pressure emerges, the price could drop from $16 to $5 almost instantly, erasing most of the recent gains.
Conversely, if the top wallets refrain from offloading their holdings, COAI could extend its rally beyond $21. Sustained confidence could even push the token toward its all-time high of $48, though the risk of collapse remains significant.

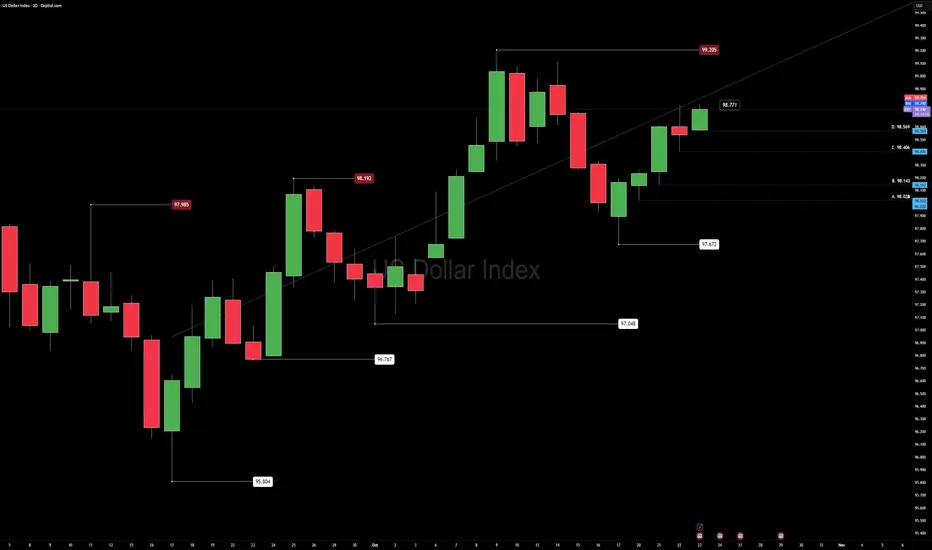
US DOLLAR AnalysisRespect the Higher Low: The Quiet Power of an Uptrend
U.S. Dollar Index (DXY) | 23 Oct 2025 | Pre–New York Session Outlook
By Daniel Fadeley
The U.S. Dollar continues to show a bullish bias, with higher lows forming consistently across both the weekly and daily structure. This ongoing strength keeps the broader tone positive for USD, while EURUSD and GBPUSD remain under cross-asset pressure.
We’re currently operating inside a bullish range with 97.672 as the range low and 99.205 as the range high.
Context
Momentum favors the dollar as buyers continue defending each pullback. If this month’s bullish structure holds, the market could confirm a longer-term upward phase.
However, conditions are slightly extended on Fibonacci sequence levels, suggesting reduced reward-to-risk for new swing positions until a clean retest offers better value.
Technical Map
Price took out yesterday’s high (98.771) and approaches the range ceiling at 99.205.
Volatility remains elevated through the week, and intraday momentum supports buy-the-dip behavior while daily lows continue to hold.
For cross-assets, this structure implies ongoing pressure on major USD pairs while the dollar holds above recent higher lows.
Fundamental Outlook
The week ahead features several key macro events:
U.S. GDP advance data
Core PCE inflation release
Multiple Federal Reserve speakers
Ongoing U.S. government funding discussions
Impact lens:
Yields rising → typically strengthens USD and tightens global liquidity.
Yields easing → can relieve pressure on risk assets such as equities and crypto.
Liquidity trends show ETF inflows slowing and capital rotating defensively, consistent with cautious macro positioning.
Plan
Current outlook remains bullish within range, focusing on position trades from defended lows and short-term rotational setups during volatility spikes.
Patience near 99.205 is key — a clean breakout with retest would confirm continuation; failure there could mean another controlled rotation inside the range.
Mindset
“Structure builds confidence. Clarity builds control.”
In fast markets, the goal is not prediction but preparation — follow structure, protect capital, and let confirmation lead conviction.
Educational use only — not financial advice.
Follow @CORE5DAN for calm, data-driven analysis and weekly structure lessons.
— CORE5DAN
Institutional Logic. Modern Technology. Real Freedom.
ALIBABA HIGH PROBABILITY SETUP SOON!!!🚨 BABA HIGH PROBABILITY BUY SETUP 🚨
* Here We Can See Clearly The Next Potential Moves For BABA Coming Hours/Days.
* Keep Your Eyes Close On Your Trading Positions.
* Happy PIP Hunting Traders.
FXKILLA.

NASDAQ100 HIGH PROBABILITY SETUPS SOON!!!🚨 NAS100 HIGH PROBABILITY BUY SETUP 🚨
* Here We Can See Clearly The Next Potential Moves For US100 Coming Hours/Days.
* Keep Your Eyes Close On Your Trading Positions.
* Happy PIP Hunting Traders.
FXKILLA.
