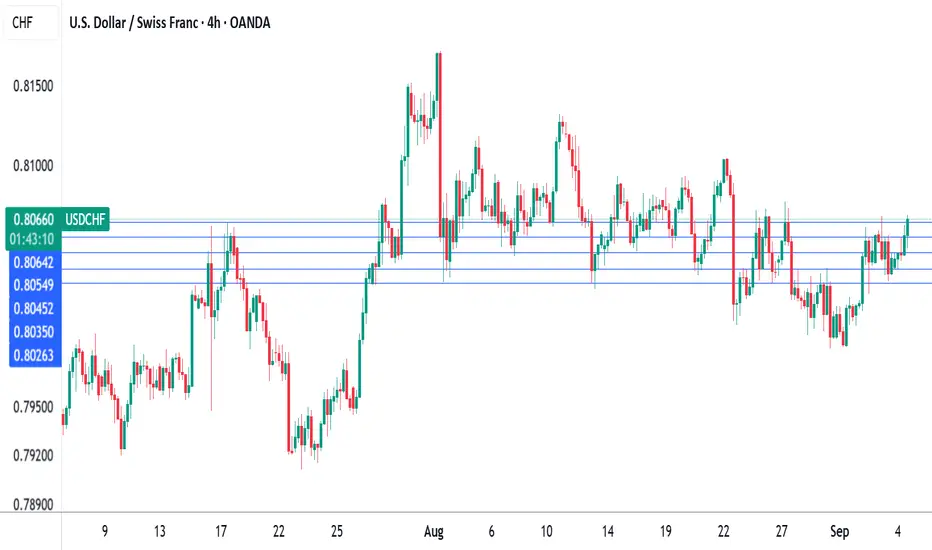
Swiss CPI declines, will SNB revert to negative rates?The Swiss franc has edged lower on Thursday. In the North American session, USD/CHF is trading at 0.8052, down 0.13% on the day.
Swiss inflation declined in August for the first time since January. CPI slipped 0.1%, following the July reading of zero and the market estimate of zero. Yearly, CPI rose 0.2%, unchanged from July and in line with the market estimate.
The soft inflation report could support the case for the Swiss National Bank to return to negative interest rates. The SNB had a negative rate policy in effect for eight consecutive years until 2022, when high inflation forced the bank to sharply tighten policy. The markets widely expect the SNB to hold rates at this month's meeting, but if inflation continues to sag, there will be pressure on the central bank to lower rates.
SNB President Martin Schlegel has stressed in the past that the central bank could revert back to negative rates if necessary but would try to avoid doing so since it causes difficulties for businesses and consumers.
The SNB is also keeping a close eye on the value of the Swiss franc. The Swiss currency has soared against the US dollar, gaining 11.3% since the start of the year. In June, USD/CHF fell below the psychologically significant 0.80 level for the first time 2011. The central bank does not want the franc to continue appreciating, since it means that Swiss exports are more expensive and thus less competitive.
US tariffs have dealt a blow to the export-reliant Swiss economy. Switzerland has had to absorb US tariffs of 39% on most goods, which has put the country at a serious disadvantage against the neighboring European Union, which faces tariffs of only 15% on most goods.
The USUSD/CHF is testing resistance at 0.8045. Next, there is resistance at 0.8054 and 0.8064.
0.8035 and 0.8026 are providing support
Inflation
Gold’s $200 Surge Defies the DollarOver the past week, gold prices exploded by more than $200 per ounce, shattering the $3,500/oz threshold to new all-time highs . Silver joined the surge, breaching $40/oz for the first time since 2011 . This explosive precious metals rally is striking not only for its magnitude, but because it occurred in tandem with a strengthening U.S. dollar – a sharp break from the usual inverse correlation between gold and the greenback. Typically, “gold’s appeal reflects an inverse relationship with the dollar’s value”, as one analyst noted , and gold soars when the dollar slumps. Yet this time, the U.S. Dollar Index held firm (even rising against some currencies), so gold’s ascent “alongside the value of the US dollar” appears anomalous .
This disconnect has confounded the simplistic media narrative that tried to pin gold’s move on U.S. political drama – namely turmoil surrounding Donald Trump pressuring the Federal Reserve. Indeed, mainstream headlines have leaned on that explanation: “Gold surges after Trump’s Fed pressure,” blared the Financial Times, after President Trump’s attempted (and unprecedented) firing of Fed Governor Lisa Cook raised alarms about Fed independence . Bloomberg News similarly attributed gold’s spike to “rate-cut bets” spurred by Trump’s actions . There is some truth here – investors clearly sought safety amid U.S. political uncertainty, with the largest gold ETF (SPDR Gold Shares, ticker GLD) hauling in over $2.3 billion of inflows last week to top all ETFs, “as gold prices flirted with record highs near $3,500” following Trump’s attempt to oust a Fed official . Concerns over Fed independence and Washington turmoil did fuel safe-haven demand . But a closer investigation of market data and cross-asset flows reveals a more complex story than “Trump made gold jump.” In particular, the simultaneous rise of gold and the dollar hints at other forces at play – potentially global capital rotations and eurozone undercurrents – that the simplistic narrative overlooks.
Order Flow: U.S. Buying vs. Asian Selling
One immediate clue lies in where the strongest gold buying originated. Market internals and order flow patterns suggest that North American investors led this rally, while Asian and European participants were net sellers or laggards. Gold’s intraday price action repeatedly showed dips during Asia and London trading hours, followed by robust gains during U.S. market hours – indicating steady accumulation out of New York overcoming profit-taking elsewhere. This aligns with recent flow trends: “Gold ETF buying has flipped from Asia to Western investment markets”, notes BullionVault, as China and India saw outflows while U.S. and European gold funds began expanding together . In the past fortnight, Asian-listed gold ETFs shrank by over 5 tonnes – the heaviest 2-week outflow since the Ukraine invasion – even as Western funds saw their strongest stretch of inflows in over two years .
Physical gold selling in Asia corroborated this trend. As prices hit fresh highs above $3,000 and $3,500, Asian jewelry holders rushed to “cash in”. In India’s bazaars and Middle Eastern souks, retailers report a surge of people selling old jewelry and coins to lock in gains . “Customers raced to cash in their old gold,” Reuters noted, with scrap sales booming across India and the Middle East . This flood of recycled gold effectively made Asia a net supplier to the market during the rally, potentially “tempering gold’s rally” in those regions if it continues . In contrast, U.S. investors were voracious buyers: not only did American ETFs see big inflows, but U.S. futures markets showed relentless bids during New York trading sessions, driving price strength into each day’s close.
In sum, Western demand carried gold higher even as Eastern markets took profits. This East-to-West flow reversal suggests the price surge was not simply a global panic “bid” for gold, but rather a targeted rotation of capital – with U.S. and European buyers eagerly absorbing the supply coming out of Asia. Such a dynamic is important because it hints that new money (likely institutional and speculative) in the West was a key driver, rather than traditional physical demand from Asia (which actually softened amid the high prices).
Gold in USD vs. Gold in EUR: A Currency Disconnect
Another intriguing aspect of this rally is how differently it played out in U.S. dollars versus other currencies – particularly the euro. Gold’s price in USD hit record highs, but gold priced in euros (XAU/EUR) did not. In fact, at gold’s peak this week the euro-priced ounce “held beneath spring highs” even as the USD-priced ounce broke out . Gold in British pounds and Japanese yen did notch new records alongside USD gold , but the euro-denominated price lagged.
This discrepancy between XAU/USD and XAU/EUR is telling. Had the rally been driven purely by U.S.-centric fears (Trump/Fed turmoil) causing a weak dollar, we would expect the opposite – gold might jump in USD but soar even more in euros as the dollar falls. Instead, the dollar strengthened against the euro, and gold’s rise in USD terms outpaced its rise in EUR terms. One interpretation is that some of the buying came from investors shifting capital out of euro assets and into dollar-based gold, effectively boosting both gold and the dollar simultaneously. In other words, capital flight from euro-based holdings could be an underlying factor. If European investors (or global investors with euro exposure) moved funds into U.S. dollars or dollar-priced gold, that would drive the dollar higher at the same time as gold – precisely what we saw.
It’s notable that earlier in the year, gold in euros had spiked to record levels (during a bout of euro weakness and regional banking worries), whereas U.S. gold lagged at that time. Now the roles reversed: “the dollar price topped its previous high, but the euro price of gold stayed below its spring peak” . This reversal suggests the latest rally was U.S.-led, not euro-led. Rather than a panic specifically within Europe, this feels like a more subtle rotation away from the euro toward “safe” currencies and assets. The euro’s exchange rate was relatively firm during this gold spike (indeed, gold’s jump was despite a firm dollar, not because of a weak one), implying the move wasn’t about a collapsing euro – it was about proactive reallocation. In essence, global investors may be quietly diversifying out of euros into gold (and dollars) as insurance against potential eurozone troubles down the line.
Speculators Pile In: CFTC Data Shows Growing Longs
Fueling gold’s ascent has been a wave of speculative positioning in the futures market. The Commodity Futures Trading Commission (CFTC) Commitments of Traders (COT) report reveals that hedge funds and money managers have been steadily adding to bullish gold bets. In fact, bullish bets are at their highest levels in years. As one market analysis noted, “the net long position of Managed Money traders rising… back to 4-year high… reaching 155% of long-term average” . This means speculators hold vastly more long contracts than usual, a clear sign of momentum-chasing and confidence in further upside.
Recent data confirms the build-up: speculators’ net-long gold positions jumped to around 237,000 contracts in mid-August (versus ~178,000 in early 2024) and remain elevated . For context, that mid-August figure was the largest net long in at least four years. Even trend-following funds that had been absent are now “firing on all cylinders,” adding to length as gold broke out. Importantly, while these speculative inflows are large, some analysts point out they are “relatively modest… given the move in gold prices – suggesting there is further upside to come” if more investors pile in . In other words, positioning is bullish but not yet at extreme record levels in proportion to gold’s price move, leaving room for additional buyers.
This surge in paper gold interest highlights that the rally has a strong “hot money” component. It’s not just passive safe-haven holding; fast-moving traders are actively driving the market higher. The rising COT longs also underscore why gold’s jump defied the dollar: in a typical risk-off scenario, one might see short covering or flight from other assets incidentally lift gold, but here we have an affirmative speculative buildup anticipating higher gold ahead.
Massive ETF Inflows: GLD and Silver ETFs See Big Demand
Alongside futures activity, investment flows into gold and silver exchange-traded funds (ETFs) have been massive, indicating broad-based demand from institutions and retail investors alike. The flagship gold ETF, GLD, saw particularly eye-popping inflows. In the week of the surge, GLD attracted roughly $2.3 billion of new money, making it “the No.1 asset gatherer among U.S.-listed ETFs” . To put that in perspective, GLD outdrew even the largest stock index funds for the week – a remarkable rotation of capital into precious metals.
These inflows pushed GLD’s total assets to new heights, as investors sought the convenience of paper gold exposure during the rally. Other precious metals funds saw similar interest: iShares’ silver trust (SLV) reportedly logged sizable inflows as silver prices jumped in unison with gold. Silver’s rally – over 10% in a week to above $40/oz – was the strongest in years, and analysts noted that “momentum traders obviously also became involved” once silver broke technical levels . The U.S. government’s proposal last week to classify silver as a critical mineral (which could spur domestic stockpiling) “helped to fuel the surge through $40” , giving fundamental justification to silver’s move and further enticing ETF investors.
Taken together, the ETF data paints a picture of widespread investment allocation into precious metals. Gold-backed ETFs globally had already been seeing positive inflows in recent months – the World Gold Council reported that the first half of 2025 saw the largest H1 gold ETF inflows since 2020 – and this past week accelerated that trend. The demand was not confined to the U.S. either; European-listed gold funds also saw creations (with particularly strong buying in the UK, Switzerland, and Germany in recent months) . But the U.S. flows were dominant. North American funds accounted for the bulk of new gold ETF buying this quarter , reflecting that U.S. investors are driving this shift to hard assets.
Such massive ETF inflows, alongside record futures longs, indicate a broad conviction trade into gold and silver. Whether as an inflation hedge, a geopolitical hedge, or a play on future Fed easing, capital is pouring into these assets via easily accessible vehicles. GLD’s $2+ billion weekly haul underscores that this was not a niche move – it was front and center in capital markets.
Not a Typical “Risk-Off” – Stocks, Crypto and Bonds Stayed Resilient
Crucially, unlike many past gold spikes, this one did not coincide with a major selloff in other asset classes. In classic market panics, gold’s rise is often mirrored by tumbling equities, collapsing bond yields (as investors buy Treasuries), or even a rush out of speculative assets like cryptocurrencies. That didn’t really happen here – indicating this gold rally was driven by rotation of capital from cash or low-yield reserves, rather than forced liquidations elsewhere.
Consider the stock market: global equities barely blinked. The MSCI World Stock Index had just hit an all-time high in late August; it fell only about 1.5% from that peak during gold’s run-up . A 1.5% dip is trivial – essentially normal daily volatility – and U.S. indices similarly remained near record levels. There was no sense of an equity crash or widespread fear in stocks; in fact, some risk assets like small-cap stocks rose on hopes of Fed rate cuts. Crypto markets were also relatively stable. Bitcoin and other major cryptocurrencies held in their recent trading ranges with no signs of a flight-to-safety out of crypto. Unlike early 2020 (when Bitcoin plunged during a dash for cash), this time crypto was “largely unfazed”. If anything, crypto investors likely interpreted Fed dovishness as positive, which could have buoyed coins – but there was no mass exodus from crypto into gold.
Bonds told a more nuanced story. U.S. Treasuries did not rally alongside gold – in fact, long-term bond prices fell last week, sending yields higher . Typically, if there were a major fear-driven episode, one would expect Treasury yields to plunge (as bond prices rise on safe-haven buying). Instead, the 10-year and 30-year yields ticked up. Notably, gold and bonds moved in opposite directions: “the split between government debt and gold prices has been underway, with gold rising… while the value of longer-term Treasury bonds has halved over five years” . Part of last week’s bond weakness was due to fresh concerns about fiscal deficits and inflation – which ironically can boost gold. A fund manager at Newton noted that the bond market isn’t yet signaling long-term inflation, but “there is falling confidence that can continue indefinitely”, characterizing the situation as a “fiscal crisis, rather than an economic crisis” driving gold’s rise . In short, gold’s jump wasn’t the result of a panic-driven bond rally – if anything, it coincided with a bond selloff. That implies the money fueling gold had to come from elsewhere (cash, forex reserves, or rotation out of other holdings) rather than from investors dumping stocks and bonds in fear.
This cross-market resilience supports the idea that the gold/silver inflows were more of a strategic reallocation or hedge, not a reaction to an acute crash in other assets. As one analyst put it, “If you were a Martian observing this, gold and long-term bonds sending opposite signals is telling you there are concerns” below the surface – but it’s an unusual mix of signals. Investors didn’t run for the exits in equities or corporate bonds; instead, they appear to have drawn on sidelined cash or reallocated currency reserves to fund their gold purchases. This makes the episode more interesting: it hints at a rotation happening quietly, rather than an obvious crisis visible in all markets.
Beyond the Trades: Is Capital Fleeing the Eurozone?
These patterns – U.S.-led gold buying, euro underperformance, no broad risk asset selloff – point to a deeper macro narrative: a potential rotation of capital out of Europe’s financial system and into hard assets. Several data points and developments reinforce this interpretation:
Reserve Currency Shifts: In a striking milestone, gold has now surpassed the euro as the world’s second-largest reserve asset (behind only the U.S. dollar). An ECB report highlighted that for the first time ever, gold represents a larger share of global foreign exchange reserves (20%) than the euro (16%) . In other words, central banks collectively hold more value in gold than in euro-denominated assets. This reflects concerted gold accumulation (over 1,000 tonnes per year since 2022, more than double the prior decade’s average ) at the expense of fiat holdings. It’s effectively a rotation out of traditional currencies – notably the euro – and into bullion. Such a shift “is remarkable”, as one market veteran noted, and coincides with 95% of central banks stating they plan to increase gold reserves in the next year – the highest on record . This trend screams a subtle mistrust in the long-term stability of the euro and other fiat assets, and a desire for the safety of hard currency.
Eurozone Stress Signals: While the eurozone isn’t in open crisis, there are hints of structural stress that may be nudging smart money to preemptively seek safety. Political instability is one concern – for example, in France (the Eurozone’s second-largest economy), the government is teetering on the edge of collapse amid budget battles. Even ECB President Christine Lagarde cautioned that “any risk of a government falling in the euro zone a concern”, after French markets wobbled on snap election fears . Such political tremors feed into a narrative of euro-area fragility. Meanwhile, European banks and governments are grappling with high debt loads and thin margins. As interest rates rose this year, sovereign and corporate borrowing costs in Europe jumped, exposing vulnerabilities in heavily indebted nations. Observers have warned of “debt saturation” and precarious leverage in Europe’s financial system (some even pointing to bloated gold derivatives positions at European banks as a risk) . If investors – or other central banks – perceive even a small chance of a Eurozone financial accident (be it a debt crisis, a bank failure, or political rupture), they may quietly trim exposure now.
Geopolitical Fragmentation and Inflation Hedging: Beyond Europe-specific issues, the broader macro backdrop is one of fracturing globalization and lingering inflation – conditions under which hard assets historically thrive. Under President Trump, the U.S. has upended elements of the post-WWII order, from trade alliances to security commitments . Trade wars and tariffs are forcing reallocations of supply chains and reserves. According to Reuters, Trump’s aggressive policies and sanctions have “upended Western security policy” and contributed to an environment where diversifying away from reliance on any single currency (especially the U.S. dollar) becomes prudent . Many developing countries have responded by boosting gold holdings as a hedge against geopolitical risks and potential sanctions (a lesson learned after Russia’s USD reserves were frozen in 2022) . This “de-dollarization” impulse, interestingly, often doesn’t benefit the euro – it benefits gold. Nations looking to reduce dollar dependence aren’t rushing into euros; they’re buying bullion (and to some extent, yuan) . This adds to global gold demand independent of day-to-day traders.
At the same time, inflation remains a concern. Though off its peak, inflation in both the U.S. and Europe has been stubbornly above central bank targets, eroding trust in fiat purchasing power. Gold is the classic inflation hedge, and its appeal grows when investors worry that “there are concerns… the right tail of inflation risk” in the future . Notably, this gold rally occurred even as inflation expectations in bond markets remained relatively contained – suggesting some investors aren’t waiting for official signals; they are positioning early against the possibility of inflation or currency debasement down the road. The fact that inflation-linked bonds have not rallied (underperforming regular bonds) implies the bond market isn’t convinced inflation will run away . But gold’s surge could be seen as a belts-and-suspenders approach – insurance in case the bond market is wrong or central banks falter.
Hard Asset Accumulation by Private Wealth: It’s not just central banks. Wealthy individuals and institutions are also shifting into tangible assets. Anecdotally, vault operators report high demand for physical gold storage. Real assets from commodities to real estate are getting increased allocation in portfolios as a hedge against both inflation and geopolitical strife. Silver’s inclusion on a U.S. critical minerals list last week (to secure supply chains) is emblematic of the new era of resource nationalism and strategic stockpiling . Gold and silver stand to benefit as strategic assets in a fragmenting world. The rally in both metals might be an early sign of investors preferring the certainty of hard assets in hand over promises on paper.
All these factors converge to a clear insight: the gold and silver surge may be an early warning signal of capital seeking safety from systemic risks – particularly those emanating from currency systems and financial institutions. Unlike a sudden crisis that causes a panicked stampede, this feels more like a strategic redeployment of capital: a rotation before the full storm hits.
Conclusion: A Canary in the Coal Mine?
Gold’s extraordinary run this past week – soaring in concert with a firm dollar, absent a stock market crash – is not just a one-off curiosity. It appears to be a manifestation of deeper shifts in investor behavior and economic regime. The simple story of “Fed drama and political turmoil” belies the larger context: we are likely witnessing a rotation toward safety and solidity in anticipation of future turbulence. Whether that turbulence comes from Europe’s financial system, unsustainable government debts, or a fracturing global order, investors are hedging their bets.
Precious metals are, in effect, serving as a barometer of macro stress and a receptacle for capital seeking refuge. As the European Central Bank’s own analysis noted, “gold generally offers a safe haven in times of stress… in extreme cases, gold prices tend to rise alongside the US dollar, while stock and bond prices decline” . That’s essentially what we’ve just observed – minus the sharp stock decline (at least so far). It puts policymakers on notice: something is bubbling beneath the surface. The last time we saw gold and the dollar rising together was during episodes like the onset of COVID-19 and the 9/11 attacks – clear crises. This time, the “crisis” is more subtle: a slow burn of fiscal strains, geopolitical realignments, and creeping distrust in institutions.
For investors and professionals, the takeaways are clear. Diversification into hard assets is gaining momentum, and not without reason. Gold’s role as a portfolio stabilizer is reasserting itself; even at record nominal prices, it’s attracting huge inflows as a form of insurance. The traditional inverse relationship with the dollar is not sacrosanct – when confidence in both major fiat blocs (dollars and euros) is tested, gold can rise against all currencies at once. Silver’s concurrent jump and its industrial strategic importance highlight that this is a broader precious metals renaissance.
Finally, it’s worth pondering the source of the $200 gold move. The evidence suggests it came not from panic, but from prudence – a reallocation from the quiet corners of cash and currency reserves into the safety of bullion. If that is the case, this gold surge could very well be the early tremor before larger quakes. Investors are effectively voting with their wallets, and their message is a cautious one: prepare for potential storms by holding real assets. Gold’s unusual rally, defying the dollar gravity, might be the canary in the coal mine for broader shifts to come – from an era of easy money and faith in central banks to one where tangible value and trust (or the lack thereof) drive decisions. As always, gold is both a barometer and a beneficiary of such paradigm shifts.
Sources:
Reuters – “Gold hits a record $3,532…main drivers fueled by U.S. President Trump’s upending of policy and Fed independence concerns.”
ETF.com – “GLD led all ETFs last week, hauling in $2.3B as gold flirted with $3,500.”
Reuters – “Gold tops $3,500… FT: ‘Gold surges after Trump’s Fed pressure’… Bloomberg: ‘Record high as rate-cut bets fuel demand.’”
BullionVault – Order flow: “Asian gold ETFs shrank…while European and North American products have now expanded together in 7 of the past 8 weeks, the strongest stretch in 27 months.”
Reuters – Physical market: “As gold prices jump… customers race to cash in old jewellery… If the rush to sell continues, could temper gold’s rally.”
BullionVault – “Dollar gold hit new highs…but Euro and Yuan price of gold held beneath spring highs”
BullionVault – COT data: “Net long position of Managed Money traders 4-year high…155% of long-term average.”
Reuters – “Silver breached $40, highest since 2011… momentum traders involved after US proposal to label silver a critical mineral helped fuel the surge.”
BullionVault – “Western stock markets dropped only 1.5% from last week’s record… long-term gov’t debt fell, driving yields higher, even as gold rose.”
ECB Financial Stability Review (via Frank Holmes) – “Gold now represents 20% of global FX reserves vs 16% for the euro – first time gold’s share exceeds euro’s.”
Reuters – Christine Lagarde: “France is solid but any risk of a government falling in the euro zone is a concern.”
Reuters – “Annual central bank gold purchases have exceeded 1,000 tons since 2022, double the 2010s average”
World Gold Council – “Gold ETFs saw 397t inflows Jan-June 2025, the largest first-half inflow since 2020.”
ECB Research – “In extreme cases (9/11, pandemic onset), gold prices tend to rise alongside the US dollar while stock and bond prices decline markedly – confirming gold’s safe-haven role in times of stress.”
- Gold trades near record highs on US rate cut bets; silver at 14-year high | Reuters
- Gold Surpasses Euro as the Second-Largest Reserve Currency in the World
- What does the record price of gold tell us about risk perceptions in financial markets?
- Gold Tops $3500 Record Price | Gold News
- Gold ETF Inflows Lead $34.3B Surge Into U.S.-Listed ETFs
- Gold ETF Investing Flips from East to West | Gold News
- After the gold rush: Asian, Mid-East sellers flood jewellery market | Reuters
- Central bank demand propels safe-haven gold to record peak | Reuters
- Explainer: Gold's record-breaking rally: who's keeping it going? | Reuters
- Global flows stay hot | World Gold Council
- France's far-right RN says it is getting ready for potential snap elections | Reuters
- Eurozone Financial Crisis: Debt and Derivative Dangers

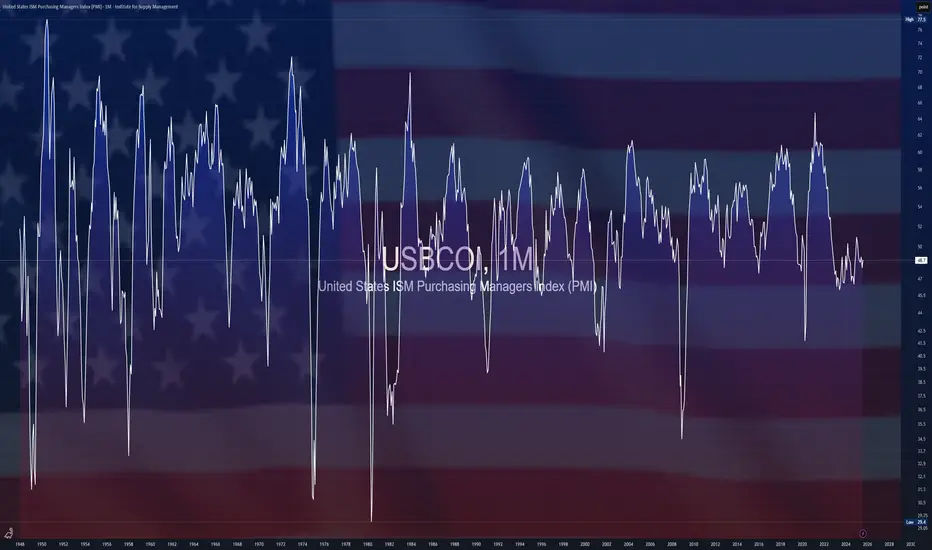
$USBCOIUS -Manufacturing PMI Misses Forecast (August/2025)ECONOMICS:USBCOI
August/2025
source: Institute for Supply Management
- The ISM US Manufacturing PMI increased to 48.7 in August from 48.0 in July,
though it fell short of market expectations of 49.0.
The index signaled a sixth straight month of contraction, as a sharp drop in production was only partly offset by a rebound in new orders.
Employment continued to fall, while input price inflation eased slightly.
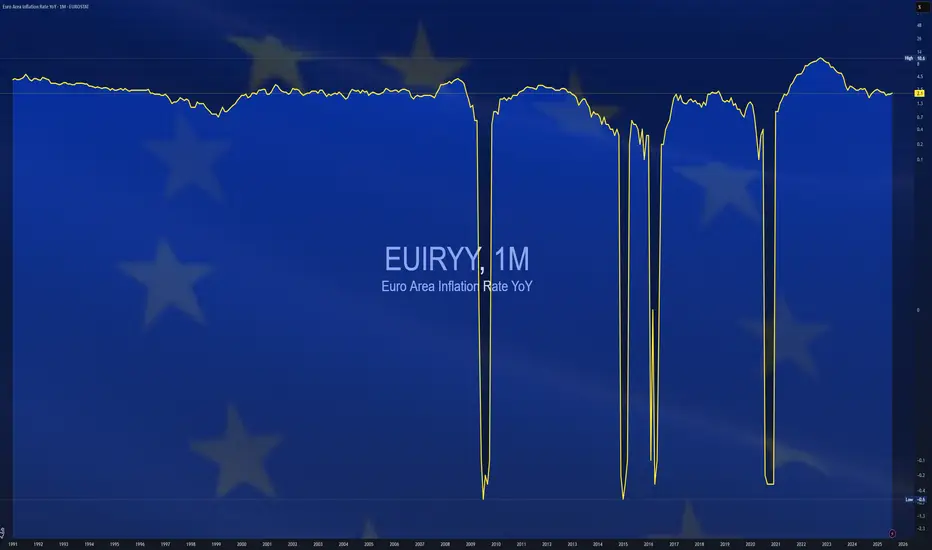
$EUIRYY -E.U CPI (August/2025)ECONOMICS:EUIRYY 2.1%
August/2025
source: EUROSTAT
- Euro area consumer price inflation rose to 2.1% in August 2025,
slightly above both July’s pace and market expectations of 2.0%, preliminary data showed.
Unprocessed food prices climbed 5.5% from 5.4% in July,
while energy costs fell 1.9%, a smaller decline than the previous month’s 2.4% drop. Services inflation eased to 3.1% from 3.2%, and prices for processed food, alcohol, and tobacco rose at a slightly slower pace of 2.6% versus 2.7%.
Non-energy industrial goods inflation held steady at 0.8%. Core inflation—which excludes energy, food, alcohol, and tobacco—remained unchanged at 2.3%, marking its lowest level since January 2022.
Euro CPI ticks higher, US ISM Mfg. PMI misses estimate, euro lowThe US dollar has posted sharp gains against most of the majors on Tuesday. In the North American session,EUR/USD is trading at 1.1672, down 0.33% on the day. The euro fell as smuch as 0.84% today but has recovered most of those losses after soft US manufacturing data.
Eurozone inflation ticked higher in August to 2.1% y/y, up from 2.0% in July. This was just above the market estimate of 2.0%. Services inflation, which has been sticky, eased to 3.1% from 3.2%.
Core CPI, which excludes energy and food, was unchanged at 2.3% y/y for a fourth consecutive time, above the market estimate of 2.2%. The core rate remained at its lowest level since October 2021.
The calm in inflation means that the European Central Bank is likely to continue to maintain its key deposit rate at 2.0% at the September 11 meeting. Still, the ECB has its doves who favor further rate cuts in order to kick-start the weak eurozone economy. As well, the Federal Reserve is widely expected to cut rates this month, which will put pressure on the ECB to also lower rates. The central bank has inflation under control but is also concerned about inflation undershooting the 2% target.
The US ISM Manufacturing PMI came in at 48.7 in August, up from 48.0 in July but below the market estimate of 49.0. Manufacturing has been in the doldrums, with six straight readings below 50, which indicates contraction. There was a rebound in new orders but production and employment showed declines.
The weak global economy and the impact of counter-tariffs on US goods continues to dampen manufacturing activity, with little indication that the situation will improve anytime soon.
EUR/USD has pushed below support at 1.1687 and is putting pressure on 1.1662. Next, there is support at 1.1638
There is resistance at 1.1711 and 1.1736

Bond yields are rocking to the upsideToday, bond yields are hitting the wires and causing a slight market sell-off. Fear is kicking in and investors are becoming even more cautious, as economic cracks start to appear.
Let's dig in.
TVC:US10Y
TVC:US30Y
TVC:JP30Y
TVC:GB30Y
TVC:EU30Y
Let us know what you think in the comments below.
Thank you.
75.2% of retail investor accounts lose money when trading CFDs with this provider. You should consider whether you understand how CFDs work and whether you can afford to take the high risk of losing your money. Past performance is not necessarily indicative of future results. The value of investments may fall as well as rise and the investor may not get back the amount initially invested. This content is not intended for nor applicable to residents of the UK. Cryptocurrency CFDs and spread bets are restricted in the UK for all retail clients.

BTCUSD Outlook – Monthly Open AheadTomorrow we get a new monthly candle on BTCUSD. Last month price didn’t trade higher after the rally in April, May, July and August. It’s sitting in a breather position. The dollar has been dumping too after a massive rally, so both markets are in reset mode.
Last month’s low is still intact, not traded through or attacked, which keeps that level important. For now we take it day by day — watching dollar data and order flow on Bitcoin to spot which side shows weakness first.
Big flush last week took BTC from 117K to 110K on whale selling and forced liquidations. That shows leverage risk is still high. But at the same time more than $400M flowed into spot ETFs, showing real demand under the surface.
If flows stay strong and the dollar keeps soft, BTC can bounce back toward the highs fast. If we see more liquidations or a dollar squeeze, then 105K–110K stays the key support zone.
We stay in eagle mode — patient, one day at a time, waiting for clean signals.

German inflation and US core PCE rise, euro edges lowerThe euro is slightly lower on Friday. In the North American session, EUR/USD is trading at 1.1657, down 0.21% on the day.
Germany has released the preliminary inflation report for July, with a hotter-than expected reading. Annually, EU-harmonised CPI rose to 2.1%, up from 1.8% in June and above the market estimate of 2.0%. The figure was the highest level since March, driven by higher food prices. Monthly, inflation eased to 0.1%, below the June reading of 0.4% and just above the market estimate of 0%.
Headline inflation in Germany, the eurozone's biggest economy, is largely in check but the battle against inflation is not over. Services inflation remained at 3.1% and core CPI was unchanged at 2.7%.
Policymakers at the European Central Bank won't be losing sleep over the slight gain in inflation. The eurozone releases July inflation next week, with CPI expected to nudge higher to 2.1% from 2.0% and core CPI to 2.4% from 2.3%. The ECB meets next on September 11 and is expected to maintain its key deposit rate at 2.0%.
The US wrapped up the week with the Core PCE index, the Federal Reserve's preferred gauge for underlying inflation. In July, core PCE rose by 2.9%, up from 2.8% in June and in line with the consensus. It was the highest level in five months and a reminder that although inflation is largely under control, the fight is not over. Monthly, core PCE was unchanged at 0.3%.
Fed Governor Christopher Waller, who is a candidate to replace Jerome Powell as Fed Chair next year, gave a hawkish speech on Thursday. Waller said he supported a rate cut in September and hinted at support for larger cuts if the labor market continued to soften.

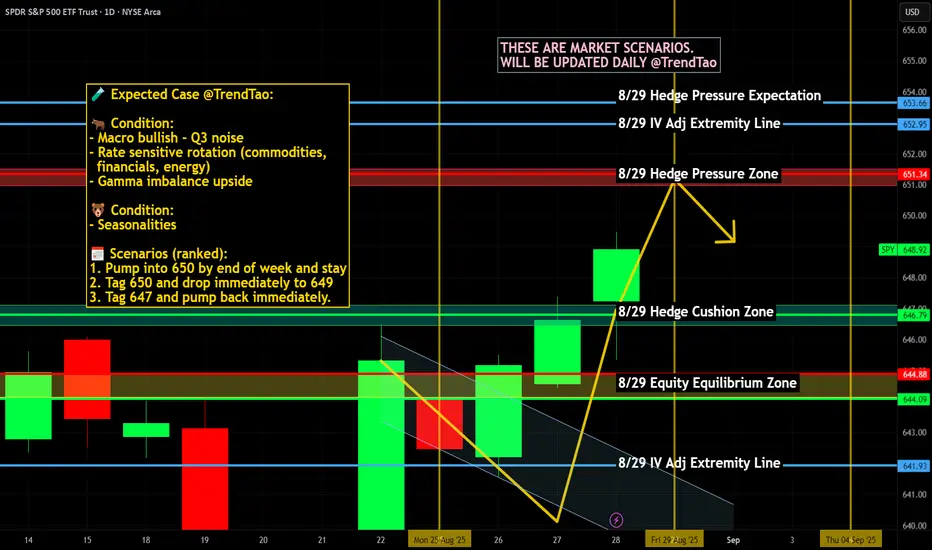
$SPY / $SPX Scenarios — Friday, Aug 29, 2025🔮 AMEX:SPY / SP:SPX Scenarios — Friday, Aug 29, 2025 🔮
🌍 Market-Moving Headlines
🔥 Fed’s favorite inflation gauge hits: PCE arrives just as markets digest Powell’s Jackson Hole tone.
💵 Consumer under the microscope: Spending & income data reveal demand strength heading into fall.
🏭 Regional PMI wrap: Chicago PMI closes out August with a manufacturing pulse check.
📊 Key Data & Events (ET)
⏰ 8:30 AM — PCE Price Index (Jul)
⏰ 8:30 AM — Personal Income & Outlays (Jul)
⏰ 9:45 AM — Chicago PMI (Aug)
⏰ 10:00 AM — UMich Consumer Sentiment (Final, Aug)
⚠️ Disclaimer: Educational/informational only — not financial advice.
📌 #trading #stockmarket #SPY #SPX #PCE #inflation #Fed #bonds #economy #PMI #consumerconfidence
How and why Silver May Overshoot Well Beyond 50 by 2026A description of silver price anomalies. Info is in video-only thing to add is we are going onour 6th consecutive year of silver structural demand deficits. The odds of a massive upside move intensify exponentially day to day at this point.
Do your own research

Euro gains ground, US GDP revised higher, German CPI nextThe euro has posted gains on Thursday. In the North America session, EUR/USD is trading at 1.1670, up 0.27% on the day.
US GDP (second-estimate) surprised on the upside, with a gain of 3.3%. This was revised higher from 3.0% in the preliminary estimate and was an impressive turnaround from the 0.5% decline in the first quarter.
After the release of the first-estimate GDP, President Trump called on Federal Reserve Chair Powell to lower interest rates, and it wouldn't be surprising if Trump again uses the strong GDP report to attack Powell.US GDP (second-estimate) surprised on the upside, with a gain of 3.3%. This was revised higher from 3.0% in the preliminary estimate and was an impressive turnaround from the 0.5% decline in the first quarter.
After the release of the first-estimate GDP, President Trump called on Federal Reserve Chair Powell to lower interest rates, and it wouldn't be surprising if Trump again uses the strong GDP report to attack Powell.
The US labor market has been softening and the July nonfarm payrolls fell to just 73 thousand. Still, unemployment claims have been steady and today's release showed that claims dropped to 229 thousand, down from a revised 234 thousand last week and just below the market estimate of 230 thousand.
Germany releases CPI report on Friday, with a market estimate of 0% m/m for August. This would mark the second flat reading in three months, an indication that inflation is under control. Annually, CPI is expected to nudge up to 2.1% from 2.0%.
Eurozone inflation will be released next week. Headline CPI is currently at 2.0% and core CPI is at 2.3%, with little change expected in the August release.
The European Central Bank took a pause in July after seven straight rate cuts. The ECB meets on September 11 and with inflation largely contained and around the ECB's 2% target, the Bank is not feeling pressure to continue lowering rates.

How to Manage Recession and Inflation?Can a recession and inflation coexist? We saw that in the 30s great depression and 70s great inflation.
Today's jobs numbers is trending lower, indicating a possible recession, while (3) inflation numbers are ticking up.
When these 2 conditions occur simultaneously, it is known as stagflation.
The 70s great inflation and today’s situation is very similar; we will study them. And discuss how to manage stagflation.
Micro Silver Futures
Ticker: SIL
Minimum fluctuation:
0.005 per troy ounce = $5.00
Disclaimer:
• What presented here is not a recommendation, please consult your licensed broker.
• Our mission is to create lateral thinking skills for every investor and trader, knowing when to take a calculated risk with market uncertainty and a bolder risk when opportunity arises.
CME Real-time Market Data help identify trading set-ups in real-time and express my market views. If you have futures in your trading portfolio, you can check out on CME Group data plans available that suit your trading needs www.tradingview.com

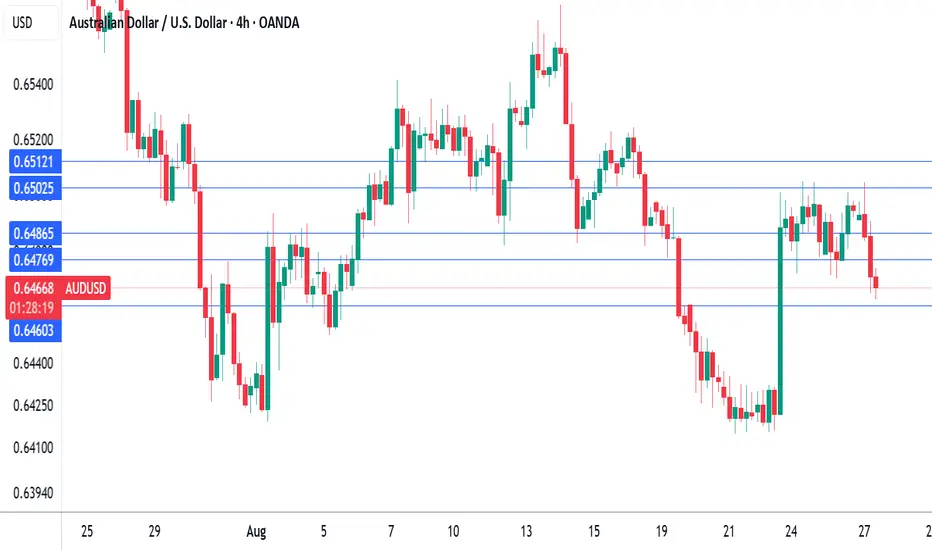
Australian CPI expected to jump, Aussie steadyThe Australian dollar is in negative territory on Wednesday. In the European session, AUD/IUSD is trading at 0.6468, down 0.40% on the day.
Australia's CPI for July surprised on the upside, jumping to 2.8% y/y. This followed a 1.9% gain in June and was above the market estimate of 2.3%. The spike in inflation, the highest level since July 2024, was driven by a sharp increase in electricity prices due to the end of government electricity rebates for many households. The trimmed mean, a key gauge of core CPI, rose to 2.7% in July from 2.1% in June.
The surprise jump in inflation has dampened expectations for a September rate cut. The money markets have reduced the probability of a rate cut to 22%, down from 30% before the inflation release.
Despite the hot inflation report, the Reserve Bank is expected to continue its easing cycle, with a 61% probability of a cut in November. The central bank remains very concerned about inflation but is also focused on employment, with the labor market showing signs of weakening.
The minutes of the RBA's August meeting said that upcoming rate decisions would depend on the data. The RBA meets next on September 19 and there are three key releases in September prior to the meeting - inflation, GDP and employment. The RBA has surprised the markets before and if these upcoming releases show a drop in economic activity or inflation, the RBA could respond with a rate cut next month.
The nasty feud between the Federal Reserve and Donald Trump has taken another twist, as the President said he had removed Fed Governor Lisa Cook due over charges that she made false statements on mortgage applications. The Fed says that Trump does not have authority to fire Cook. This latest spat further undermines the credibility of the US and could hurt the US dollar.
Australian CPI To Keep The RBA Cautious On RatesAustralia's monthly headline inflation metrics were all above expectations. While the basing effect and likely one-off electricity costs are a factor, it doesn't explain everything. I look at some of the CPI report's internals and outline what I think this means for AUD/USD.
Matt Simpson, Market Analyst at Forex.com and City Index

Australian CPI expected to jump, Aussie steadyThe Australian dollar is showing limited movement on Tuesday. In the European session, AUD/USD is trading at 0.6482, down 0.01% on the day.
The markets are bracing for an acceleration in Australian CPI on Wednesday. The market estimate stands at 2.3% y/y, compared to 1.9% on June which was the lowest level in over three years. The 1.9% gain was below the Reserve Bank of Australia's 2-3% target range and enabled the RBA to lower rates earlier this month.
If inflation does rise as expected, it would complicate the central bank's plans to continue lowering rates in order to boost economic growth. The RBA minutes from the August meeting noted that inflation remains a concern with risks to inflation in "both directions".
The minutes indicated that members were in agreement that further rate cuts were needed this year but were unclear as to the extent of the easing. Members said that a faster pace of cuts would be appropriate if the labor market softened more quickly than expected or if there were negative developments in the global economy.
The minutes said that upcoming rate decisions would be data-dependent. Investors will be keeping a close eye on employment and inflation data, which are the most critical factors for the central bank in determining its rate path.
The Federal Reserve is widely expected to lower rates at the September meeting, after holding rates since December 2024. Federal Chair Powell's speech at Jackson Hole essentially confirmed a September cut and the US dollar responded with sharp losses against the major currencies. The key question is whether the Fed will cut again in December - that decision will be heavily influenced by the employment and inflation reports.
There is resistance at 0.6524 and 0.6555
0.6469 and 0.6438 are providing support

NVDA Earnings, US GDP, US Core PCE - August Wrap-UpAs if Jackson Hole noise wasn't enough, sprinkle in some additional major news
for this week.
NVDA Earnings (After Close Wednesday)
US GDP (Thursday)
US Unemployment Claims (Thursday)
US PCE / US Core PCE (Friday)
NVDA at nearly 8% market cap for S&P can certainly move the market
Look at NVDA, MAGS, SPY, QQQ and they all look like 50/50 charts - price could
go either direction
NVDA expecting +/- 11.00 points on the week, average earnings move is around 12.66 points
I'm looking to fade any big gap on NVDA into September monthly and quarterly expirations with low risk options trades and I'm also deleveraging some of my naked puts and ratio spreads
to take profits and add more buying power for the end of year
I'll be watching - let's see how everything shakes out

Japanese inflation falls, yen extends lossesThe Japanese yen continues to lose ground on Friday. In the North American session, USD/JPY is trading at 148.68. Earlier, USD/JPY hit 148.77, its highest level since August 1.
Japan's core CPI, which excludes fresh food, dropped to 3.1% y/y in July, down from 3.3% and just above the market estimate of 3.0%. Headline CPI also declined to 3.1% from 3.3%, as rice inflation, which has skyrocketed, eased slightly.
Headline inflation has been above the Bank of Japan's 2% inflation target for 40 consecutive months but the central bank remains hesitant to raise rates, arguing that it needs more evidence that domestic demand and wages will keep underlying inflation sustainable at around 2%.
The BoJ meets next on September 19 and the markets widely expect another hold. The BoJ has a habit of catching the markets off guard and a rate hike is certainly a possibiity in September or October. The BoJ upgraded its inflation forecast for fiscal year 2025 at the July meeting from 2.2% to 2.7%, which supports the case for a rate hike in the coming months.
Central bankers are meeting up in Jackson Hole, Wyoming. The star of the show will be Federal Reserve Chair Powell, who will deliver a speech later today. The markets have priced in a rate cut at next month's Fed meeting and are hoping for some confirmation from Powell.
The Fed is caught between a rock and a hard place as it charts a rate path. Inflation is still high, which would support maintaining rates, but the labor market is deteriorating, which supports the case to lower rates and boost economic activity.
Should the Fed's primary focus be inflation or employment? There is a split among members, which was reflected in the rare split vote at the July meeting. The majority of the FOMC members, which voted to hold rates, judged the upside risk of inflation to be the primary concern, while the two members who voted to lower rates were most concerned about softening employment. The Fed meets next month and is widely expected to deliver its first rate cut since December 2024.

What Traders Should Expect from Powell’s Jackson Hole Speech?Today, all focus is on Powell’s Jackson Hole speech, where traders will look for hints about the future direction of monetary policy. The Jackson Hole Economic Policy Symposium has often marked major policy framework shifts and signals of immediate policy changes. Today it may be no different, with one key factor in the background: the heavy pressure on the independence of the Federal Reserve.
From the 2008 financial crisis to the Covid-19 shock, US core inflation remained subdued, well below the 2% target, despite ultra-low rates and massive quantitative easing. The average core PCE over this period was 1.52%, with only a few months above 2% in the entire 12-year span. With Covid, that low-inflation era came to an end. Supply chain bottlenecks, changes in consumer behavior, enormous government spending to counter the slowdown, labor market imbalances, energy shocks from the Ukraine–Russia war, and more QE all combined to create the biggest global inflation surge in decades for an average of 3.43% for US. In the US, the divergence was sharper due to much larger fiscal spending under both Trump and Biden. The economy recovered more quickly, but inflation proved stickier. As inflation falling towards 2%, tariff effects then stalled the disinflation process.
After Covid, the Federal Reserve changed its framework and introduced FAIT (Flexible Average Inflation Targeting). Under FAIT, the Fed no longer forced inflation back to 2% quickly but allowed overshooting to compensate for the 2008–2020 period of below-target inflation, giving more weight to fixing labor market problems. However, as seen in the data, the 3.43% average core inflation of the past five years risks unsettling long-term inflation expectations and increasing the chance that higher inflation becomes anchored.
What is Expected in Powell’s Jackson Hole Speech?
Powell has been working on policy framework changes for some time and looking at the last two years of Fed decisions, the central bank has already started to move away from FAIT. Today, Powell is expected to revert from FAIT back to the previous standard of flexible inflation targeting. This would signal greater emphasis on price stability, unless the labor market suffers a sharp downturn. Powell may also announce steps to improve transparency.
Markets might initially see this shift away from FAIT as hawkish, but in reality the Fed has already been moving in that direction for some time, at least in its decisions if not its language. Much of the market impact may already be priced in.
As for short-term policy, the September meeting will be crucial. Just days ago, markets were considering the possibility of a surprise 50-basis-point cut. After hot inflation data and strong PMI readings, even a 25-basis-point cut is priced at only 73%. If not for large payrolls revisions, the chance of a cut would be far lower, but the revisions have changed the outlook. Still, key data is due before September, including PCE, CPI, and the payrolls report. Powell may avoid giving a clear signal today and instead keep the option of a September cut open if conditions warrant.
How Might Markets React to Powell?
Reverting from FAIT is inherently hawkish, but markets may have priced in some of the effect already. Still, it remains broadly dollar-positive. The key will be how seriously Powell addresses weakness in the jobs market. If he does not see labor conditions as deteriorating meaningfully, the Fed has little reason to cut rates while both goods and services inflation are still picking up, even though shelter inflation is easing.
If markets interpret Powell’s view on jobs and the framework change as not hawkish enough, profit-taking among dollar bulls could emerge. However, if Powell signals that recent job weakness is just one or two data points and the Fed remains in a good place, the message would be that no urgent changes are needed and it will be dollar positive.

"Housing prices in Belgium never go down"In Belgium whenever you talk to people about investing, property is the first thing on everyones mind. People really feel that once you have a job the first thing you should be doing is buy some property because property values 'always go up'.
Now, I'm not here to tell you this is not true, or even that this is a bad investment decision. All I want to show that there's more nuance to this debate. So I made this chart which clearly shows that when denominated in gold (money that can't be printed and thus have its value inflated away) housing prices can definitely go down.
This chart shows:
yellow line: gold in euro's
red line: the Belgian Housing Price Index (euro's) +90%
purple line: the Belgian Housing Price index (in gold) -70%
The way people think about property in Belgium clearly shows that price-inflation is very much a phenomenon with a society-broad psychological impact. I am certainly not the biggest Keynes fan, but his quote seems quite relevant in the context of this chart:
"There is no subtler, no surer means of overturning the existing basis of society than to debauch the currency. The process engages all the hidden forces of economic law on the side of destruction, and does it in a manner which not one man in a million is able to diagnose."

$JPIRYY -Japan Inflation Hits 8-Month Low (July/2025)ECONOMICS:JPIRYY
July/2025
source: Ministry of Internal Affairs & Communications
- Japan’s annual inflation rate eased to 3.1% in July 2025 from 3.3% in June, the lowest since November 2024.
The moderation was driven by falling electricity prices and flat gas costs, which helped offset a faster rise in food prices, largely fueled by surging rice costs. Core inflation also stood at 3.1%, in line with the headline rate but slightly above market expectations of 3.0%.

Japan's inflation rate expected to ease, yen dipsThe Japanese yen is slightly lower on Thursday. In the European session, USD/JPY is trading at 147.87, up 0.39% on the day.
Japan releases the July inflation report on Friday. The markets will be especially interested in the core rate, which is expected to ease to 3.0% y/y, from 3.3% in June. Core CPI includes energy but excludes fresh food.
Core CPI has remained above the Bank of Japan's 2% target for over three years but the central bank has been slow to raise interest rates. BoJ Governor Ueda has said that the Bank will not raise rates until underlying inflation, which is generated by domestic demand and wages, is sustainably at 2%.
The BoJ raised rates to 0.5% in January but took its foot off the rate-hike pedal when Donald Trump became President and imposed a hard-hitting tariff policy which shook up the financial markets. Now that the US and Japan have reached a trade agreement and greatly reduced the uncertainty over tariffs, a major obstacle to raising rates has been removed.
The Federal Reserve released the minutes of the July meeting on Wednesday. The Fed's decision at the meeting to maintain rates was widely expected but the meeting made headlines when two FOMC members went against the majority and voted for a rate cut. This was the first time in over 30 years that more than one member voted against a rate decision.
The minutes reflected this dissension, noting the differing views on the Fed's dual mandate of inflation and employment. The economy faces an upside risk to inflation and a downside risk to employment, complicating rate decisions. At the meeting, the majority judged higher inflation as the greater risk while the minority believed that the deterioration in the labour market was the greater risk.
The Fed is widely expected to lower rates in September, after holding rates since December 2024.

Tariffs Effect on InflationIn April, inflation was at its lowest point. It was also the month when the 'Liberation Day' tariffs were introduced, applying a 10% baseline tariff to most countries.
But it wasn’t until August—when the July Core CPI rose to 3.1% from its April low of 2.8%— and now investors began to question whether inflation will be trending higher in the near future with now higher tariffs set in after 1st August.
10 Year Yield Futures
Ticker: 10Y
Minimum fluctuation:
0.001 Index points (1/10th basis point per annum) = $1.00
Disclaimer:
• What presented here is not a recommendation, please consult your licensed broker.
• Our mission is to create lateral thinking skills for every investor and trader, knowing when to take a calculated risk with market uncertainty and a bolder risk when opportunity arises.
CME Real-time Market Data help identify trading set-ups in real-time and express my market views. If you have futures in your trading portfolio, you can check out on CME Group data plans available that suit your trading needs www.tradingview.com

$GBIRYY - U.K Inflation Hits 18-Month High (July/2025)ECONOMICS:GBIRYY
July/2025
source: Office for National Statistics
- The UK’s annual inflation rate rose to 3.8% in July 2025 from 3.6% in June,
the highest since January 2024 and slightly above forecasts of 3.7%.
The uptick was led by higher transport costs linked to school summer holidays, with additional pressure from motor fuels, restaurants and hotels, and food and non-alcoholic beverages.
On a monthly basis, CPI rose 0.1%,
defying forecasts of a 0.1% decline but slowing from June’s 0.3% gain.
Core inflation inched up to 3.8% from 3.7%.
