Bitcoin WeeklyTarget is 54k
May reverse in the 54-64k zone to fill the gap left at 20k.
Bullish if we can break the double top formation,
Target is 80k-120k
Expected to hit 54k with in the next 6 weeks.
Keltnerchannel

Silver MonthlyTarget for the next several months is ~20 usd
The sooner we hit it, the sooner we can start another bullish leg.
Short Term Targets are bullish ~23 usd
Anything can happen in this market, as JPM, Deutsche, USB, HSBC have all been fined for spoofing or manipulating the silver market in the past 3-4 years.

XAUUSD Gold to 4KTimeline is 6 months - 2 years
The crash has already started. At some point everyone will start to sell thier treasury bonds, yields will go up proportionally to inflation until the dollar loses it's status as the global currency and dramatic measures are used to stop inflation resulting in stagflation and yield recovery. Else hyper inflation and the dollar is replaced entirely.
I see the momentum indicators shifting in various markets. Below is a brief summary of each, relevant indicators/markets. see charts.
US1YRBILLS
WTI CRUDE
SILVERUSD
BONKCOIN
TSLA

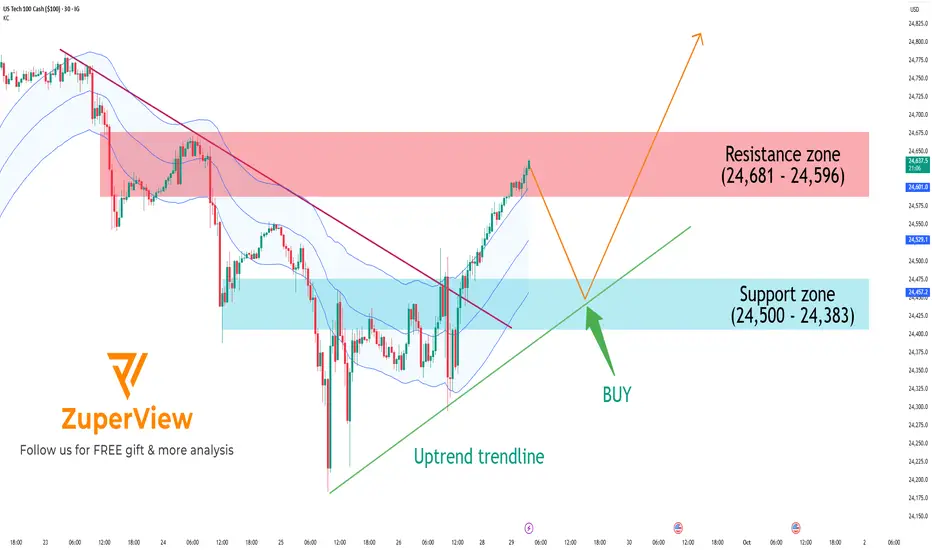
US100: Approaching resistance, pullback likely before breakoutThe IG:NASDAQ has shown a strong short-term recovery after breaking a major descending trendline. However, price is now testing a significant resistance zone, and a technical pullback is likely before the uptrend can continue.
📊 Technical Analysis: 30-minute Chart
📉 1. Overall Trend
Price has successfully broken above a descending trendline (red line), shifting market structure from bearish to bullish.
An uptrend line (green) is now acting as dynamic support.
Price is trading near the upper band of the Keltner Channel, indicating sustained bullish momentum.
🟥 2. Resistance Zone: 24,596 – 24,681
This zone has acted as a strong supply area in the past, causing multiple rejections.
Price is currently testing this area again → a rejection or short-term pullback is highly probable.
🟦 3. Support Zone: 24,383 – 24,500
This zone overlaps with previous consolidation and aligns with the uptrend line.
If a pullback occurs, this area could attract buyers and act as a launchpad for the next leg up.
🔁 Potential Trade Setups
✳️ Primary Scenario (preferred):
Price rejects at resistance → pulls back to support → bounces and resumes the uptrend
Wait for a pullback toward 24,500 – 24,383
Look for bullish price action (e.g., bullish engulfing, hammer) for entry
Enter long if support holds:
🎯 TP1: 24,650
🎯 TP2: 24,700+
🛑 SL: Below 24,350 (trendline invalidation)
🔻 Alternative Scenario (risk):
If price breaks below 24,383 and the uptrend line fails → short-term trend could shift sideways or bearish
Avoid long entries without a confirmed recovery
Re-evaluate trend structure if support fails
✅ Conclusion
A short-term uptrend is in place
However, price is now testing a major resistance zone, and a healthy pullback is likely
Please like and comment below to support our traders. Your reactions will motivate us to do more analysis in the future 🙏✨
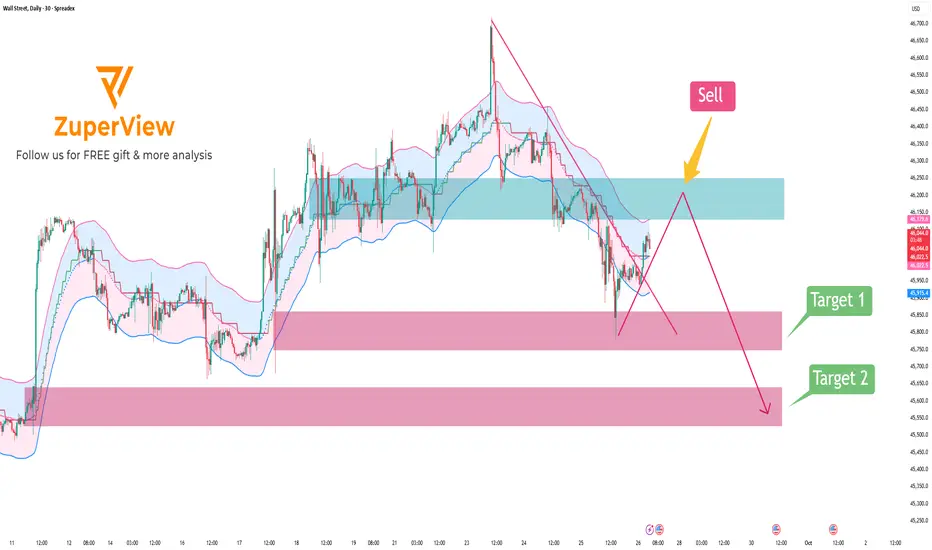
US30: Rebound to resistance & continue to break down
📝 1. Market Context
The SPREADEX:DJI dropped sharply from the recent high around 46,700 down to near 45,700, showing that sellers are currently in control in the short term. After this sharp decline, price is experiencing a mild recovery but still remains within a clearly defined downtrend channel and below key resistance.
🟥 2. Resistance Zone
The major resistance is located around 46,250 – 46,130 (highlighted in blue on the chart):
• This zone overlaps with the EMA and the upper band of the Keltner Channel.
• It was previously a sideways consolidation area that has now turned into resistance.
• It also intersects with the descending trendline, making a bearish rejection likely.
🟩 3. Support Zone
The nearest support lies at 45,858 – 45,748 (first pink zone).
If price breaks below this level, it is likely to continue falling toward the lower support zone at 45,520 – 45,640 (second pink zone).
🚨 4. Bearish Scenario
• Main scenario: Wait for a price pullback into the 46,250 – 46,130 area and watch for bearish signals → then SELL.
• Target: First target at 45,860 – 45,750 → if broken, expect further decline toward 45,520 – 45,640.
• Invalidation: A daily close above 46,250 would invalidate this bearish setup.
Please like and comment to support our traders. Your feedback motivates us to produce more analysis in the future 🙏✨
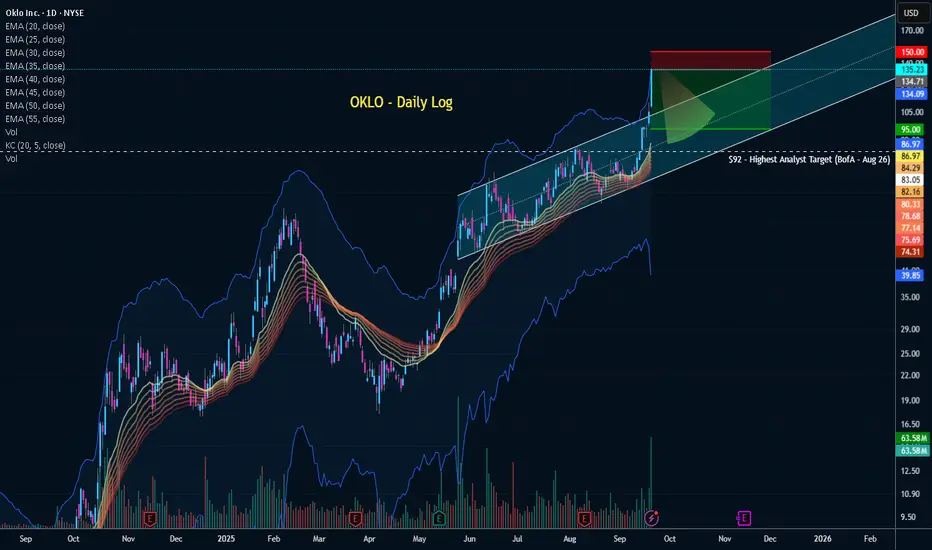
OKLO Mania - Time to fade?Why the recent parabolic move?... Friday US-UK nuclear energy deal called the Atlantic Partnership for Advanced Nuclear Energy. The deal is meant to speed up the use of next-generation nuclear technologies like OKLO.
I have nothing bad to say about the company. I recommended buying it earlier this year in March when it was trading in the $20-$30 range (see related publication).
These types of parabolic moves without meaningful fundamental improvement are not super rare, but the pendulum has swung pretty hard here and I think in the next 2 weeks we'll be at a lower price, perhaps still above $100. I don't think it will be necessary short selling but perhaps pull back from either another offering, insider trading, or locking in some profit at these levels.
Insider selling news:
www.barrons.com
Deep Dive Into Keltner Channel 🗓The Keltner Channel is a volatility-based technical indicator that helps traders identify market trends, breakout opportunities, and potential reversal zones. Built using an Exponential Moving Average (EMA) and the Average True Range (ATR), it adapts dynamically to price movement and provides a smoother alternative to Bollinger Bands.
📚 Introduction
The Keltner Channel is a versatile volatility-based trading indicator that helps traders identify trend direction, spot potential breakout opportunities, and determine overbought or oversold conditions.
Unlike Bollinger Bands, which use standard deviation, the Keltner Channel is built around the Average True Range (ATR), making it less reactive to sudden price spikes and better at adapting to steady market trends.
At its core, the channel consists of three lines:
Middle Line – an Exponential Moving Average (EMA) of the price
Upper Band – EMA plus a multiple of ATR
Lower Band – EMA minus the same multiple of ATR
When price stays close to the upper band, it indicates strong bullish momentum.
When price hugs the lower band, bearish pressure dominates.
Periods of narrow channel width often precede breakouts, while wide channels may signal trend exhaustion.
📚 Calculation
The Keltner Channel is typically calculated as follows:
Middle Line = EMA(n) , where n is the chosen period length (commonly 20)
Upper Band = EMA(n) + ATR(m) * Multiplier , where m is chosen period length for ATR
Lower Band = EMA(n) - ATR(m) * Multiplier , where m is chosen period length for ATR
EMA smooths price data while giving more weight to recent values. ATR measures volatility by accounting for true price ranges, including gaps. Multiplier (often 2) determines how far the bands are from the EMA.
📚 How to Use Keltner Channel in Trading Strategies
⚡️Keltner Channel Breakout Strategy
The Keltner Channel breakout strategy is built on the idea that the channel defines a normal range of price movement. The middle line reflects the average trend, while the upper and lower bands expand with volatility. Most of the time, price stays inside this range, so a close outside the channel signals unusual strength. A breakout above the upper band shows that buyers are strong enough to push price beyond what is typical, while a breakout below the lower band shows the same for sellers. This behavior suggests momentum is likely to continue, making it a potential point to join the trend.
Long Setup:
Price candle shall be closed above 200-period EMA
Candle closes above the Kelner's Upper Band, indicating strong bullish breakout
Put your trailing stop-loss at the Middle Band, close trade only when candle closes below it
Short Setup:
Price candle shall be closed below 200-period EMA
Candle closes below the Kelner's Lower Band, indicating strong bearish breakdown
Put your trailing stop-loss at the Middle Band, close trade only when candle closes above it
📈Long Trading Strategy Example
1. Price candle shall be closed above 200-period EMA. In our example we have BITMART:BTCUSDT.P 4h time frame.
2. Open long trade when price candle closed above the Keltner's Upper Band.
3. Close trade when price candle closes below the Middle Band
In our case we have 2:1 risk to reward trade if we compare initial stop loss and exit price.
📉Short trading strategy example
1. Price candle shall be closed below 200-period EMA. In our example we have BITMART:ETHUSDT.P 4h time frame.
2. Open short trade when price candle closed below the Ketlner's Lower Band.
3. Close trade when price candle closes above the Middle Band
In this case we have not a good trade. After closing short price continues dropping but then suddenly pumped and destroyed all gained profit. We think it's also important to show such trades it will make you more prepared for real market when you start trade using this strategy.
🧪 Important: as you could see stop-loss on the candle close above/below Middle Band can't be the best decision in every case. It will help you to avoid the false trade close, but usually significantly cut your profit. As always we highly recommend to make your out backtest using different trade exit approaches. You can try 3:1 RR or close exactly at the Middle Band and compare the results with provided close only approach.
⚡️Pullback to the Middle Line
The pullback-to-the-middle-line strategy focuses on the EMA at the center of the Keltner Channel, which acts as dynamic support in uptrends and resistance in downtrends. In trending markets, price often retraces to this middle line before continuing in the direction of the prevailing move.
When the EMA is sloping upward, traders look for buying opportunities when price returns to the middle line, expecting the trend to resume. In a downtrend, the EMA slopes downward, and touches of the middle line can be used as selling points.
Exits are usually made at the opposite channel band, since price tends to extend from the EMA toward one of the outer boundaries. This gives the setup a favorable risk-to-reward profile: stops are placed near the middle line or the most recent swing, while profit targets are naturally defined by the channel structure. The key is to apply the strategy only in clear, directional markets, as pullbacks lose reliability in sideways or choppy conditions.
Long Setup:
Middle Band's slope shall be upward indicating the short-term uptrend.
Open long trade when price pulled back to the Middle Band.
Put stop-loss below the Lower Band.
Take profit at the Upper Band.
Short Setup:
Middle Band's slope shall be downward indicating the short-term downtrend.
Open short trade when price pulled back to the Middle Band.
Put stop-loss above the Upper Band.
Take profit at the Lower Band.
📈Long Trading Strategy Example
1. Middle Band's slope shall be positive. We use BITMART:BTCUSDT.P 4h time frame.
2. Open long trade when the price pulled back to Middle Band.
3. Put initial stop loss at the Lower Band.
4. Take profit at the Upper Band.
📉Short trading strategy example
1. Middle Band's slope shall be negative. We use BITMART:BTCUSDT.P 4h time frame.
2. Open short trade when the price pulled back to Middle Band.
3. Put initial stop loss at the Upper Band.
4. Take profit at the Lower Band.
🧪 Important: this strategy provides high frequent fast trades with poor risk to reward. Typically it equals approximately 1:1, but this setup has the high probability to play out well. Moreover, this strategy can be used in conjunction with the strategy from point 1 described above. Conditions don't contradict to each other and can allow you to earn money on two different market conditions.
⚡️Mean Reversion Strategy
The mean reversion strategy with the Keltner Channel is based on the assumption that price tends to return toward its average after moving too far away. The outer bands of the channel serve as dynamic thresholds that help identify when the market is stretched.
When price closes near or beyond the upper band, it suggests temporary overextension to the upside, creating an opportunity to anticipate a move back toward the EMA. Conversely, when price touches or moves below the lower band, traders look for a rebound toward the middle line.
The trade idea is to enter counter to the extreme move, with exits placed around the central EMA. Stop losses are typically set just outside the channel to protect against strong breakouts. This approach works best in sideways or range-bound markets, where prices oscillate around a fair value, but it tends to underperform in strong trends.
Long Setup:
Price candle shall be closed above 200-period EMA.
Open long when price touches the Lower Band.
Put initial stop-loss according to your money management system.
Close trade the Upper Band.
Short Setup:
Price candle shall be closed below 200-period EMA.
Open short when price touches the Upper Band.
Put initial stop-loss according to your money management system.
Close trade the Lower Band.
📈Long Trading Strategy Example
1. Price candle shall be closed above 200-period EMA. In our example we have BITMART:BTCUSDT.P 4h time frame.
2. Open long at the Lower Band
3. Put stop-loss. In our case we use 2%, you can use stop-loss based on your asset/time frame volatility and money-management.
4. Take profit at the Upper Band.
📉Short trading strategy example
1. Price candle shall be closed below 200-period EMA. In our example we have BITMART:ETHUSDT.P 4h time frame.
2. Open short at the Upper Band
3. Put stop-loss. In our case we use 3%, you can use stop-loss based on your asset/time frame volatility and money-management.
4. Take profit at the Lower Band.
📚 Conclusion
The Keltner Channel is a versatile tool that adapts to different market conditions and trading styles. Whether applied as a breakout system to capture momentum, as a pullback framework to ride established trends, or as a mean reversion setup in ranging markets, it provides traders with a structured way to interpret price action. Like any strategy, its effectiveness depends on matching the approach to the prevailing market environment and applying consistent risk management. By understanding the underlying logic of each method and practicing disciplined execution, traders can make the Keltner Channel a valuable part of their technical toolkit.

NQ may have found a little Support to continue its climb.After a healthy, needed pull back, the NASDAQ may have found the support it needed to finish its climb with the inauguration soon to come at the end of the month. Price has not been comfortable below the middle Keltner channel band during this push-up over the last few weeks. The MACD and and RSI look prime for a turnover, and Fridays push-up off of Thursdays Liquidity sweep, sets us up nicely for a move up. At the very least, there's a good chance we test some of these levels for the upcoming week.

1-Minute Scalping Trading Strategies With Examples1-Minute Scalping Trading Strategies With Examples
Scalping is a popular trading style capitalising on rapid, small price movements within minutes. 1-minute scalping strategies are often used by traders but require precise execution and solid understanding of technical indicators. This article explores four 1-min scalping strategies, detailing the indicators used alongside specific entries and exits.
Understanding 1-Minute Scalping
1-minute scalping is a fast-paced trading style focusing on taking advantage of small price movements within a minute timeframe. Traders using this approach rely on 1-minute charts to make quick, multiple trades throughout the trading session. The primary goal is to accumulate potential small gains that might add up to larger returns over time.
A scalp trading strategy requires a solid understanding of technical analysis and market conditions. Scalpers typically use indicators, price action patterns, and trend analysis to identify short-term market movements and potential entry and exit points. The rapid nature of 1-minute scalping demands precision and discipline, as even a slight delay can impact the trade outcome.
One of the key advantages of 1-minute scalping is the ability to generate frequent trading opportunities, which can be particularly appealing during volatile market conditions. However, it also comes with higher risks due to the speed and frequency of trades, meaning risk management plays a significant role.
Scalpers must also be aware of transaction costs, as frequent trading can lead to significant fees, which can erode potential returns. Choosing a broker with low commissions, tight spreads, and fast execution speeds is essential to maximise a scalping forex strategy’s potential. FXOpen provides an ideal environment for scalping trading strategies, with commissions from $1.50 per lot, spreads from 0.0 pips, and ultra-fast execution. Open an account!
Four 1-Minute Scalping Strategies
Now, let’s take a closer look at four 1-minute trading strategies. To apply these strategies, see how they work in practice, and access each of these 1-minute scalping indicators, consider following along in FXOpen’s free TickTrader trading platform.
Strategy 1: VWAP + MACD
Indicators Used
- VWAP (Volume Weighted Average Price): VWAP calculates the average price a security has traded at throughout the day, based on both volume and price. It helps traders understand the trend and identify potential support and resistance levels.
- MACD (Moving Average Convergence Divergence): MACD is an indicator that visualises the relationship between two moving averages. MACD settings for a 1-minute chart are standard: the MACD line is derived from the difference between the 12-period and 26-period exponential moving averages (EMA), while the signal line is a 9-period EMA of the MACD line.
VWAP and MACD work well together by providing both trend and momentum analysis. VWAP helps identify the overall trend and significant price levels, while MACD offers insights into momentum changes. This combination can help traders determine entries by confirming trends and potential reversals.
Entry
- Traders typically look for the price to close through the VWAP, with the MACD turning from positive to negative or vice versa. This coincides with the signal line crossing over the MACD line.
- Alternatively, another common entry point is when the price uses the VWAP as a level of support or resistance, confirmed by the MACD turning from positive to negative or vice versa.
These triggers will likely occur within a few candles of each other, typically within 4 or 5 candles.
Stop Loss
- Stop losses are often set just beyond a recent high or low swing point, which helps potentially protect against losses if the market moves unexpectedly.
Take Profit
- Traders commonly take profits when the signal line crosses the MACD line in the opposite direction, and the histogram switches from positive to negative or vice versa. This approach allows traders to take advantage of momentum shifts and potentially lock in gains as the trend changes.
- However, some may prefer to exit at a significant support or resistance level in order to maximise potential gains.
Strategy 2: Keltner Channels + RSI
Indicators Used
- Keltner Channels: A volatility-based envelope set above and below an exponential moving average. The channels are typically set to two average true range (ATR) values away from the EMA. They help identify overbought and oversold conditions and potential breakouts.
- RSI (Relative Strength Index): A momentum oscillator that gauges the rate and extent of price changes. It ranges between 0 and 100, where readings above 70 signal overbought conditions, and readings below 30 indicate oversold conditions. RSI can also indicate bullishness when it crosses above 50 and vice versa.
The Keltner Channels and RSI strategy leverages volatility and momentum to identify effective trading opportunities. By combining the channels, which offer insights into breakouts, with the RSI, which gauges momentum, traders can uncover trading opportunities on the 1-minute chart.
Entry
- Traders often look for two or more closes outside of the Keltner Channel and ideally strong and/or consecutive green (bullish) or red (bearish) candles.
- This is confirmed by the RSI recently breaking above 50 for bullish signals or below 50 for bearish signals.
The combination of strong price action and momentum change helps traders identify potential trend continuations.
Stop Loss
- Stop losses are commonly set beyond the opposite side of the Keltner Channel to potentially protect against adverse price movements.
- For a higher risk-reward ratio, traders might place stop losses beyond a nearby swing candle.
Take Profit
- Traders typically take profits when the price crosses back beyond the Keltner Channel's midpoint or reaches the opposite side of the channel, indicating a potential exhaustion of the current move.
- Alternatively, profits may be taken when RSI moves beyond 70 (overbought) or below 30 (oversold), signalling potential reversals in price direction.
Strategy 3: ALMA + Stochastic
Indicators Used
- ALMA (Arnaud Legoux Moving Average): ALMA is a moving average that aims to smooth price data while reducing lag. The settings used are 21 for the window size, 0.85 for the offset, and 6 for the sigma. This combination helps in identifying the trend with greater precision.
- Stochastic Oscillator: The Stochastic measures the location of the close relative to the high-low range over a set period. Settings of 21, 1, 3 are used to capture momentum and potential reversal points. A figure above 80 signals overbought conditions, while below 20 indicates the opposite.
Combining ALMA with the Stochastic Oscillator allows traders to identify potential reversals in trends. ALMA provides a smoothed view of the price trend, while the Stochastic Oscillator offers momentum-based signals, helping to confirm the strength of a move.
Entry
- Traders look for the price to close through the ALMA, ideally with a strong close, which suggests a potential trend change.
- This is confirmed by the Stochastic Oscillator crossing below 80 for a bearish signal or above 20 for a bullish signal, indicating momentum alignment with the trend.
Note that price may fluctuate above and below the ALMA in ranging conditions and produce false signals.
Stop Loss
- Stop losses are typically set beyond the nearest swing point, which helps to potentially protect against adverse price movements.
Take Profit
- Traders typically take profits when the Stochastic reaches the opposite territory (e.g., from above 80 to below 20 for a bearish move), indicating a potential exhaustion of the current trend.
- Alternatively, profits may be taken at identified areas of support or resistance, where price action historically reacts, providing a logical exit point.
Strategy 4: RSI + Bollinger Bands
Indicators Used
- RSI (Relative Strength Index): For this strategy, RSI setting for a 1-minute chart is a length of 4, with overbought and oversold boundaries at 80 and 20, respectively. These RSI settings for the 1-minute chart help in identifying short-term overbought and oversold conditions.
- Bollinger Bands: Bollinger Bands settings for a 1-minute chart are a 20-period simple moving average (middle band) and two outer bands set at a standard deviation level of 2 from the middle band. They help identify periods of high and low volatility as well as potential reversal points.
The combination of RSI and Bollinger Bands allows traders to identify potential short-term reversals in the market. The Bollinger Bands provide a dynamic range for price action, while the RSI helps confirm overbought or oversold conditions, improving the accuracy of entry and exit points.
Entry
- Traders often enter when the RSI crosses below 80 from above or above 20 from below, signalling an exit from potential overbought or oversold conditions.
- This entry is confirmed when the price is also touching or breaching the Bollinger Band, indicating the likelihood of a short-term reversal.
Stop Loss
- Stop losses are typically set beyond a nearby swing point or just outside the Bollinger Band, providing potential protection against significant adverse price movements and giving the trade room to develop.
Take Profit
- Traders commonly take profits when the price touches the opposing Bollinger Band, suggesting a potential end to the current price move.
- Alternatively, some may take profits when the RSI crosses into the opposing overbought or oversold territory, indicating a shift in momentum.
The Bottom Line
Mastering a 1-minute scalping strategy can potentially enhance your trading performance. To take advantage of these techniques, consider opening an FXOpen account. As a regulated broker, FXOpen offers access to over 600 markets for scalping, supported by commissions as low as $1.50 and spreads from 0.0 pips. With the right tools and strategies, you can navigate today’s fast-paced trading environment effectively.
FAQ
What Is the 1-Minute Timeframe Trading Strategy?
The 1-minute timeframe trading strategy involves making multiple trades within a single minute, aiming to capture small price movements. Traders use a 1-min scalping strategy to identify quick trading opportunities and rely heavily on technical indicators for entry and exit points.
Which Indicator Is Best for 1-Minute Scalping?
There is no single best 1-minute scalping strategy indicator; it comes down to preference and experience. However, popular choices include the Moving Average Convergence Divergence (MACD), Relative Strength Index (RSI), Bollinger Bands, and the Volume Weighted Average Price (VWAP). Combining several indicators can potentially provide more reliable signals.
What Is the Best Timeframe for Scalping Crypto*?
The best timeframe for scalping crypto* depends on the trader's preference and strategy. While a 1-minute crypto* scalping strategy offers rapid trades and numerous opportunities, some traders prefer slightly longer frames like the 5-minute or 15-minute charts to balance speed and cryptocurrency* market noise.
What Is the Stochastic Setting for 1-Minute Scalping?
For 1-minute scalping, the Stochastic Oscillator is typically set to the standard settings of 14, 1, 3. These settings help capture short-term momentum changes, providing timely signals for entry and exit points. Adjustments can be made based on the trader's specific strategy and market conditions.
*At FXOpen UK, Cryptocurrency CFDs are only available for trading by those clients categorised as Professional clients under FCA Rules. They are not available for trading by Retail clients.
This article represents the opinion of the Companies operating under the FXOpen brand only. It is not to be construed as an offer, solicitation, or recommendation with respect to products and services provided by the Companies operating under the FXOpen brand, nor is it to be considered financial advice.

BTCUSD Daily Inflection Point
This is a continuation of the Weekly Inflection Point.
On the daily we're getting close to a crucial area. A downward move here may indicate a large move, correction on the weekly, daily. 16k could easily be hit. There is also the potential for this momentum consolidation to have a breakout leg to 77-88k before a final correction.
Watch for a break above or below the keltner channel. If the stock market is about to tank because WW3, the debt bubble created in 2008-2020, then Bitcoin will get shocked with it while everyone scrambles for PM's.
After maybe bitcoin will be revived when people realize there isn't enough PM's out there, else some world wide digital currency emerges.
Either way I have little hope for bitcoin, unless the NWO backs it because of the transparent transactions that can be traced, blacklisted, non fungible- control. Such a currency is a fools hope and will be used against you when tyranny seeks control over you.

NQ Power Range Report with FIB Ext - 8/29/2024 SessionCME_MINI:NQU2024
- PR High: 19264.75
- PR Low: 19140.25
- NZ Spread: 278.5
Key scheduled economic events
08:30 | Initial Jobless Claims
- GDP
Break and follow-through below 19600
- Finding inventory zone around 19200
Session Open Stats (As of 12:15 AM 8/29)
- Weekend Gap: N/A
- Session Gap 7/24: -0.32% (open > 19946)
- Gap 10/30/23 +0.47% (open < 14272)
- Session Open ATR: 388.21
- Volume: 37K
- Open Int: 238K
- Trend Grade: Bull
- From BA ATH: -8.0% (Rounded)
Key Levels (Rounded - Think of these as ranges)
- Long: 20954
- Mid: 19814
- Short: 17533
Keep in mind this is not speculation or a prediction. Only a report of the Power Range with Fib extensions for target hunting. Do your DD! You determine your risk tolerance. You are fully capable of making your own decisions.
BA: Back Adjusted
BuZ/BeZ: Bull Zone / Bear Zone
NZ: Neutral Zone

BTCUSD Weekly Inflection pointWhat I have here are a bunch of momentum channels piled on each other on the keltner channel oscillator. (weekly light blue, daily green, 3hr light purple) I didn't bother hiding lines from the diff time frames, which helps put into perspective each zone in accordance to the keltner channel TF price is in. IE on the weekly we're above the KC Mid Line. Same with each TF all the way to the 1 Hour where we're consolidating. A shift on the 1 hour makes for a potential shift on the 3 hour, and judging by our position in the relative channels on the various time frames I expect consolidation on the 3 hour with the potential to consolidate on the daily and weekly.
This is what I call an inflection point.
Weekly:
Daily:
3 Hour:
Here is a previous chart with a daily inflection point:
Which direction it goes on the inflection point is a guess, unless watching every timeframe to see the inflection points on the lower TF's develope in real time. Momentum shifts mark a point where momentum consolidates; from which it could break out or break down.
When I start to see shifts on the smaller time frames, they tend to consolidate, and push thier final peaks of emotion (price peaks) until the larger time frames develope a shift and consolidates as well.
My first chart uses a weekly inflection point/momentum shift and the keltner channel to determine that price would drop to 20k from 60k...

NQ Power Range Report with FIB Ext - 7/23/2024 SessionCME_MINI:NQU2024
- PR High: 19998.25
- PR Low: 19973.00
- NZ Spread: 56.25
Key economic calendar event
10:00 | Existing Home Sales
Inventory response back to 20000 value area
Evening Stats (As of 10:25 PM 7/22)
- Weekend Gap: +0.25% (open > 19707)
- Gap 10/30/23 +0.47% (open < 14272)
- Session Open ATR: 298.08
- Volume: 19K
- Open Int: 249K
- Trend Grade: Bull
- From BA ATH: -5.7% (Rounded)
Key Levels (Rounded - Think of these as ranges)
- Long: 20954
- Mid: 19814
- Short: 18675
Keep in mind this is not speculation or a prediction. Only a report of the Power Range with Fib extensions for target hunting. Do your DD! You determine your risk tolerance. You are fully capable of making your own decisions.
BA: Back Adjusted
BuZ/BeZ: Bull Zone / Bear Zone
NZ: Neutral Zone

FFIE in a rising channel breakout ( RIP FSR) LONGFFIE is rising in a Keltner channel with a moving average channel superimposed. On this
15 minute chart, FFIE went from a low volume trend down to a reversal with volume on the
morning onf April 8th with the continuation into April 9th. This is a volatile penny stock.
Long trades are taken when price crosses through the moving average channel especially
if there is a corresponding volume spike.
The exit when price touches or crosses the upper boundary of the Keltner channel. I
have added the ATR stop loss indicator to manage the stop loss and its advancement up as price
rises. The trend up is now 35% but could easily continue higher. I will take a long trade
here with about a 5% stop- loss targeting 0.1184 and 0.1234 as recent pivots to the left.
FLong

US10Y - US Ten Year Yields WeeklySome weekly consolidation; Possible yields haven't topped yet. These inflection points lead to weekly and monthly trend changes which I will be looking for a potential spike as momentum shifts back down and rates test the keltner channel mid or upper line. There is also a possibility that rates breakout of the resistance (trend change) of this bullish leg from 2020. The Red line on the keltner channel oscillator at the bottom.
I expect more black swan events to occur as chaos ramps up in the next year.

HG Futures, Copper's Potential Rise: Monthly, Weekly, Daily.Monthly is winding up for a big drop or huge jump.
Monthly:
Weekly:
Daily shows price winding up potentially the rest of the year. So I will look towards year end for the fireworks, that will decide if our pent up momentum will release upwards or downwards.
My gut says inflation will send it upward in the near future.

Keltner Bands Pullback StrategyHere we take a look at trading pullbacks using the Keltner Channels. I cover the initial setup, the types of entries, and trades to avoid.
This setup contains 3 parts:
The channel touch
The Pullback
The Entry
The Channel Touch
Here is an example of the beginning signal in our setup, a band touch. The top and bottom bands represent the ATR (Average True Range) of a loopback period. So a touch of the band indicates volatility in the underlying stock or commodity. This also presents us with a chance for a nice pullback with continuation.
The Pullback
The pullback is simple, it is a reversion to the mean. So, the price pulls back to the mean (the ema) that the Keltners are based on. From this point, you can start to determine the entry.
The Entry
Depending on your style, a stop order, or limit order trader, you get to create your style to enter the trade. The following are some ideas: zero line MACD cross, second entry (price action) long or short, a trigger zone (for limit order traders), and an ema touch (limit order traders).
Zero Line Entry
Price pulled back and crossed the zero line on the modified MACD indicator.
Second Entry Long (High2)
The entry is the second attempt to break the previous bars high in a pullback.
The Trigger Zone
I created these based on an internal Keltner channel. You can set your limit orders anywhere inside of them.
EMA Touch
Whenever the price touches an offset ema you can enter. So you can place and move your limit order as the ema moves. I like to offset by one because you are guaranteed a price touch (ema doesn't move). Backtesting is also my accurate with an offset ema.
Conclusion
The Keltner channels offer an extremely powerful way to determine a potential pullback within a trend. They also help define trends (on the first touch) and help objectively identify climatic behavior. This strategy as a whole allows for high-quality setups and the flexibility of entering and exiting trades based on trading style. I like to shoot for a 1:1 based on stop placement.

TSLA - Weekly Inflection PointDaily is winding up to an inflection point, while the weekly is getting close as well. I'm favoring the bearish break; but there is a chance for a bullish reversal- so time will tell. What I can say is that we're approaching a conclusive point in time that will send price with signifcant momentum in either direction. When I look for an inflection point I watch for consolidating momentum. In turn I watch for breaks that releases the built up energy.
Previous Analysis:

BTCUSD - Potential Daily Inflection PointThis probably still needs time but we're approaching an inflection point, it may take another month or two to wind up, so I'll have to watch. Bitcoin has been popping up in it's low liquidity enviroment, and the MM is likely net short due to the influx of buyers. Since the market needs sellers, it's possible MM will push price down to get some liquidity.
On the 1 hour, DXY is playing it's usual games, and bitcoin is hitting a momentum shift; looks like another short squeeze without any follow through.
As DXY pushed up, bitcoin gets hammered back down.
I made some trend lines on the keltner channel that gives me the momentum shift signals.
Here is an earlier SS from last night:
Current Daily:
So I expect the resistance on the daily and dxy to push bitcoin back down into breakdown territory.
If not then it could be a major breakout.

Silver WeeklyShort Term Targets are ~23 usd
I expect price to hit within the next 5 weeks.
Also looking for a trip to 20-21 usd range to fill a monthly gap.
Overall I am bullish on silver.

Bitcoin Monthly Short Term target is 54k
Long Term target is 20k
Monthly is consolidating and will likely find it's way back below the 20 EMA near the bottom of the Keltner Channel.

1 YR US BILLS - WEEKLYSeeing a weekly momentum shift forming, expect major trend change.
Couple of scenarios, Economy could break and fed allows inflation to creep up while easing on rates, If they reduce reverse repo rates then yields will drop as money market funds buy 1 yr bills on the open market again.
Otherwise they might have to increase rates if inflation continues to weigh heavily on the economy with prices shooting up too fast.
1D
1W

NQ Power Range Report with FIB Ext - 3/7/2024 SessionCME_MINI:NQH2024
- PR High: 18048.00
- PR Low: 18018.50
- NZ Spread: 66.0
Key economic calendar events
08:30 | Initial Jobless Claims
10:00 | Fed Chair Powell Testifies
Prev session printed as inside bar
- Fading to prev session open from close
- Inventory response off prev session lows
- Consistently responding around daily 20 Keltner avg
Evening Stats (As of 12:15 AM)
- Weekend Gap: +0.08 (filled)
- Gap 10/30 +0.47% (open < 14272)
- Session Open ATR: 244.10
- Volume: 39K
- Open Int: 290K
- Trend Grade: Bull
- From BA ATH: -2.2% (Rounded)
Key Levels (Rounded - Think of these as ranges)
- Long: 18675
- Mid: 18106
- Short: 16963
Keep in mind this is not speculation or a prediction. Only a report of the Power Range with Fib extensions for target hunting. Do your DD! You determine your risk tolerance. You are fully capable of making your own decisions.
BA: Back Adjusted
BuZ/BeZ: Bull Zone / Bear Zone
NZ: Neutral Zone
