Lesson: BTC forming bullish rectangle?BTC seems to be forming a bullish rectangle on the H4 chart, I will attach a photo in a comment below for reference. I have drawn out a couple lines for entries, sl and tp if this bullish flag plays out.
Bullish flag breakout generally moves the same ammount as the move before, in this case BTC jumped about 8%, so therefore we can expect another 8% jump if the H4 candle closes above the resistance line (Line 1).
I hope this helps, even if it doesn't play out.
Please leave any questions:)
Trade safely
Lesson

General lesson + BTC and ETH showing strength Analysis:
BTC bounced off RSI support and is now at a resistance level, ETH and global markets like DOW also jump and showing strength. If BTC hold this level and give breakout many alts will jump 20-25% in the next 2 weeks. Reason for todays bounce back could be Amazons announcement of their Q4 earnings, making their stock rise 17% a day after META dropped, the biggest single day gain in US stock market history.
Lesson part:
BTC dominance has been steadily decreasing but is up a little bit in the last hour or so, and the total market cap is moving up. What does this mean?
If we look at the following rule below we can make predictions on alts on the market direction.
BTC D up + Mcap up = Good for all coins
BTC D up + Mcap down = Good for BTC but bad for alts
BTC D down + Mcap up = Very good for alts
BTC D down + Mcap down = Very bad for btc and alts
Use this rule accordingly.
Trade safely:)
- Seb

Conservative vs Aggressive Entries - Different ways to enter!There are different ways to enter trades - some opt for an aggressive approach while others opt for a conservative entry. Aggressive entries are taken at the first signs of reversal out of a supply/demand zone while conservative entries wait for more significant larger structure breaks in the trend.
I almost always opt for the conservative take as I want structure to be with me all the way. By getting in with an aggressive entry you can achieve higher risk reward but you will also inevitably run into more losses because you are relying on the short term trend to confirm your higher timeframe intensions.
It comes down to your risk tolerance: Conservative entries require patience and sometimes when they don't give an entry you'll need discipline to avoid getting burned - but they are the wiser option for risk averse traders. Aggressive trades will get you in on nearly every move you have planned but they'll also get you took out a fair amount more than conservative entries. How much pain can you take?
I recommend choosing an approach and sticking to it - being a master of one approach is better than a novice at many!

TA basics on SHIBA INUKnowing the basics of technical analysis gives you a great advantage over the average investor. Here is some basic TA with examples to help you identify trends, corrections, and potential reversals. If you enjoy content like this please make sure to like and follow. Starting in March I will be creating videos weekly analyzing stocks and crypto along with some basic lessons.

Thesis on next move for #BitcoinThis chart is looking at bitcoin from a purely trading aspect taking away indicators and just focusing on the price action.
first we establish the overall high and low in the range (in yellow)
next we establish the current price trend over the last few days (in red)
we can see bitcoin has recently broken out of smaller consolidation pattern (in white) and has bounced of previous long term support at 40K. it seems bitcoin will retrace back to the previous consolidation zone. a bounce off the lower support turned resistance (red arrow) would be a confirmation of a going short back to 40K at the least.
if bitcoin can break back above this lower resistance (in green) area then we can expect a move back towards the top of that consolidation zone before being rejected or breaking out above which would be very bullish probably leading to a huge sentiment shift in the short term.
if you happen to be in a trade below these white zones i would take profit at each resistance . the point is to lock in gains afterall.
few tips i wanted to pass along to new traders.
horizontal support and resistance is key to trade setups and take profits. DO NOT trade based off of diagonal lines as they are more subjective and can be changed to make the picture more bullish or bearish which will cause bias.
you have to remain unbiased and the best way to do that is to establish important horizontal support and resistance levels on both high time frames and low and pair those levels with indicators like RSI and MACD for instance to find the right time to enter and which position to take.
always make a plan before you trade and always have a stop loss.
stick to your plan and your stop loss and leave your ego at the door. no one is seeing this but you its ok to lose the small one to catch the big fish.
preservation of your bank roll is key. never gamble never go on a whim and only play with what you can afford.

The Problem with Breakeven TradesThe issue with breakeven trading is that when enough people are joining the market at the same place, be it a demand area or an order block.
Many traders like to secure their positions immediately.
This, however, creates liquidity.
Whenever a large group of people move stop losses to the same area, expect that area to be a target for the banks.
In this example, we can see buy orders being activated at an order block, a sudden push to make buyers secure their position, followed by a stop hunt of risk-free trades before continuing to the upside.
Do you ever get caught in situations like this?

Lesson in trade setups. take it or leave itTrading is difficult. it takes patience. the key to a successful trade is planning.
in this chart we do away with diagonal trend lines . all we are looking at is the horizontal support and resistances.
to keep trading simple you have a thesis, stick to it and execute on it. you breakout from either support or resistance that will be your signal to begin to watch the charts for your trade to develop. you need to have the patience to wait for a retest and bounce off the horizontal line and the price to break past the retest pivot
waiting for your thesis to play out and always using stop losses in this case right below the support/resistance lines that the price broke from will keep your stack safe and your losses small.
in turn (not shown on this chart) you can also take the short and long trades based on price tagging the support (short) or resistance(long) lines.
good luck trading
ELM Trading Group

Bitcoin capitulation before breaking explosively up3 Indicators, if they hold and become support this thing will explode before January.
1) Hold the Bullish strip (21 Week EMA and 20 week SMA) and the 120 Daily EMA:
Today just touched it between 51K and 53K and it closed above both.
2) Breakup descending wedge pattern and hold yellow ascending trend line:
A clear wedge that has a goal of over $70K if it breaks up in the next few days
3) Confirming as support the 0.618 Fib level:
from the bottom and resuming up, usually is great support.
If all of this doesn't hold I will be hedging and trading some of it to the downside for more consolidation, probably untel January of next week.
Remember:
a) Always trade with a plan and strategy: Analyse thoroughly and mark your supports and resistance levels to sell and buy and DON'T change them
b) Never forget the macro, especially in crypto: so don't sell your HODL positions.
c) Invest like institutions: DCA when there is fear in the market and don't buy or sell all at once.
NEVER trade with your emotions.
Best of luck everyone!!!

Another vital lesson in the markets...Perhaps the most important rule when trading professionally Is that history repeats itself in the markets..
So you may be asking what exactly does this mean?
Well its rather simple; Market moves that happened before happen again!... Over and over. The reason is because markets have memory. When price returns to these levels you see similar reactions.
Why is this information so important?..
It is Important because it allows you to Make better decisions in your trading. If you know price repeats, you can add it into the formula you use to trade any asset. This is because it works in any setting and is relevant in ALL markets. You will notice no matter the chart you are looking at, there is oscillations and consolidations. These are all based on price action from previous events.

A Great example of core market functions.I thought it was a good time to share this lesson on understanding price movement within markets.
Often, traders will not be able to remain 'calm in the game' as long as the market maker.
Price can go up, or it can come down. Inevitably, as liquidity and orders are taken in the market, it will stall and reverse.
It is just inevitable.
Markets have to go up and come down in order to properly function. You can't have a liquid market without buying AND selling, therefore everything has to come back at some point.
The key is not to assume price will just keep going forever, as it will not.

Simple Price Action Strategy – Easy Money! $$$$$Here is one of my favourite setups that is easy to learn and trade. I’ve heard it called many things over the years and know that many successful traders watch for this pattern to play out as it has a high win rate. Whatever you want to call it, it’s worth studying and adding to your playbook.
What’s actually happening in this pattern?
-A low is formed. Long entries have stops below the low providing a pocket of liquidity.
-As price returns to the area these stops are hunted and the liquidity is taken. Early breakout traders will short and become trapped. A base has now been formed.
-Price returns to the base and retests it as support.
-Price bounces back to swing high.
How do we trade it?
-The first thing we want to look for is a swing low (1) followed by a swing high (2). We can then mark out a potential range.
-Next, we want price to return to the swing low and either trade briefly below the range (a deviation) or just quickly wick below (sweeping the lows), and then price should return to the range. This area is shown as 3.
-Bids can now be placed at the range low. The setup is invalidated if price trades lower than 3, so stops should be somewhere under the low at 3.
-Targets should be set at the swing high (2).
-This also works for shorts – just flip everything upside down.
You can see this pattern on all timeframes and it presents a lot of opportunities once you know what to look for.
Happy Trading.

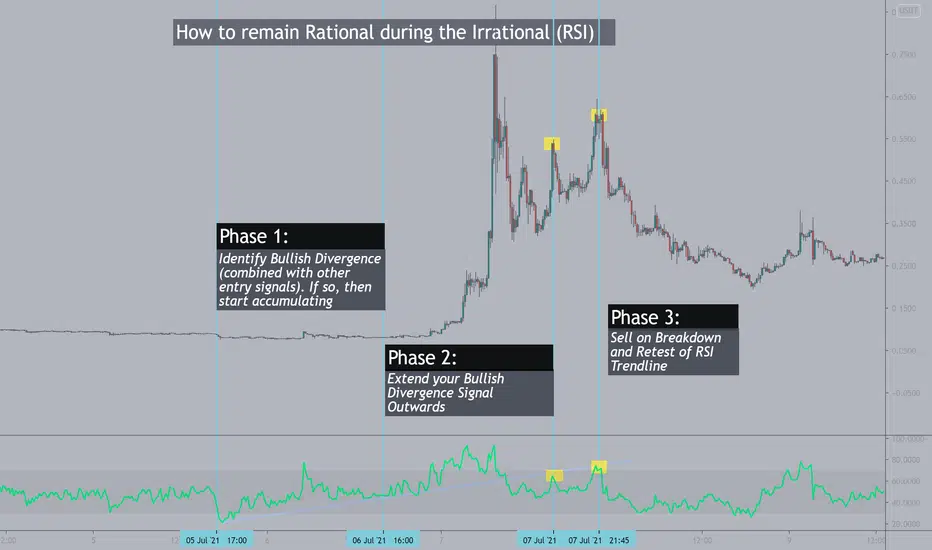
How to Trade the RSI with Irrational Price ActionCheck out the related ideas link for more information.
I hope this adds another tool to your trading arsenal
BTC Chart Formations, Trendlines and DivergencesChart Patterns
2018 was an interesting time. Bitcoin had gone berserk and there where both prophets of prosperity and doom preaching about the future of bitcoin and all the new folks had to decide if they still wanted to play and what to do with their money. Lots of people correctly identified this descending triangle but many people were so bullish they saw it instead of being a triangle being a saucer or a cup and handle, basically anything but a bearish formation. I remember being uncertain as well, at times I played the triangle resistance very will with some outstanding shorts and other times I made some trash trades.
It takes way more experience than people think to trust a chart formation and trust the targeting on it. Especially with triangles, they are some of the easiest of formations to recognize but they have some of the worst performance. The Head and shoulders is different. Mr. Bulkowski wrote one of the most important texts on charting with ranking patterns on chances of throwbacks, chances to get full performance, and average performance. The head and shoulders is 9 out of 36 for reaching target, so it is in the top quarter formations you could try to play. thepatternsite.com
Stats on the head and shoulder from traditional markets
Break even failure rate: 19%
Average decline: 16%
Pullback rate: 68%
Percentage meeting price target: 51%
Highlight from the trading tips
Velocity: A high velocity rise leading to the pattern often results in a larger decline post breakout.
Since we had a high velocity move into the pattern we can expect a larger decline than traditional targeting would suppose. But since we are on the log scale traditional targeting gets harder to do and so we have to use fib levels. And the target based on fibs alone is show and it is below the previous high.
Trendlines
Various chartists have correctly identified some long term trend lines that would act as support here and I have mocked one of them up in magenta. Thing is people were hoping for the exact same thing with the purple trendline before the big dump below $5.7k. Now obviously every chart formation is made out of support and resistance and therefore some trendlines. But trendlines flip from resistance to support all the time and when they fail they can fail to violent price action. Horizontal levels as well as angled trendlines can fail as support or resistance and you cannot guarantee that this magenta trendline, or a similar one, will hold forever.
Divergence
I am a big believer in divergences but I have many times looked at getting into a move way to early because I was not patient enough. Moves often will have a combination of hidden and cassic divergences in them. For a bullish example price action can display bullish divergence by setting a higher low on price and a lower low on the indicator but until that low has bullish divergence within itself it won't trigger, and that often occurs in waves of three. Hopefully this chart below will help. I don't forecast BTC having a sustained uptrend until we see classic bullish divergence on the weekly within the low that is still developing.
Conclusion
More downside and then a lot more upside. Until I get an invalidation of the head and shoulders or another major signal of trend change (like getting a whole candle above the 20 week SMA) I am still bearish. Please see the linked post for target setting.

NZD/CHF Long - 21 May 2021 | Hybrid Move Result: -1.00%Hey All,
The trade initiated from a Daily Counterzone stacked with a clean area of weekly demand as well perfect in my opinion with the main idea to break the daily trend and
continue the higher-timeframe bias to the upside. Overall the setup was pretty complex due to the Counterzone analysis, yet clear enough to find and edge.
The 4hour strategy was executed after price formed a clean star formation and exploded to the upside after some more deceleration. The 4hour started to create a small double bottom formation
with our automatic Hybrid Strategy entry when the 4hour star closed. At the daily time-frame prices reached the downward sloping trendline formation which was never broken to the upside, instead
price moved towards the downside creating a deeper daily lower low and continue the trend.
Good trade, good edge.

AUDCAD lessonA lesson of trading in AUDCAD (my strategy) to be most highly profitable in the market (works in lower TF as well)

Be like Jake *educational material*
*This is not financial advice, so trade at your own risks*
*My team digs deep and finds stocks that are expected to perform well based off multiple confluences*
*Experienced traders understand the uphill battle in timing the market, so instead my team focuses mainly on risk management*
My team has decided to use a recent failed trade as an example of the importance of stop losses. Here @SimplyShowMeTheMoney you may have noticed that we place stop losses and stop profit losses on the majority of our trades. If we ever post a trade without a stop loss please understand that we're waiting for further information and that we have long-term confidence in the trade and are not worried about the short-term price action in-between.
To demonstrate the importance of stop losses we must first introduce you to a successful retail trader by the name of Jake. Our friend Jake has been trading for the past 5 years. Jakes trading strategy is simple: he finds a company that he likes, and he invests his money into it. Jake hits roughly 6 out of 10 of the trades that he places. Jakes 60 percent winning average may sound 'okay' at first but lets say Jake is consistent about managing his take profits and stop-losses. Jake may be losing 40 percent of his trades, but he is able to mitigate most of the risks due to his insane stop-loss precision.
But if you've been in the market long enough and have ever used stop-losses then you can probably recall a time where your trade broke through your stop-loss and then the worst thing possible happens...it shoots off to the moon without you while you watch in disbelief with your jaw dropped down to the floor.
Jake knows this feeling very well. So to lower this risk, Jake locates key price areas on the chart where the stock may be at its weakest and places his stop losses. Doing this helps prevents scenarios like the one above from occuring.
Jake cares about the roof over his head and keeping food in his belly. He cares about the amount of sleep he gets every night. Jake wants to be able to enjoy quality time with his girlfriend without feeling anxious about a trade that was supposed to buy her a ring, but is now worth as little as a ring-pop. That's why Jake uses stop-losses.
Be like Jake.
If you would like to see more, please please like and follow us @SimplyShowMeTheMoney

My journey with Alien WorldsThis was by far one of my most shining moments in crypto. This "buy out the gate" strategy works great for concert tickets.
I feel like I have really earned my stripes by buying my first rug pull coin that is now technically too cheap to sell.
A cockroach. A constant reminder.
The badge of a true crypto degenerate :)

How to use the support and resistance the proper way.Very clear, a child should be able do understand this.

Investment tips/lessons on bitcoinThis tips/lesson applies to every stock or crypto or any other financial instrument, that you truly belive in and have done your own research on.
Imagine you are a late #bitcoin investor and on the 28th of May you decide to invest in bitcoin, first you should set yourself a long term target. I have shown on the graph an example of $33000 per bitcoin and here is my tips, how you should had invested to succeed and how much your investment will give you! Lets say you have a salary of $1000 per month and your investment is 10% of your income, so that should be $100, each month.
On 1st of June 2019 you purchase your first bitcoin at a price of $12000 that's 0,00833333, 2nd purchase 0,00914746, 3rd - 0,00960799, 4th - 0,01256281, 5th - 0,01136364, 6th - 0,01342282, 7th - 0,01333333, 8th - 0,00968992, 9th - 0,01219512, 10th - 0,01449275, 11th - 0,01136364, 12th - 0,01052632, 13th - 0,01111111, 14th - 0,00862069, 15th - 0,00862069, 16th - 0,00943396, 17th - 0,00649351, 18th - 0,00510204. So that's 1,5 year of investment and it equals to 0,18542112 btc which was $1800. 28th of December you reach your target and yor income will equal to $6118 ($33000*0,18542112). So you have gained *3 of your investment, after only one year and a half, it's not bad! What do you think?
Thats a little secret how to be a success and you don't have to trade

Rolls Royce Trade Review - 20% profit in just 3 weeks!Hi traders,
This is the first in a series of trade reviews that I will be doing for TradingView viewers where each week I will review one or two of my trades. We will outline why we entered them and also how they went.
This is meant only for educational purposes for you to learn some of the skills that I implement when trading.
In this trade I used a very simple break and retest of a key level as the investment strategy.
If you have any questions then please let me know in the comments.

What IS Bitcoin?! An Explanation of Why Bitcoin has Value!In this video I explain what is Bitcoin fundamentally and why does it have value to investors.
If you have any questions then please comment below.
I hope this video has been informative.

A Day Traders Results of not Sticking to the Plan! feat. BoeingAt times I find myself locked in to trying to find a better entry while my trade plan is setting up during the day. More often than not, when the internal battle is won by the impatient voice in my head,
I sneak into a trade early and pay the price for it.
Well... today was one of those days
I'm not sitting here saying that my set-ups are always right, nor am I saying I'm some trading savant that wins every trade. What I am saying is the important part is to have a plan and follow it. In doing this, it eliminates a lot of the emotion that can go into the decisions being made throughout the trading day. It allows for well-thought out entry and exit points, manages exposure of losses when wrong, and provides a picture of what the profit/loss will be depending on if the analysis is right or wrong.
Below is just an example of a position I took today in which I didn't follow my plan and ended up being on the wrong side of the trade. The technical analysis explained is simply included to describe the approach and thought process I had in entering this trade. In no way am I suggesting for anyone to use these types of set ups, nor am I claiming these set ups are a successful way to trade.
SPOILER ALERT: The price action would have given me my entry if I would have stuck to the plan.
This morning I posted the trade idea image below before entering a trade in BA
At this point I had been patient and let the 1st move settle. I noticed that the price action was stuck dead in the middle of a battle between two previous action zones; one supply (top gray-shaded zone) and one demand (bottom green-shaded zone). I was licking my chops knowing that this was setting up perfectly for a day trade. I anticipated that the price action would give me a good point of confirmation before making its move either to the up or down-side.
The plan that if the price broke up above the supply zone, entry would be triggered at a rejection of downside re-entry into supply. Or to enter a long put position at a rejection of upside re-entry back into the demand zone, following a break below.
The confirmation of a call entry would give a change of about 3 delta to the upside while placing my stop-loss at a break below the supply zone, giving a delta of -1.5. Profit target was decided by an above descending trendline in which the angle was produced by previous highs of supply resistance connected to the following confirmed demand zone before a lower supply was formed. So, a higher supply based resistance would be drawn to a lower demand-found support, angling down towards but above the current price range. My thought here is that if there is downside rejection to a previous supply zone, the sellers are currently no longer there. Inversely, an upside rejection to a previous demand zone shows that the buyers are no longer there.
The confirmation to enter a put position provided the same risk/reward profile as the call entry. Similarly, the profit target was decided by the inverse of the supply to demand (descending) trendline. Which results from a previously lower supply zone connected to a higher confirmed demand zone, ascending towards but below the current price action.
Whether it was because I got impatient, or maybe I thought I had solved the Rubik's cube equivalent to arbitrarily drawn trendlines for intra-day breakouts... It didn't matter, I didn't really have a plan.
Below is where I decided to enter the trade. - I posted this chart as an update to the trade idea shortly after I entered.
I wasn't sure what resistance would be produced from a break of that level and I wasn't really sure at the time where my stop loss should be placed. After entering the trade I realized that the entry would give me higher negative delta to reach my stop (increasing it to as potentially high as -2). I still really wasn't sure where price would find upside resistance, so I just used the same resistance as the original plan.
So what came as a result?
After a break of the supply zone failed to hold, a higher low was found but was quickly met with a rejection to break back into supply.
The result? A potential diamond top developing!
Translation = quick, everyone long simultaneously set stop losses on a break below the bottom trendline support.
Next up. You guessed it
Stop was hit and I exited the trade for a loss.
The result of entry from the original plan is as follows.
Lessons to be learned-
1. Yes, although in this case my original trade plan would have given me my entry and produced the expected profit, this will not always be the case.
If a trade plan is created and it doesn't end up triggering your intended entry, GOOD! you were wrong anyways but you didn't have to lose money this time to figure that part out.
Take this as an opportunity to review your trade plan. See what indications you may have missed to enter or not to enter. See where you can improve your edge.
2. Maintain control of your emotions during price action, don't let quick moves produce a reaction.
If a move is already happening quickly, guess what you're late to the dinner party. Don't try and convince yourself that the stale crackers and warm coleslaw left is the meal you really want to be eating.
3. If you miss a trade or your plan doesn't produce an entry, try an identify where others entered and why.
4. Look at both sides of every trade.
-If you intend to go long ask yourself if you already held a position what would keep you from selling at your entry, or what would reasons would there be to add to your position here.
-If you're short ask yourself "why wouldn't I buy here" or "why would I want to be quick to sell at this level?"
5. The best part about trading is learning. At times, it is more rewarding to learn than it is to win.
-I have included the link to my original BA trade idea

BTCUSD Bitcoin analysis and educational lessonThe educational lesson is an illustrative diagram drawn regularly that shows most of the movements between the date of January 4th to today in a classic, easy-to-understand way, linking the movement with the next movement
