USDCHF - Bullish OutlookMulti-Timeframe:
Alignment intact — waiting for full sync before execution.
HTF (4H):
Bullish structure remains intact. Price is in a ranging environment but leaning bullish overall, showing strong structural support.
Mid-Term (30M):
OB has been mitigated, with bullish pressure visible in the orange zone to the left. Smart money engineered liquidity, leading price toward the LTF OB at the discounted origin zone.
LTF (5M):
Price is currently mitigating the internal OB near the origin block (green zone). I’m looking for full candle bodies inside the zone to confirm smart money intent. If not, I’ll continue tracking until a fresh BOS, clean POI, and liquidity levels form.
Patience is key.
Tracking is the edge.
Let’s go. 🚀
Multiple Time Frame Analysis

Bitcoin Eyes $90K: Bullish Setup from $85,960.5Bitcoin could start a bullish move from the $85,960.5 range, targeting the $90,000 mark. The $84,551 level is critical for this outlook. BINANCE:BTCUSDT

EURUSD - Bullish OutlookHTF (4H):
Bullish alignment restored. Price is heading toward the HTF objective at 1.19183, showing clean momentum.
Where the untrained eye might see confusion, the trained eye sees a guided navigation road map.
Mid-Term (30M):
CHoCH confirmed — previous strong LH has been taken out, leaving directional footprints and structure hints.
Now waiting on full candle mitigation inside the mid-term OB to align the next push toward the HTF objective.
LTF (5M):
Once price taps the zone, I’ll track for a minor LH break to confirm zone strength, with volume supporting interest for continuation.
Until then — patience is key.
Tracking is the edge.
Smart Money leads.
Let’s go. 🚀

EURGBP - Bullish OutlookHTF (4H):
Bullish structure is clean and controlled — rhythm is easy to read, directional intent is clear. I want to be part of that continuation phase once the lower timeframes sync.
Mid-Term (30M):
Previous week’s mid-term OB was violated, driving price directly into the stronger HTF OB below. Solid mitigation there. Now I’m expecting a mid-term CHoCH + LH break to flip structure back bullish. Until full alignment forms and the market syncs correctly, I’m staying patient and monitoring.
LTF (5M):
Once the 30m LH breaks, I’ll look for a fresh SSL and newly formed OB near the sweep. That’s when I’ll drop into LTF to confirm the flip and validate that mid-term zone is ready to hold and launch.
Patience is key. Tracking is the edge.
Let’s go. 🚀

CADJPY - Bullish OutlookHTF (4H):
Bullish momentum remains intact as price continues to build off previous week’s structure. Narrative is still expansion, nothing broken, no change in intent.
Mid-Term (30M):
Looking to join the continuation phase, but expecting distribution first. Waiting for bears to drive price lower to sweep liquidity (SSL) and deliver price into the mid-term OB. That’s the area I want to see mitigated before aligning with the next leg up.
LTF (5M):
Once price taps the mid-term zone, I’ll drop down for confirmation—LH break + full CHoCH to validate continuation and position flow. Until then, staying patient.
Patience is key. Tracking is the edge.
Let’s see what unfolds — let’s go.

GBPJPY - Bullish OutlookHTF (4H):
Market is in a clean expansion phase with strong volume supporting bullish momentum. New structure has formed, and the narrative remains continuation to the upside as long as current structure holds.
Mid-Term (30M):
Price has shown continuation flow, but I’m expecting short-term bearish movement first — a drive lower to sweep liquidity and complete full SSL into the OB below. Once that zone is fully mitigated (candle bodies included), next step is confirmation for continuation.
LTF (5M):
Waiting on a CHoCH and LH break to align with the broader narrative. From there, I’ll focus on recent liquidity structure + fresh OB development for potential execution.
Patience is key. Tracking is the edge.
Let’s see what this week offers — let’s work.

AUDJPY - Bullish OutlookHTF (4H):
Price remains bullish with clean continuation flow to the upside. Current leg is expanding with strong momentum, and the next HTF objective is 104.402.
Mid-Term (30M):
Price pushed higher into continuation structure, and we saw mitigation of the refined orange OB. That zone held clean with solid volume follow-through — supporting ongoing upside intent. Market structure remains aligned with the HTF expansion narrative.
LTF (5M):
A clean CHoCH formed as the major LH was taken, opening the path for continuation toward the highs. I’m still tracking price closely for deeper mitigations into LTF OBs before considering execution — letting price come to me rather than chasing early imbalance.
Plan:
Patience stays the key. Tracking is the edge. Waiting for price to sweep and deliver a cleaner OB mitigation before stepping in. The bullish narrative remains intact until proven otherwise.
Let’s see what the week delivers — focus and execution.

USDJPY - HTF Bullish Narrative + IDM Mechanics + LTF OutlookHTF (4H):
Structure remains bullish.
HTF external liquidity target sits at 157.905 with market intent showing continued expansion toward that level.
⸻
Mid-Term (30M):
Price is holding previous week’s structure and continuing its bullish progression toward mid/HTF highs. We saw mitigation of the refined OB before price reversed, using IDM to pull traders into the refined zone and engineer liquidity for continuation.
⸻
LTF (5M):
Major CHoCH swept inducement and engineered liquidity beneath the move. Strong volume and candle exhaustion show clear bullish intent reacting off the green zone.
Entry was possible there, but I chose discipline — I want full alignment before stepping in.
⸻
Expectations:
Looking for a fresh LTF liquidity sweep to lead price back into a clean LTF OB, which aligns with imbalance on the zoomed-out structure.
This week, it’s patience:
Track → Align → Execute.
Let’s see how price delivers.
Until then — patience is key, tracking is the edge.
Let’s go. 🚀

Kimo notes: TS CRT CISD MSSKimo did really good job.
In his chart, there's a daily CRT. This clarifies our higher timeframe bias.
Monday ~ accumulation
Tuesday ~ manipulation
Rest of the week ~ distribution
Every time price turtle souped low, it's an opportunity to take long entry.

Long trade Buyside trade
Sun 21st Dec 25
LND Session AM
8.25 am
Entry 5min TF
Entry 1.4424
Profit level 1.4843 (2.90%)
Stop level 1.4391 (0.22%)
RR 12.7
📌 SUIUSDT.P — Buy-Side Liquidity Expansion (30M)
Market: SUIUSDT Perpetual
Timeframe: 30 minutes
Model: AMD (Accumulation → Manipulation → Distribution)
Bias: Bullish continuation after sell-side failure
🔍 Market Context -STRUCTURE
The price traded back into discount territory following a controlled sell-side sweep below the prior session's lows. Higher-timeframe structure remains intact, with no bearish BOS confirmed. This created a classic environment for buy-side delivery once liquidity has been engineered.
🧠 Setup Logic (Institutional Narrative)
Accumulation (A):
Range compression following sell-side sweep
Price stabilises inside a defined demand zone
Manipulation (M):
Wick and displacement observed - demand zone
Stops cleared beneath NY session lows
Distribution / Expansion (D):
Strong bullish displacement from demand
Expansion delivered during the London → NY overlap
🟦 TAB 6 — FVG / INEFFICIENCY
Multiple 5m / 30m FVGs below price
Price respected FVG support on retest
Clean imbalance → expansion behaviour

Rosie notes: TS CISD MSS2025.12.19 homework
Rosie also shared her studies.
TS is more likely made at the same time of the day. 👀 (~session setup)

A continued crash to $45k for Bitcoin? - December 2025Bitcoin has 5 days to stop the current candle body print under the 11 day 50SMA. Throughout the entire history of Bitcoin, a candle body close under this level has meant a test of the 11 day 200SMA. It is that simple. Never a false signal.
Here are all the historical data points:
50SMA on the 11 day chart throughout all Bitcoin history
At the moment the candle prints as a Gravestone DOJI.
Zoom in a little further to the 3 day chart and you can see price action follows the 200SMA. Does not matter what the asset is, anytime you see this, it is a sign of weakness. Look left. Regardless of asset, a complete collapse typically follows. Even if price action staggers like a drunken sailor finding his way back to port.
The idea " Is a Bitcoin crash to $40–45k next? – October 2025 " published around $120k made the break of market structure very clear. This idea is a continuation of the same break of structure. The spite continues to pour in for this idea. The market does not care.
Micheal Saylor's lenders will likely become very nervous should this continuation confirm. A forced liquidation of Strategy would be the best thing that could happen to the Bitcoin space in my opinion as the cash to pay out Dividends must come from somewhere, and that means selling Bitcoins. In an already depleted marketplace. Have noticed influencers gaslighting audiences with "Black rock" is buying your panic selling at this time posts.
Conclusions
Let’s not dress this up like a TED Talk. Bitcoin has five days to avoid doing the thing it has never once avoided in its entire history. That’s not drama, that’s statistics, the boring kind that ruins hopium.
A confirmed candle body close under the 11-day 50 SMA has always resulted in a test of the 11-day 200 SMA. No exceptions. No “yeah but this time BlackRock…”. No spiritual awakening mid-candle. Just gravity doing what gravity does.
At present, price is printing a gravestone DOJI. Which, despite the name is not a bullish candle, unless you’re a fan of irony or funerals.
The break of market structure was identified months ago near $120k, when optimism was peaking and common sense was being shouted down by people with laser eyes and affiliate links. Since then, price action has done exactly what broken structure does: grind, fail, and roll over.
A move toward $45k is not a prediction pulled from thin air, it’s a mechanical outcome if the current signal confirms. If that level is reached, it will be framed as a “black swan”, despite being broadcast loudly, publicly, and repeatedly in advance by yours truly.
As for the Saylor situation, leverage works both ways. Lenders get nervous. A forced seller in a thin market is never bullish, no matter how many times “BlackRock” is whispered like a protective spell. If this cascade happens, it won’t kill Bitcoin. It will do something far worse to the influencers: it will expose them. And frankly, that might be the healthiest thing this market has seen in years.
Ww
Disclaimer
==============================================================
This is not financial advice.
It is not a call to panic, sell the bottom, or tweet angrily at strangers. Markets can invalidate any thesis at any time. If price action reclaims structure and closes decisively back above key moving averages, this outlook changes. Loyalty to a chart after it’s wrong isn’t conviction, it’s just stubbornness with a Wi-Fi connection.
If you’re trading with leverage, emotion, or borrowed confidence from YouTube thumbnails, none of this will save you. If you’re trading probabilities, history, and structure, then this is simply the chart doing what it has always done, while people insist it won’t.

Gold Weekly Review: Balance at 4360 & The Holiday Breakout?FOREXCOM:XAUUSD FOREXCOM:XAUUSD
COMEX:GC1!
Analysis
1. Market Context (Value Established)
Reviewing the week's auction, Gold has spent significant time hovering between 4350 and 4370 .
• Weekly POC (4360): The market has established 4360 as the "Fairest Price" or Point of Control for the week. This indicates a market in Balance .
• The Test: We breached the 4380/90 resistance earlier, and late Friday's action brought us back to test 4380. This persistence at the upper extreme suggests buyers are probing for higher prices.
2. Next Week's Scenarios (ATH vs. Balance)
• Bull Case (Acceptance): If Gold can trade and build acceptance above 4380 next week, it confirms Initiative Buying leading the auction away from the 4360 value. The path to the All-Time High (ATH) opens up.
• Bear Case (Rejection): Failure to hold 4380 would likely rotate price back to the "gravitational center" at the 4360 POC.
3. Holiday Warning (Thin Market)
Next week is the Christmas trading week.
• Risk: Be extremely careful. Markets will be "thin" (low liquidity). Moves in thin markets can be exaggerated and emotional, often lacking the structural integrity of "New Money" participation.
Plan & Execution
• Focus: 4380 is the pivot. Above = ATH context. Below = Rotation to 4360.
• Advice: Reduce size or stand aside due to holiday volatility.
Talk to you next week.

Gold (4H) — Supply is holding… for nowContext
On the left of the chart, Gold reached the higher-timeframe C target .
That was a valid place for sellers to take control — and they didn’t.
Price absorbed selling pressure and kept moving.
Now we’re at a different level.
The red zone is the all-time-high supply.
Sellers are active here. Price is being held.
That part matters and shouldn’t be ignored.
What formed under supply
Instead of a dump, price built structure:
A clear base
Liquidity sweep
MSS
A fresh ABC sequence
B held.
B broke A.
That tells me buyers are still participating, even with supply overhead.
Expectation
I’m not expecting an immediate breakout.
What makes sense here is a pullback first.
A revisit into the continuation breaker , clearing inducement and resetting positioning.
If that zone holds and price flips back up, then a break of supply opens the path toward C .
If the structure fails, I step aside.
No forcing it.
Watching how price behaves — not guessing the outcome.
SmellyTaz — decoding chaos.
Not financial advice. Shared for educational purposes only.

How different timeframe groupings complement the market viewHello traders and investors!
Comparing different timeframe groupings allows us to validate market hypotheses and better understand structure and key levels.
Both charts are built on a 7-day timeframe, but with different data groupings.
On the left — a classic weekly chart, on the right — 7 days.
Why look at both versions?
To test a hypothesis (all groupings should confirm it) and to see what is not obvious in the standard view.
In this case, there are effectively no contextual contradictions.
Right chart: a sideways range with buyer initiative.
Left chart: a sideways range and a transitional phase — the price moved below the lower boundary of the range, below 98,200, but the seller failed to start a trend.
Buyer levels are located below:
89,256 on the left — the former lower boundary of the range, a contextual area to look for buys.
88,765 on the right — the upper boundary of the last seller initiative, also a contextual buy area.
Buyer targets:
107,429 on the left,
108,324 on the right (this target will reappear if the price returns above 98,200).
In both cases, the targets are conceptually the same — the lower boundaries of the seller zone.
Conclusion:
The price is currently in a buyer contextual area.
The potential target of the move is 107,000–108,000.
A conservative approach is to consider long positions only after the price returns above 98,200.
This alignment across different groupings strengthens the buyer context and helps define clear conditions for conservative positioning.
Profitable trades!
This analysis is based on the Initiative Analysis (IA) method.

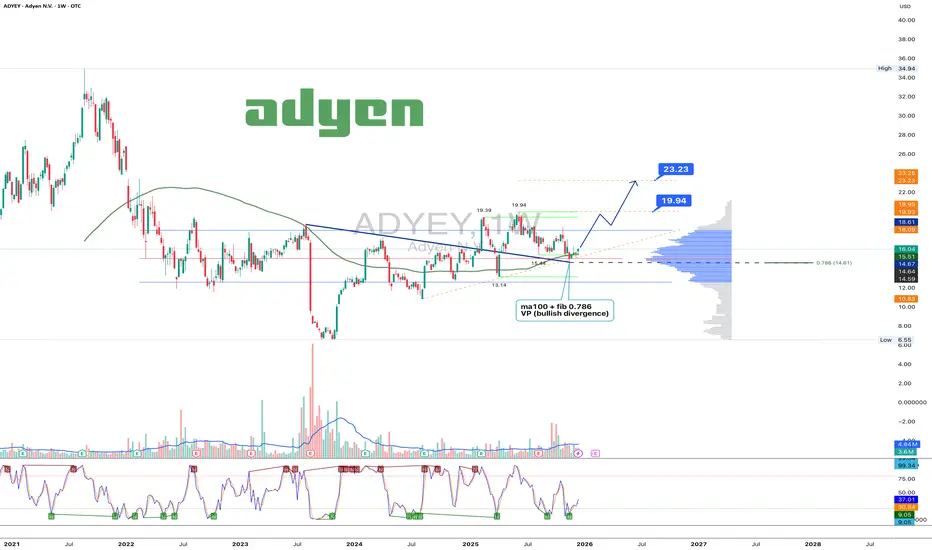
Adyen 1W: The trend broke twice, the market is just catching upOn the weekly chart, Adyen has broken the long term downtrend twice, and price is now performing a controlled pullback retest. The current consolidation holds above the $15.5–16.0 demand zone, where MA100, 0.786 Fibonacci and strong volume profile support align. Selling pressure is fading, volumes on the pullback are declining, and bullish divergence remains intact. This structure favors confirmation of the breakout rather than a return to a bearish trend. As long as price stays above this zone, upside remains the priority. First target stands at $19.94, followed by $23.23.
Fundamentally, Adyen continues to deliver consistent growth. H1 2025 revenue reached $1.28B, up from $1.13B in H2 2024. H2 2025 revenue is projected at $1.49B, with forecasts extending toward $1.53–1.88B in 2026–2027. EPS came in at $0.18 for H1 2025, with $0.21 expected in H2, rising toward $0.25–0.26 by 2027. Analyst sentiment leans bullish as digital payment volumes continue to expand globally.
When a trend breaks twice, patience usually gets paid.
Gold Context: Strong Short Covering & The New Money TestFOREXCOM:XAUUSD COMEX_MINI:MGCG2026 COMEX:GC1!
Analysis
1. Market Context (Early US Session)
We are witnessing strong Short Covering in the early US session, continuing the momentum from yesterday where Gold traded above the previous multi-day range.
• The Driver: The vertical nature of the move confirms the exit of old shorts. However, for this to sustain, we must see this emotional energy transition into New Money Buying (Initiative) .
• Observation: If price can hold these higher levels without immediate rejection, it confirms that "New Money" is entering to defend the breakout.
2. Structure & Targets
• Bias: I remain on the Long side at this moment. The breakout above the recent balance suggests the path of least resistance is toward the higher area (ATH).
• Condition: We need to see acceptance, not just a "look and fail." Continued short covering will naturally pull the auction higher.
3. The Risk (Liquidation)
• Support Check: If the buying dries up and we see Long Liquidation , the auction will likely rotate back to test the 4300 support area. This would be a test of the breakout's validity.
Plan & Execution
• Focus: Monitoring for volume and time acceptance at these highs.
• Invalidation: Loss of momentum returning to 4300.
Talk to you for the next update. b]Analysis
1. Market Context (Early US Session)
We are witnessing strong Short Covering in the early US session, continuing the momentum from yesterday where Gold traded above the previous multi-day range.
• The Driver: The vertical nature of the move confirms the exit of old shorts. However, for this to sustain, we must see this emotional energy transition into New Money Buying (Initiative) .
• Observation: If price can hold these higher levels without immediate rejection, it confirms that "New Money" is entering to defend the breakout.
2. Structure & Targets
• Bias: I remain on the Long side at this moment. The breakout above the recent balance suggests the path of least resistance is toward the higher area (ATH).
• Condition: We need to see acceptance, not just a "look and fail." Continued short covering will naturally pull the auction higher.
3. The Risk (Liquidation)
• Support Check: If the buying dries up and we see Long Liquidation , the auction will likely rotate back to test the 4300 support area. This would be a test of the breakout's validity.
Plan & Execution
• Focus: Monitoring for volume and time acceptance at these highs.
• Invalidation: Loss of momentum returning to 4300.
Talk to you for the next update.

XAUUSDLooking at the price of Gold from an internal structure view point .i can spot the structure building in lower highs, @ 4,335 & 4,328 respectively this signals to me that sellers ,are slowly moving into the market pricing and buyers maybe potentially getting weak .But however is buyers find their grove and are able to break above 4,335 and come down to give a higher low then buys will bid prices higher again.

XAU/USD 19 December 2025 Intraday AnalysisH4 Analysis:
-> Swing: Bullish.
-> Internal: Bullish.
Analysis and bias remains the same as analysis dated 20 October 2025.
Price has printed as per previous intraday expectation by printing a bearish CHoCH which indicates, but not confirms, bullish pullback phase initiation.
Price is currently trading within an established internal range, however, I will continue to monitor price with regards to depth of pullback.
Intraday expectation:
Price to continue bearish, react at either discount of 50% internal EQ, or H4 supply zone before targeting weak internal high priced at 4,380.990.
Note:
The Federal Reserve’s sustained dovish stance, coupled with ongoing geopolitical uncertainties, is likely to prolong heightened volatility in the gold market. Given this elevated risk environment, traders should exercise caution and recalibrate risk management strategies to navigate potential price fluctuations effectively.
Additionally, gold pricing remains sensitive to broader macroeconomic developments, including policy decisions under President Trump. Shifts in geopolitical strategy and economic directives could further amplify uncertainty, contributing to market repricing dynamics.
H4 Chart:
M15 Analysis:
-> Swing: Bullish.
-> Internal: Bullish.
Price has printed according to my analysis dated 15 December where I mentioned price will target weak internal high priced at 4,353.555 following bearish pullback to discount of 50% internal EQ.
Price has printed a bearish CHoCH, therefore, price is now contained within an established internal range.
Intraday expectation:
Price to trade down to either M15 demand zone, or discount of 50% internal EQ before targeting weak internal high, priced at 4,374.655
Note:
Gold continues to exhibit elevated volatility as markets digest the Federal Reserve’s ongoing dovish tilt and persistent global geopolitical tensions.
With uncertainty remaining a dominant theme across global risk assets, traders should prioritise disciplined risk management, as abrupt price swings and liquidity pockets may become increasingly common.
Furthermore, recent tariff announcements from President Trump, particularly those directed at China, have added another layer of instability to the macro landscape. These policy developments have the potential to intensify market turbulence, heighten risk‑off flows, and trigger sharp intraday reversals or whipsaw‑like behaviour in gold.
M15 Chart:

GBPUSD: Potential Correction from 1.34087 AheadWe might see the start of a downside correction for the Pound from 1.34087. Keep in mind that 1.34473 remains a highly critical level. CMCMARKETS:GBPUSD

Buyers Step Into WTI Crude OilGiven the high-volume buy bar around a decent support cluster, WTI could be set to mean revert higher.
Matt Simpson, Market Analyst at City Index.

Gold Context: Breakout from 4-Day Balance & Holiday ThinnessFOREXCOM:XAUUSD COMEX_MINI:MGCG2026 COMEX:GC1!
b]Analysis
1. Market Context (The Breakout)
We have observed Short Covering extending above the recent 4-day balance.
• Structure: Yesterday's push brought us nearly to the All-Time High (ATH). Today being Friday, the auction is positioned to test that extreme.
• The Driver: To sustain this breakout and reach the ATH, the initial short covering must transition into New Money buying (Initiative). Without this transition, the move risks being just an emotional inventory adjustment.
2. Scenario & Structure (The Tail)
• Bull Case: If short covering continues and attracts new buying interest, the ATH is the natural magnet.
• Bear Case (The Tail): Yesterday left a selling tail at the highs. If we see Liquidation (failure to hold gains), it confirms that the tail was a valid rejection by Higher Timeframe (OTF) Sellers defending the highs.
3. Holiday Caution (Thin Market)
We are approaching the Christmas and New Year holiday window.
• Risk: Trading volume is thinning out. Low volume markets can be erratic and lack structural integrity. Be careful of "false" moves driven by lack of liquidity rather than genuine value migration.
Plan & Execution
• Bias: Leaning toward the ATH test, but cautious of the "Tail" overhead.
• Invalidation: A drop back into the 4-day balance would negate the breakout and suggest the higher prices were rejected.
Talk to you for the next update.

Gold Eyes New ATH: Bullish Move from Current LevelsGold has the potential for a bullish move from the current price range toward 4,321.88 and onwards to a new ATH. However, the 4,308.66 level remains critical. CMCMARKETS:GOLD
